
The Big Picture
This week was dominated by Big Tech earnings and significant institutional activity. Over $15B+ in block trades crossed the tape on stocks with 1M+ share prints. Precious metals saw massive volume, while tech names diverged sharply post-earnings.
📈 Overall Market Context: SPY
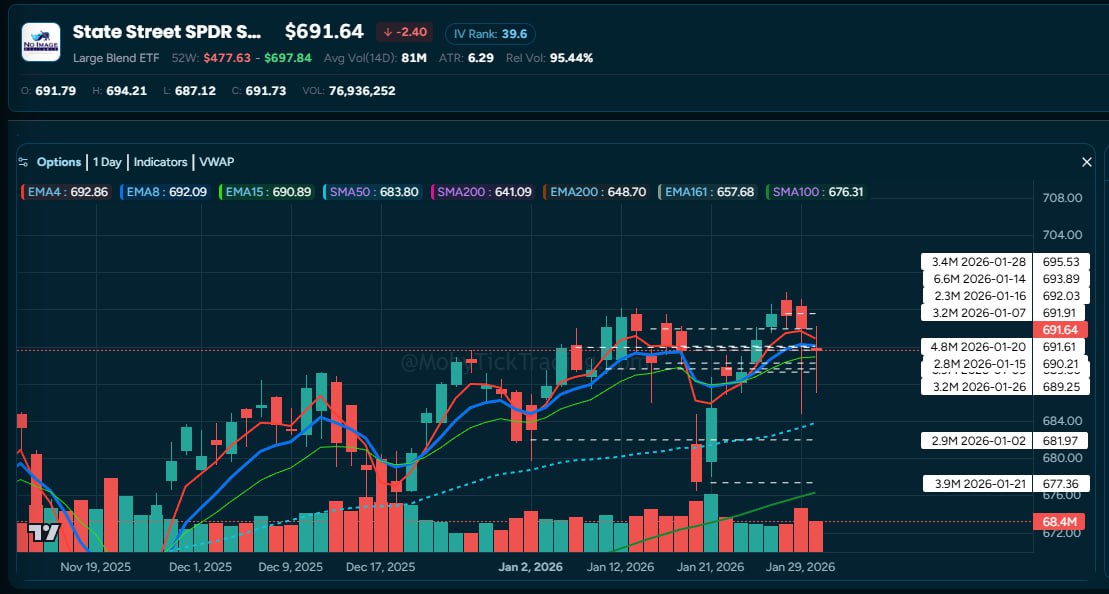
SPY daily chart with largest block trades. Source: MobyTick
The S&P 500 (SPY) shows institutions have been active in the $689-695 zone:
- 6.6M shares @ $693.89 (Jan 14)
- 4.8M shares @ $691.61 (Jan 20)
- 3.4M shares @ $695.53 (Jan 28)
- 3.2M shares @ $689.25 (Jan 26)
Current price: $691.64 — consolidating near all-time highs ($697.84).
Support zone: $677-681 marked by 3.9M and 2.9M share prints.
🥇 Precious Metals: Heavy Activity
Gold (GLD) — $3.4B+ in Prints
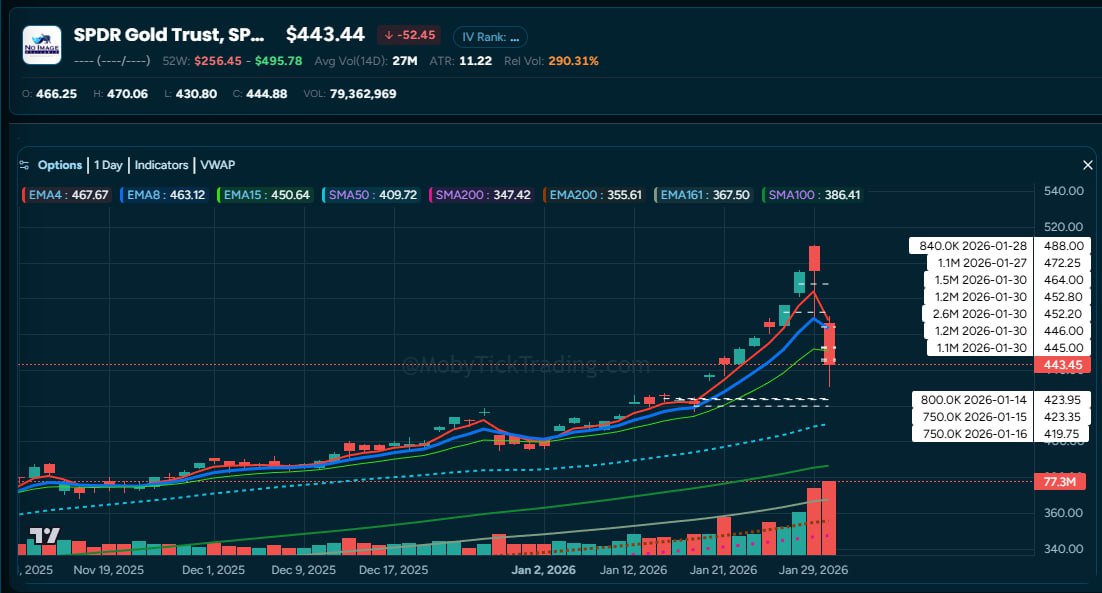
GLD daily chart showing massive institutional activity. Source: MobyTick
Gold (GLD) saw $3.4B+ in block trades this week — Friday alone had 7+ prints:
- 2.6M shares @ $452.20
- 1.5M shares @ $464.00
- 1.2M shares @ $452.80
- 1.2M shares @ $446.00
- 1.1M shares @ $445.00
Relative volume: 290% — institutions are active in precious metals.
Silver (SLV) — Profit-Taking in Action
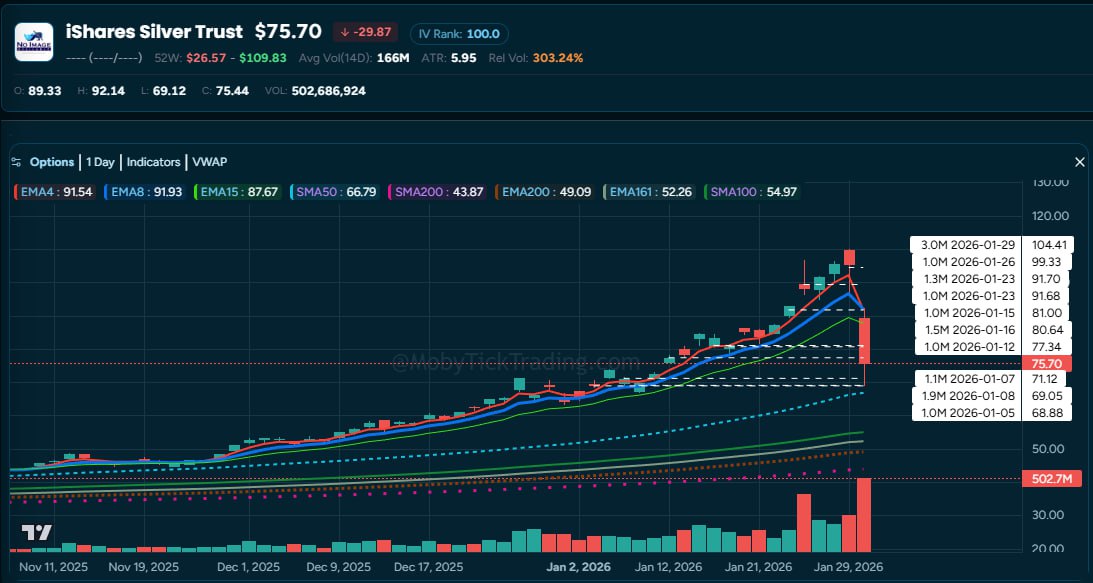
SLV daily chart showing prints well above current price. Source: MobyTick
SLV tells an important story about interpreting dark pool prints:
- 3.0M shares @ $104.41 (Jan 29)
- Current price: $75.70 — down $30 from that print
When prints are significantly ABOVE current price like this, it suggests profit-taking rather than new accumulation. Institutions who printed at $100+ levels are sitting on substantial gains.
📰 Earnings Week: Tech Divergence
Microsoft — Repositioning After Earnings
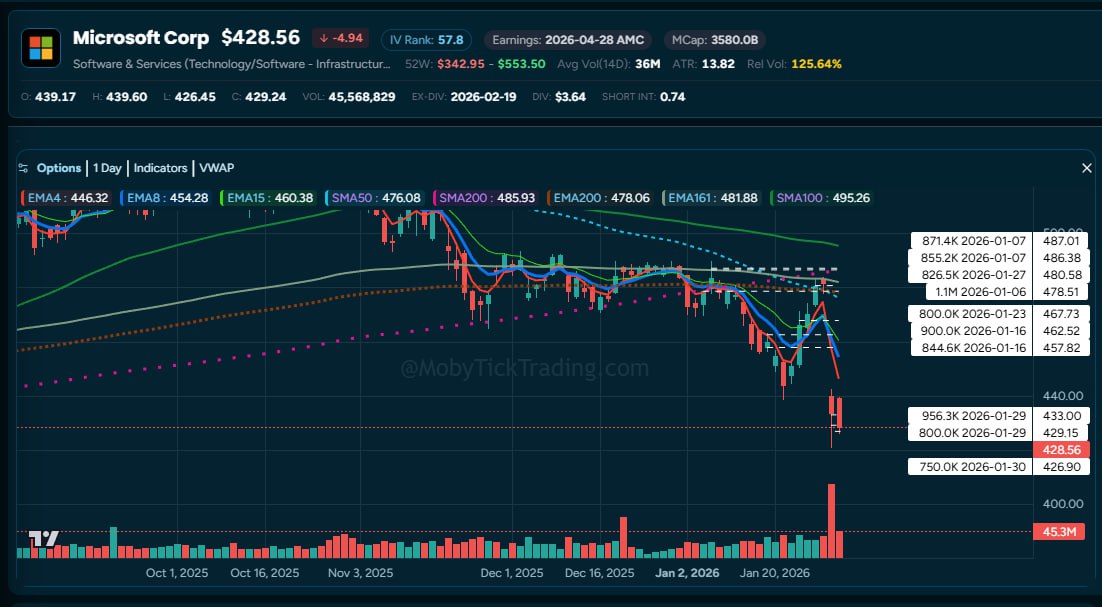
MSFT daily chart with largest block trades marked. Source: MobyTick
Early January saw heavy institutional prints at the $478-487 zone. Price tested this zone but couldn’t close above $480 heading into earnings on Jan 28th. Post-earnings gap down on slowing Azure cloud growth.
Today’s activity: 750K shares @ $426.90 marks potential new support.
Key levels:
- Support: $426-433 (new print zone)
- Resistance: $457-467 (mid-Jan prints)
- Major resistance: $478-487 (overhead supply)
Apple — Testing Resistance
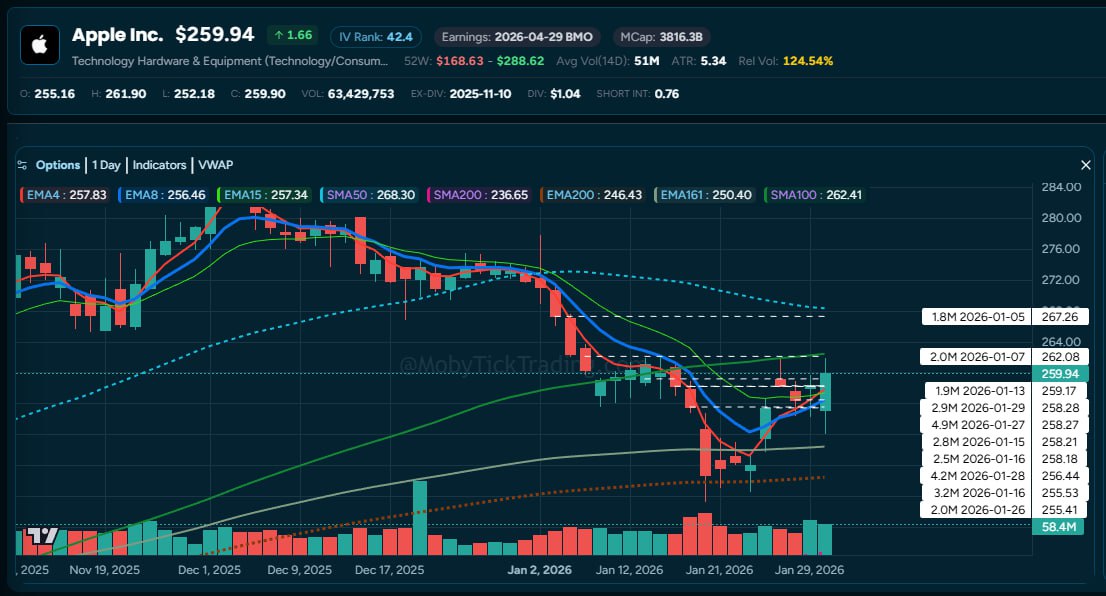
AAPL daily chart showing print levels. Source: MobyTick
Apple beat earnings estimates. Print cluster at $255-259 with multiple large trades providing support.
However, there’s a 2.0M share print at $262.08 overhead. For the next leg higher, AAPL needs to close above $264 to clear this resistance and target the $267 print level.
Current price: $259.94 — holding above support but facing overhead supply.
💎 Semiconductors
NVIDIA — Double Top Pattern
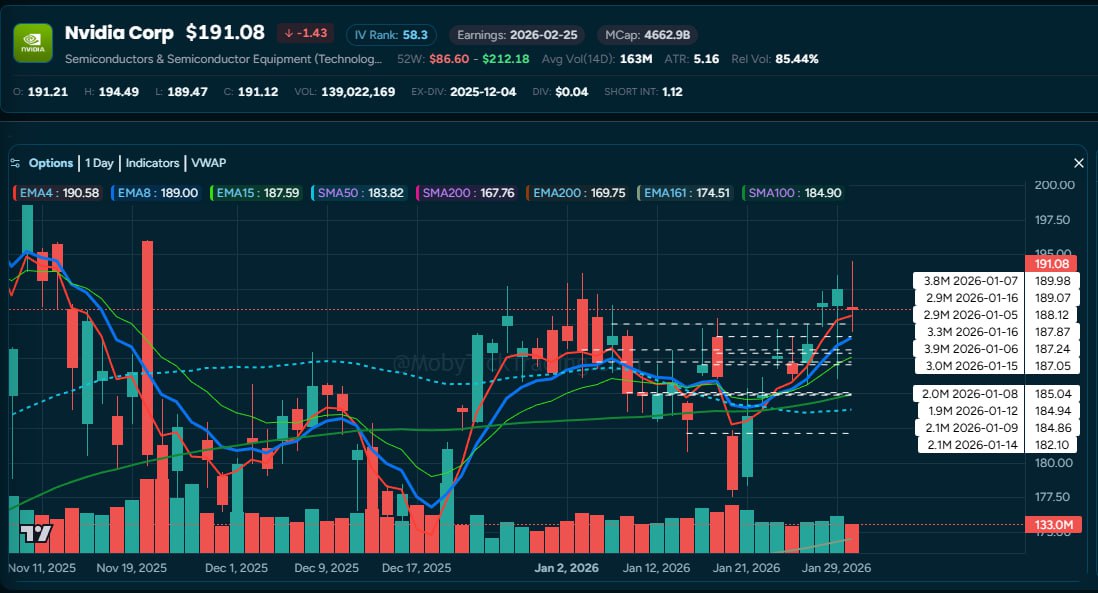
NVDA daily chart showing two print clusters. Source: MobyTick
NVDA shows two institutional print clusters at $182-185 and $187-190.
Current price: $191.08 — but forming a potential double top pattern. For confirmation of continued strength, NVDA needs to close strong above $195. Until then, this is a consolidation, not a confirmed breakout.
Micron — Profit-Taking After Big Run
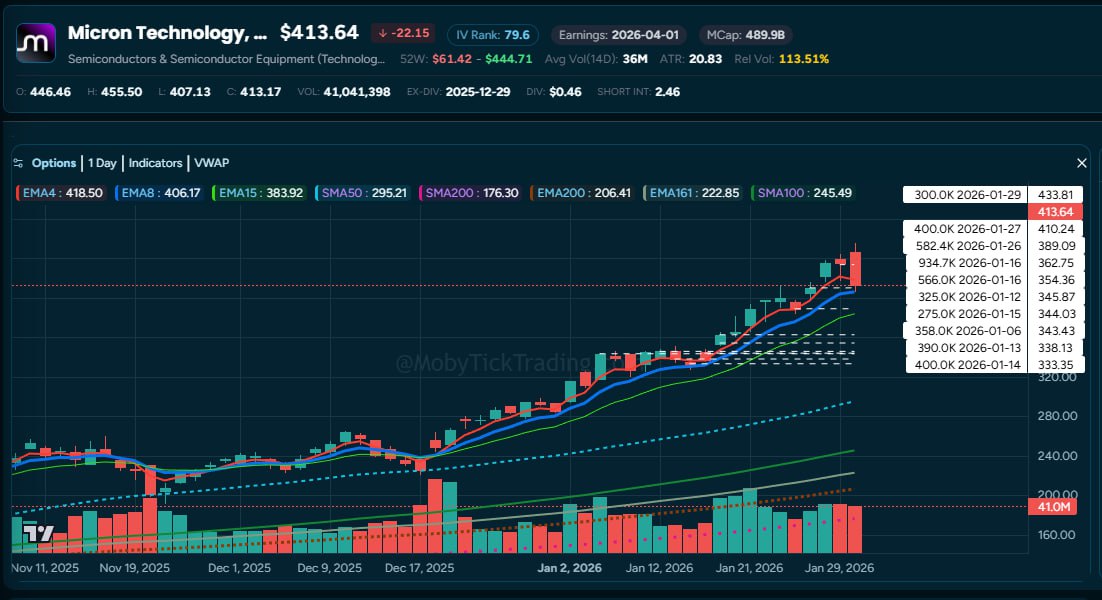
MU daily chart showing institutions positioning throughout the rally. Source: MobyTick
MU tells the clearest institutional story of the week:
- Institutions printed all the way up from $333 to $433
- Most prints are $100+ below the recent high
- Today: Down $22 on heavy volume
The takeaway: institutions built positions well below current levels over the past 30 days. Today’s selloff suggests profit-taking after a massive run. Watch for new prints to mark the next support zone.
⚠️ CVNA: Repricing Event
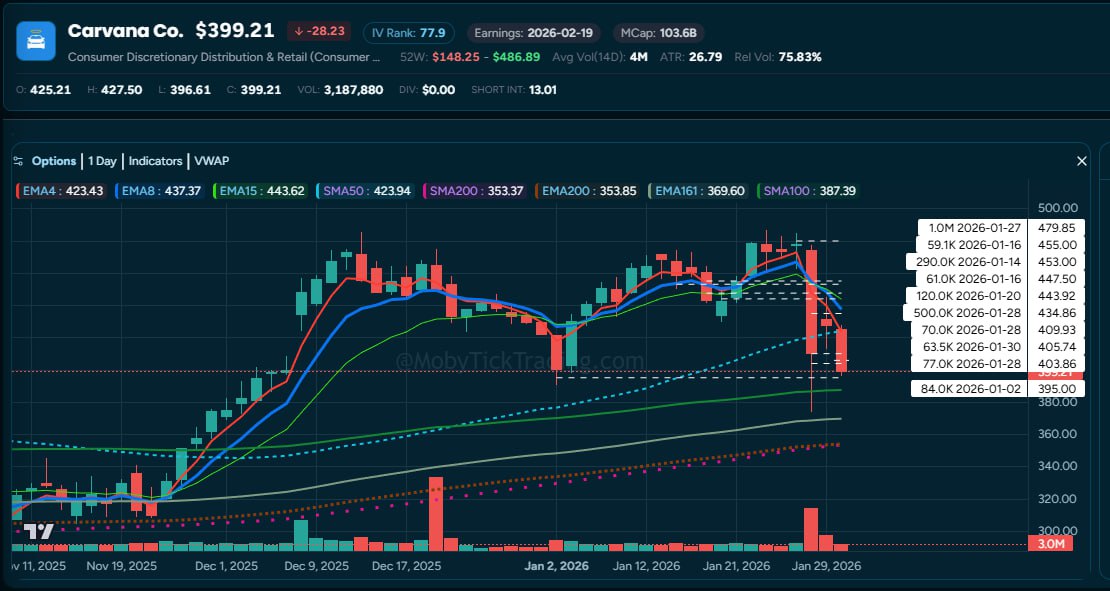
CVNA daily chart showing repricing from $479 to $399. Source: MobyTick
Carvana shows dramatic repricing:
- 1.0M shares @ $479.85 (Jan 27) — at the top
- Current price: $399.21
- Short interest: 13%
Watch for new prints to mark the next support zone. The $395-$400 area may provide a floor.
🔮 Key Observations
- Prints show activity, not intent — SLV’s $104 print with price at $75 = profit-taking, not accumulation
- Overhead prints create resistance — AAPL needs $264 to clear the 2M print above
- Technical confirmation matters — NVDA double top needs close above $195
- Check today’s close — MU down $22 changes the narrative from “strength” to “profit-taking”
Key Takeaways
- Follow the prints, but interpret carefully. Large prints above current price may signal profit-taking.
- Print levels become support AND resistance. Overhead prints create supply to work through.
- Today’s action matters. Always check how price closed before drawing conclusions.
- Semis had a big week. MU institutions built positions $100+ below highs — watch for support on pullbacks.
Data sourced from MobyTick dark pool tracking. Charts show block trades of 400K+ shares.
Want real-time dark pool alerts? Try MobyTick free →