The Fund Is Moving Your Stock
Every stock sits inside funds, and a block in the fund moves the stock. See the holdings both ways, and whether the two are still aligned.
ETF Lookup provides dual intelligence for day traders, swing traders, and position traders. Enter any ETF to see its actual holdings and concentration risk, or enter any stock to discover which ETFs hold it and in what percentages. Connect dark pool ETF activity to individual stock impact and stop buying blind.
Configuration Options
Customize every aspect to match your trading style
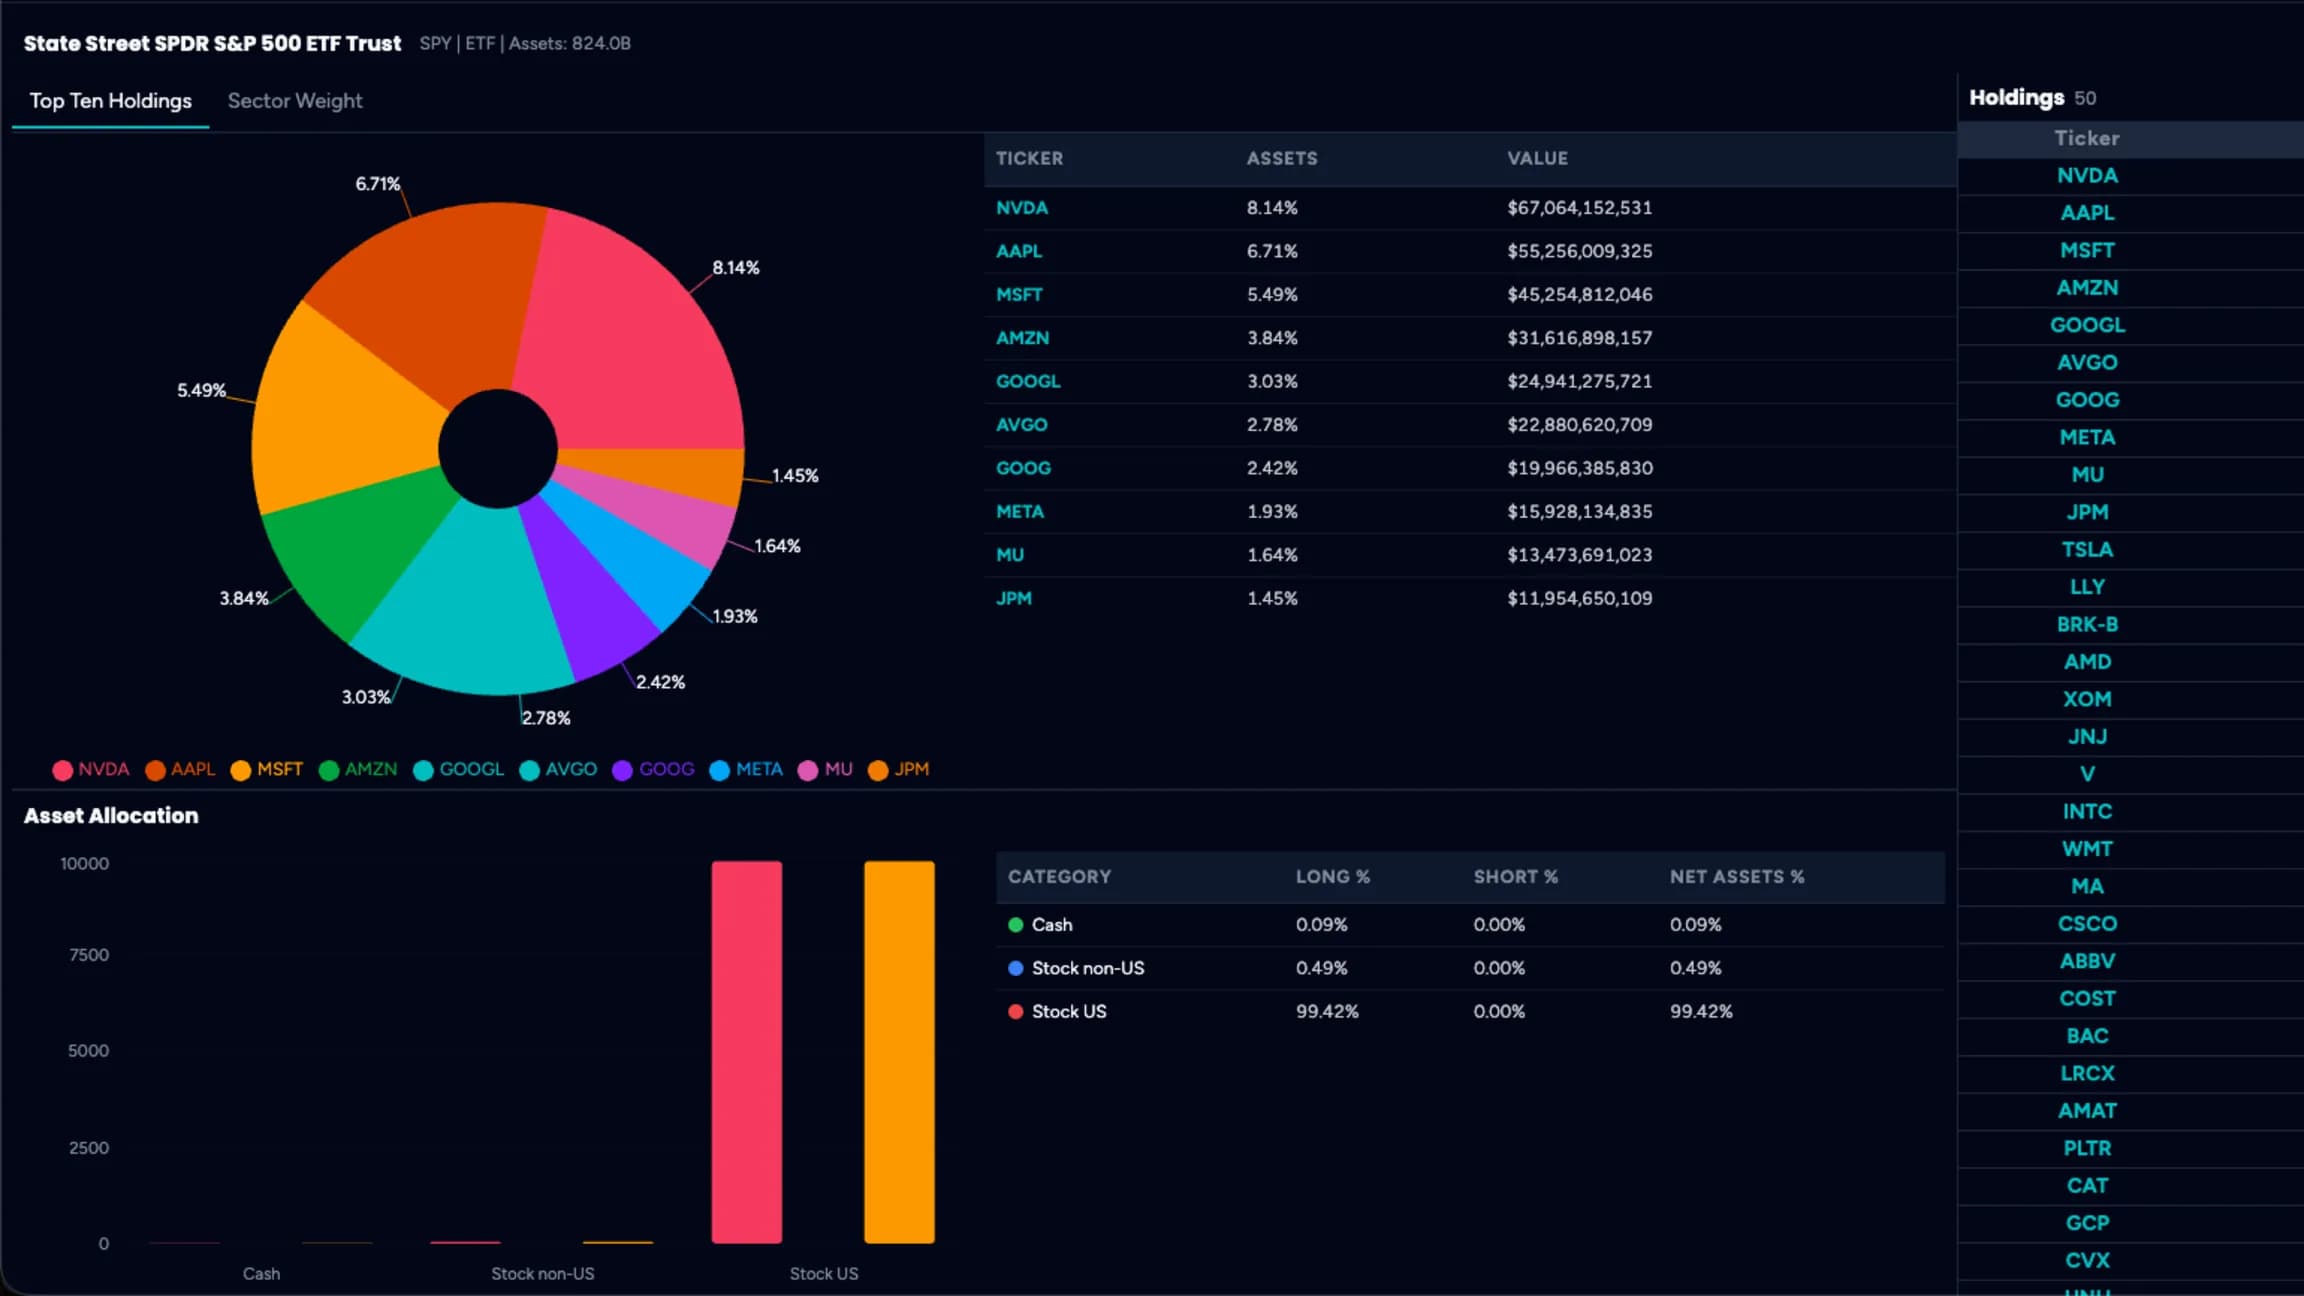
Enter any ETF to see complete holdings breakdown with percentages
Enter any stock to see which ETFs hold it and concentration levels
Pie charts and detailed tables show exact asset allocation
See both percentage weights and actual dollar amounts
Quickly identify the largest positions and concentration risks
Understand sector allocation within ETFs
Holdings data updated regularly to reflect current positions
How to Use for Profitable Trading
Follow these steps to maximize your trading edge
- See massive block trades on SPY through BTI? Check if it's 7.58% NVDA affecting your positions
- Monitor dark pool ETF activity and understand underlying stock implications
- Identify when ETF flows could impact your individual stock holdings
- Use ETF intelligence to predict individual stock pressure or support
- Enter popular ETFs like SPY, QQQ, or IWM to see actual holdings
- Identify concentration risk (like tech weighting in major indices)
- Check if ETF holdings align with your investment thesis
- Avoid ETFs with unwanted sector or stock concentrations
- Enter individual stocks to see which ETFs hold them and in what percentages
- Identify ETFs with highest concentration of your target stock
- Compare QQQ (9.51% NVDA) vs SPY (7.58% NVDA) for better exposure
- Use ETF options instead of individual stock options for better liquidity
- Avoid overlap in ETF holdings across your portfolio
- Ensure true diversification by understanding what you actually own
- Select ETFs that complement rather than duplicate your individual positions
- Adjust position sizes based on underlying stock concentration
See the prints on your own charts
Join traders who follow institutional money.
Cancel anytime • Full access to all features