Stop Platform Hopping
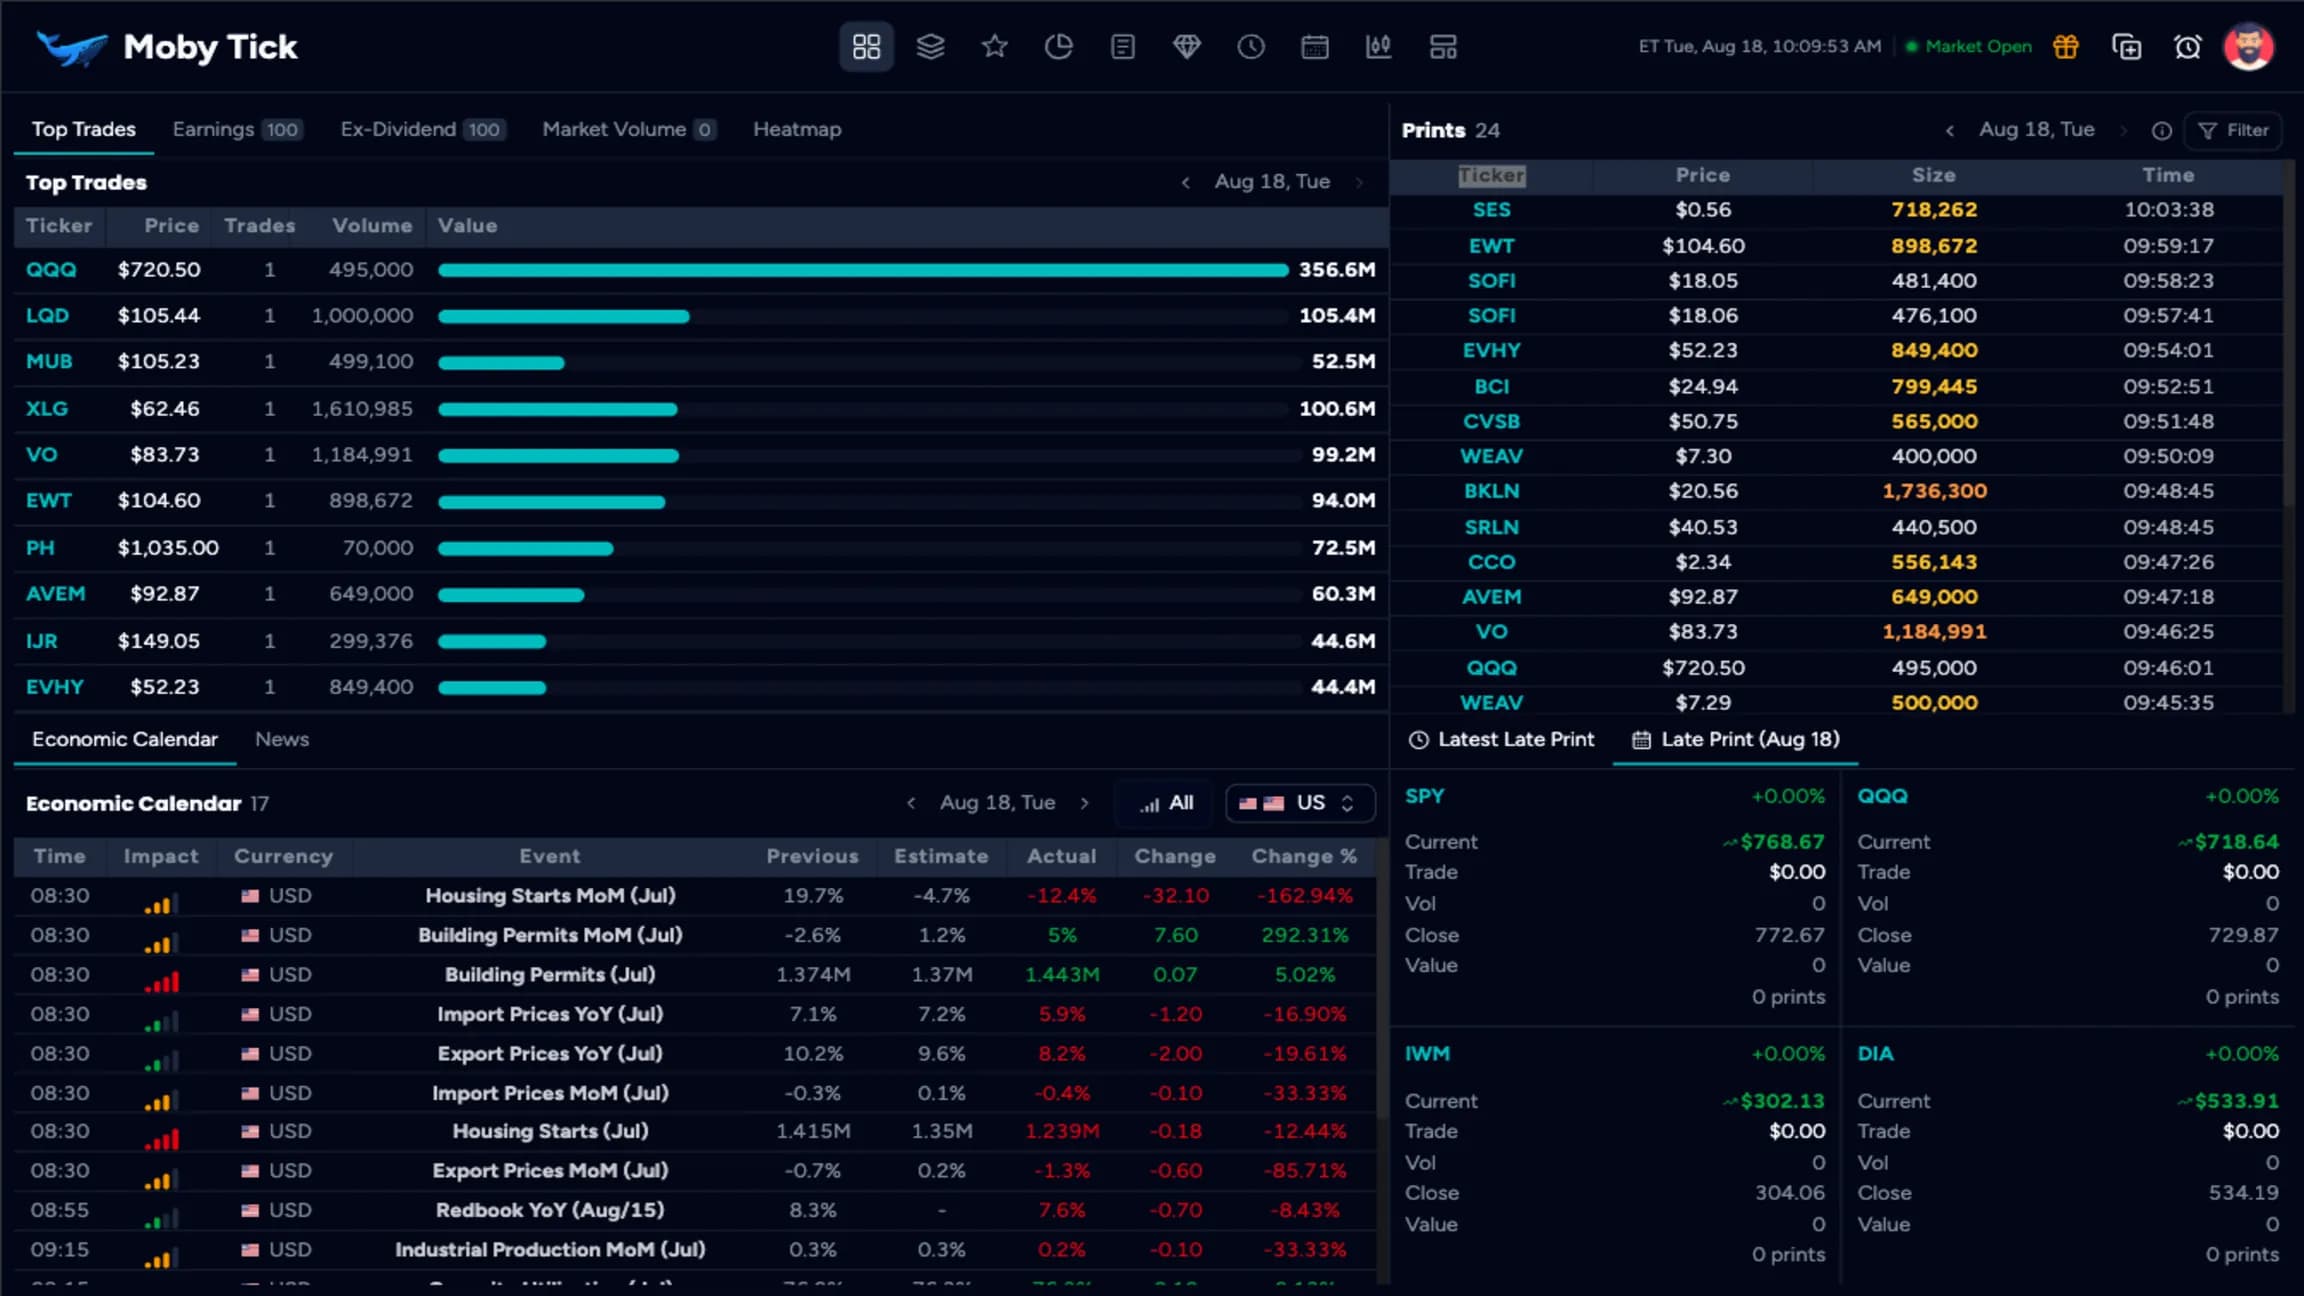
Block history, the economic calendar, earnings and ex-dividend dates in a single session view — the context you'd otherwise assemble from four platforms.
Market Dashboard provides a live snapshot of today's trading session for day traders, swing traders, and position traders. See current volume leaders, today's institutional prints, pre-market movers, earnings events, and real-time market activity—everything happening in today's market from one screen.
Configuration Options
Customize every aspect to match your trading style
Live tracking of institutional flows across all sectors
Visual representation of where institutional money is flowing
Earnings and Ex-Dividend dates visualization
Largest institutional trades across all markets
Institutional buying vs. selling pressure
See current and upcoming economic events
How to Use for Profitable Trading
Follow these steps to maximize your trading edge
- Review Market Volume tab for pre-market movers and unusual activity
- Check economic events section for market-moving news and data releases
- Examine Late Prints data to see overnight institutional activity
- Identify potential day trading and intraday setups before market open
- Scan the Prints section (top right) to see which stocks had block trades today
- Review Top Trades section to see where the most institutional money flowed
- Filter prints by share size to focus on your preferred trade sizes
- Sort by ticker, price, or size to organize your research priorities
- Add stocks with significant prints to your watchlist for deeper analysis
- Use Print Lookup to examine historical institutional levels on selected stocks
- Cross-reference current prints with BTI alerts for real-time confirmation
- Prioritize stocks showing both historical and current institutional activity
- Monitor volume leaders throughout the session for momentum opportunities
- Track earnings events that could trigger institutional repositioning
- Watch for continuation patterns in stocks with morning institutional activity
- Review end-of-day prints to identify potential next-day setups
See the prints on your own charts
Join traders who follow institutional money.
Cancel anytime • Full access to all features