Where Institutions Actually Traded
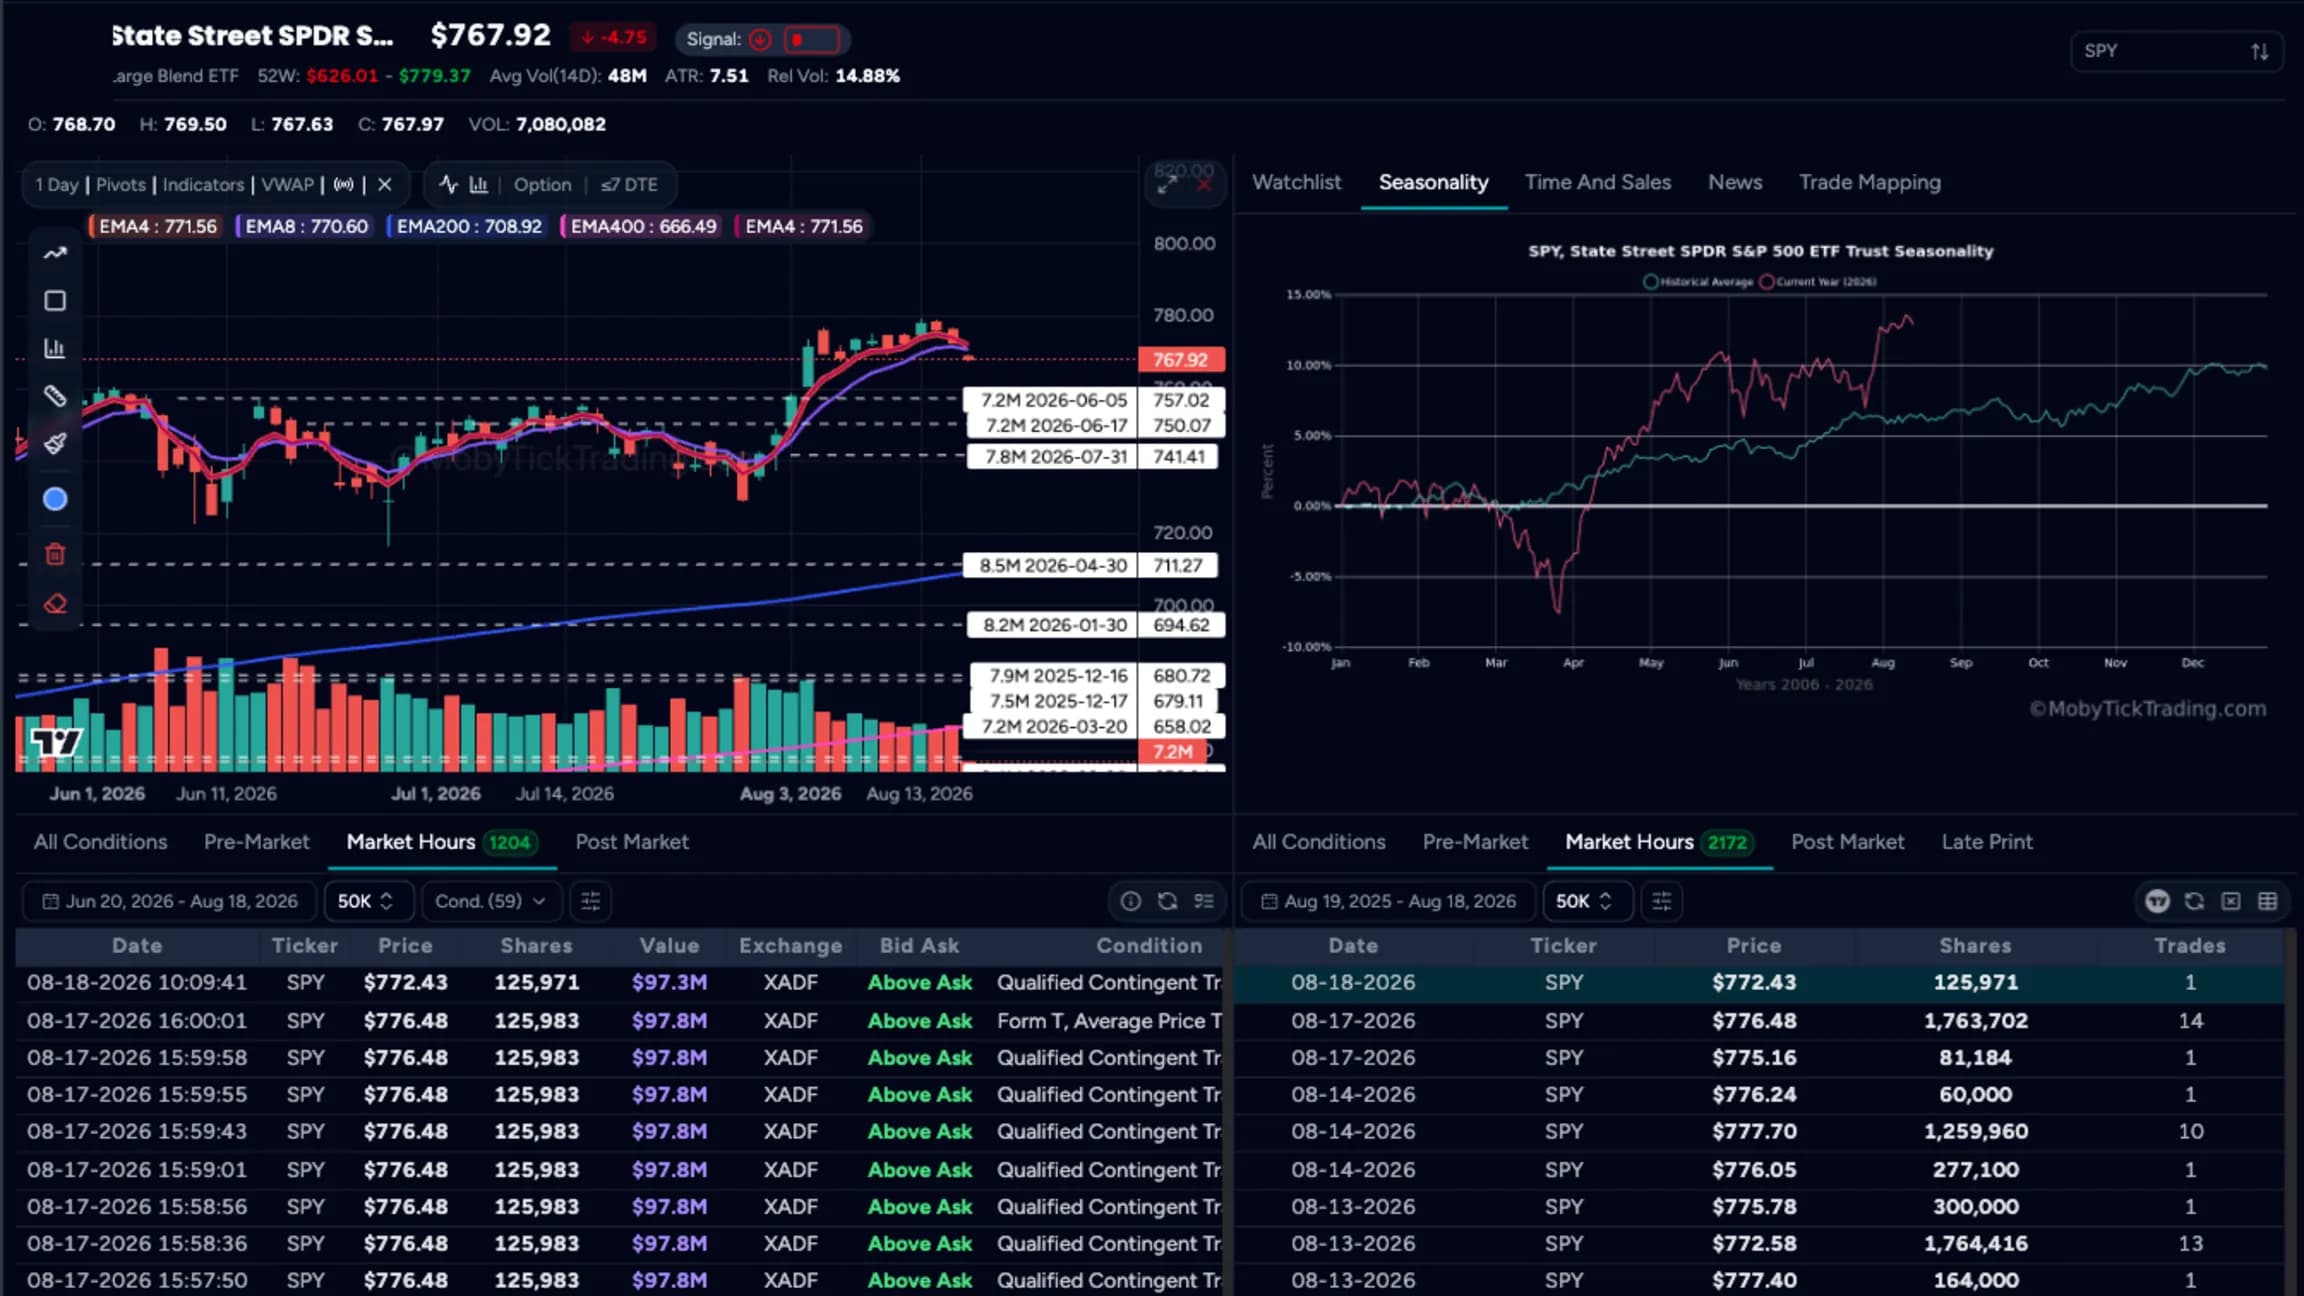
Six years of off-exchange prints drawn onto the chart. Not where price went, but where institutional size actually changed hands.
Print Lookup overlays 5+ years of institutional dark pool trades directly on your charts for day traders, swing traders, and position traders. See the actual order blocks where smart money accumulated and distributed. Stop getting stopped out at fake levels—trade the real institutional support and resistance.
Configuration Options
Customize every aspect to match your trading style
Browse 5+ years of block trade data back to January 2020
Overlay dark pool prints directly on any stock chart
View only trades above your specified minimum thresholds
Focus on specific time periods for pattern analysis
See institutional activity across daily, weekly, monthly charts
Color-code different trade sizes for visual clarity
Save institutional level data for offline analysis
How to Use for Profitable Trading
Follow these steps to maximize your trading edge
- Search for any stock ticker to see all historical block trades
- Set your preferred minimum trade size filter (100K, 500K, 1M+ shares)
- Choose your timeframe (last 6 months, 1 year, or full 5+ years)
- Look for clusters of large prints at similar price levels
- Mark institutional accumulation zones (heavy buying activity)
- Identify distribution areas (large selling activity)
- Note unusual size prints that indicate major institutional interest
- Use institutional accumulation levels as support for long entries
- Target institutional distribution levels as resistance for exits
- Set stops below major institutional support levels
- Size positions based on proximity to institutional order blocks
- Compare historical prints with live BTI signals
- Look for confluences between past and present institutional activity
- Validate breakouts above institutional resistance levels
- Confirm reversals at institutional support zones
See the prints on your own charts
Join traders who follow institutional money.
Cancel anytime • Full access to all features