
Weekly Dark Pool Report — Apr 13, 2026: Ceasefire Rally Sparks Sector Rotation
•Dave @ Moby Tick

Market Overview: Ceasefire Rally Breaks 7-Session Win Streak
The S&P 500 staged its best weekly gain since November 2025 (+3.56%) following the announcement of a U.S.-Iran ceasefire agreement mid-week. April 8 was the standout day — the S&P 500 surged 2.51% to 6,782.81 and the Nasdaq surged 2.80% to 22,635.00, marking the best single-day gain since April 2025. The rally ran into resistance Friday as March CPI data showed inflation surged 0.9% MoM (3.3% YoY) — driven by the sharpest monthly gas price increase since 1967.
Weekly Index Performance
| Index | Mon 4/7 Open | Fri 4/10 Close | Weekly |
|---|---|---|---|
| S&P 500 (SPY) | $656.65 | $679.46 | +3.56% |
| Nasdaq 100 (QQQ) | $585.64 | $612.49 | +3.61% |
| Russell 2000 (IWM) | $251.21 | $261.30 | +3.89% |
| Dow Jones (DIA) | ~$48,500 | ~$48,071 | +3.61% |
Key Market Metrics
| Metric | Level |
|---|---|
| Brent Crude Oil | ~$96/barrel (eased from $109 peak) |
| VIX | 19.23 (elevated, easing) |
| Gold | $4,787/oz |
| 20-Yr Treasury (TLT) | $86.49 (yields elevated) |
| March CPI 2026 | +0.9% MoM | 3.3% YoY (sharpest gas increase since 1967) |
What Moved Markets
- Iran Ceasefire: Trump announced a U.S.-Iran ceasefire agreement mid-week. April 8 was the standout day — S&P 500 surged 2.51%, Nasdaq 2.80%. Best single-day gain since April 2025.
- Oil Retreat: Brent crude peaked at ~$109/barrel before the announcement, then retreated to $95.92/barrel by Thursday. Goldman Sachs warned Brent could average above $100/barrel even with ceasefire — and $115 if the truce fails.
- March CPI Spike: First CPI reading since the Iran war began Feb 28. Inflation surged 0.9% MoM and 3.3% YoY — the sharpest monthly gas price increase since 1967. S&P 500 and Nasdaq gave back gains Friday.
- Tech Leadership: NVDA (+2.58%) and AVGO drove the Nasdaq on April 9. Semiconductor names led the post-ceasefire risk-on rotation.
- 7-Session Win Streak Ends: S&P 500 closed Friday Apr 10 at 6,816.89 (-0.11%) — snapping a seven-session winning streak.
- Good Friday: Market closed April 3, so this report covers the abbreviated 4-day trading week (Apr 7–11).
⭐ Where the Smart Money Moved — Week of Apr 7–11
This week’s dark pool data reveals a dramatic sector rotation following the Iran ceasefire. Energy (XLE) dominated the prior week on oil spikes — but the ceasefire triggered a swift rotation out of energy and into broad market ETFs and technology.
Broad Market ETF Dark Pool Flow
| ETF | Shares | Total Value | # Prints |
|---|---|---|---|
| SPY | 20,582,478 | $13.74B | 45 |
| QQQ | 14,300,650 | $8.58B | 43 |
| IWM | 19,538,543 | $5.02B | 50 |
| VOO | 1,126,391 | $699M | 9 |
| IVV | 1,012,464 | $685M | 9 |
| SPYM | 14,239,363 | $1.11B | 25 |
Sector Dark Pool Flow
| Sector | Dark Pool Value | # Prints | Signal |
|---|---|---|---|
| XLE (Energy) | $572M | 50 | Ceasefire rotation IN |
| XLF (Financials) | $812M | 43 | Rate uncertainty |
| XLK (Technology) | $377M | 9 | Ceasefire tech rotation |
| XLU (Utilities) | $220M | 18 | Defensive |
| XLP (Consumer Staples) | $266M | 17 | Moderate |
| XLY (Consumer Disc.) | $65M | 6 | Continued weakness |
KEY INSIGHT: Last week XLP dominated at $1.14B with a 7.5:1 ratio over XLY. This week the rotation reversed: XLE ($572M, 50 prints) took over as the ceasefire-driven risk-on trade pulled institutions out of defensive consumer names. SPY ($13.74B, 45 prints) dominated broad market flow.
Last Week’s Callout Performance — Apr 6–10
Previous callouts published before the Iran ceasefire rally. Here is how each setup performed. Bull triggers hit 9 of 13 times with 23 total bullish targets triggered.
| Ticker | Bull Trigger | Weekly High | Bear Trigger | Weekly Low |
|---|---|---|---|---|
| SPY | $660 | $658.52 [T4 close] | $645 | $637.98 [Bear T2 hit] |
| QQQ | $587.50 | $587.74 [T5 HIT] | $577 | $564.21 [Bear T0 hit] |
| IWM | $253 | $252.44 [No trigger] | $246 | $242.24 [Bear T1 hit] |
| TSM | $350 | $348.68 [No trigger] | $322.50 | $321.14 [Bear T0 hit] |
| TER | $305 | $316.81 [T2 HIT] | $290 | $277.93 [Bear T2 HIT] |
| MU | $372.50 | $377.89 [T0 HIT] | $350 | $311.49 [Bear T3 HIT] |
| BP | $47 | $48.27 [T2 HIT] | $44.75 | $45.56 |
| AVGO | $312.50 | $315.79 [T1 HIT] | $297.50 | $296.34 [Bear T0 hit] |
| TERN | $53.25 | $52.89 [No trigger] | $50 | $52.65 |
| MCD | $312.50 | $311.68 [No trigger] | $304.75 | $303.03 [Bear T0 hit] |
| UNH | $272.50 | $279.04 [T2 HIT] | $257 | $262.61 |
| META | $550 | $592.55 [T6 HIT] | $517.50 | $546.77 |
| NVDA | $173 | $177.49 [T1 HIT] | $165 | $166.96 |
$SPY — S&P 500 ETF
Dark Pool Print: $13.74B dark pool flow | 20.6M shares | 45 prints
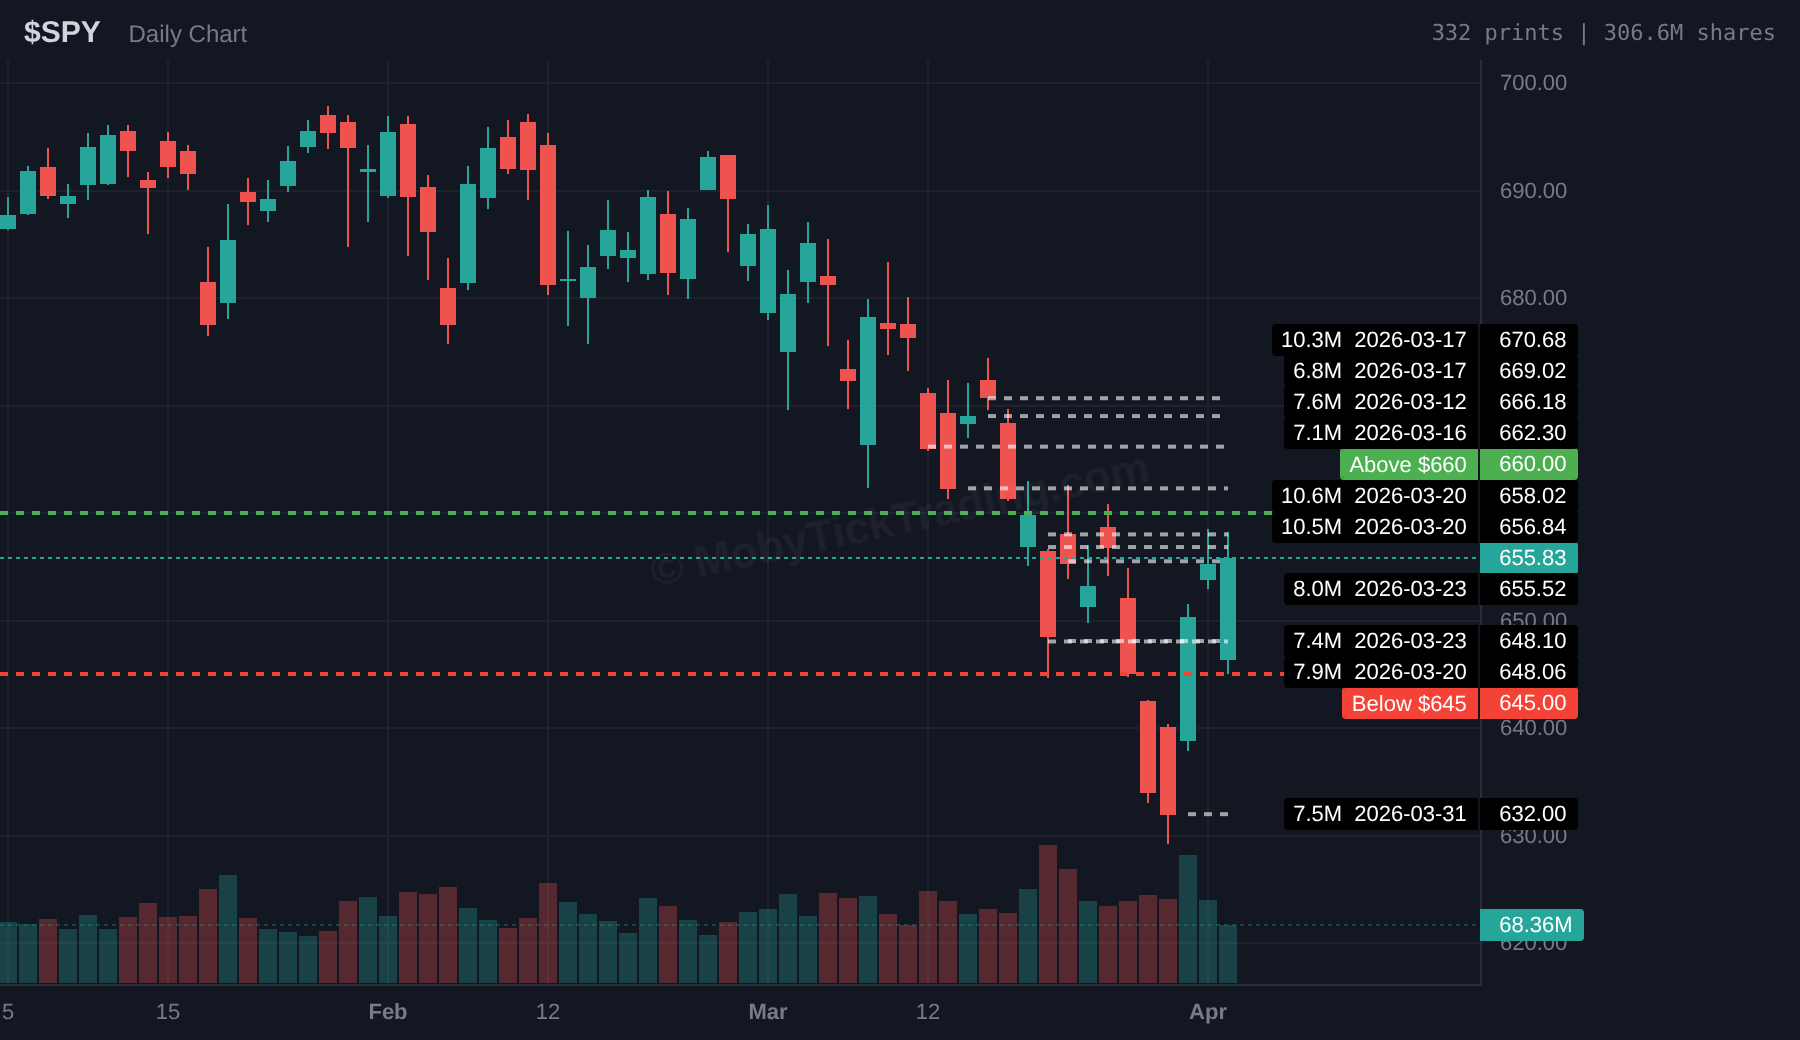
- SPY saw $13.74 billion in dark pool prints this week — the Iran ceasefire drove a broad market rally. The S&P 500 gained 3.56% for the week, snapping a seven-session winning streak on Friday.
- Institutional prints ranged from $651 to $682 this week. The largest prints clustered at the $662-$670 range early in the week.
- The Iran ceasefire was announced mid-week, sparking the sharpest two-day rally since April 2025. The S&P 500 closed Thursday at 6,816.89 — but gave back gains Friday as CPI data showed March inflation surged 0.9% MoM (3.3% YoY).
$QQQ — Nasdaq 100 ETF
Dark Pool Print: $8.58B dark pool flow | 14.3M shares | 43 prints
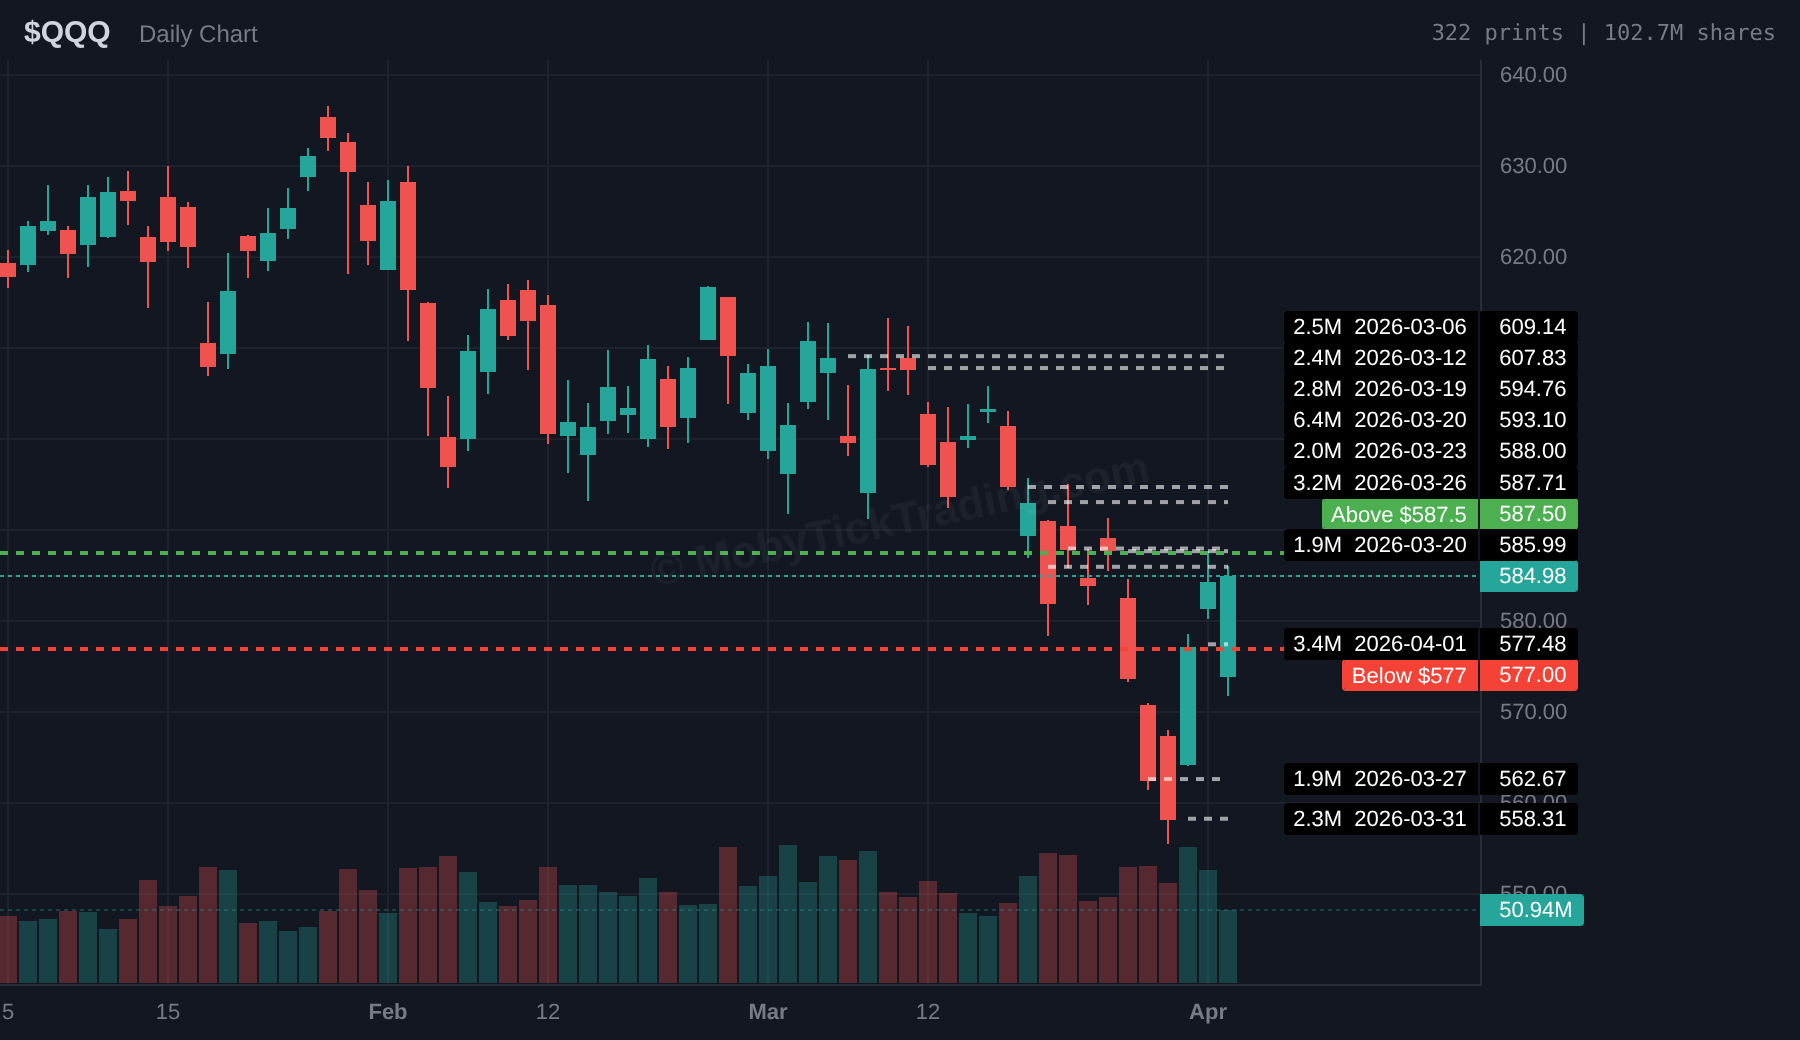
- The Nasdaq led this week’s rally with consistent institutional buying throughout. The ceasefire-driven risk-on move favored tech heavy names.
- QQQ gained despite Friday’s mixed close. Semiconductor stocks (NVDA +2.58%, AVGO) drove the Nasdaq higher on April 9.
- Energy sector rotation reversed as oil prices eased on the ceasefire news. XLK received $377M in dark pool flow vs. XLRE ($73M).
$IWM — Russell 2000 ETF
Dark Pool Print: $5.02B dark pool flow | 19.5M shares | 50 prints
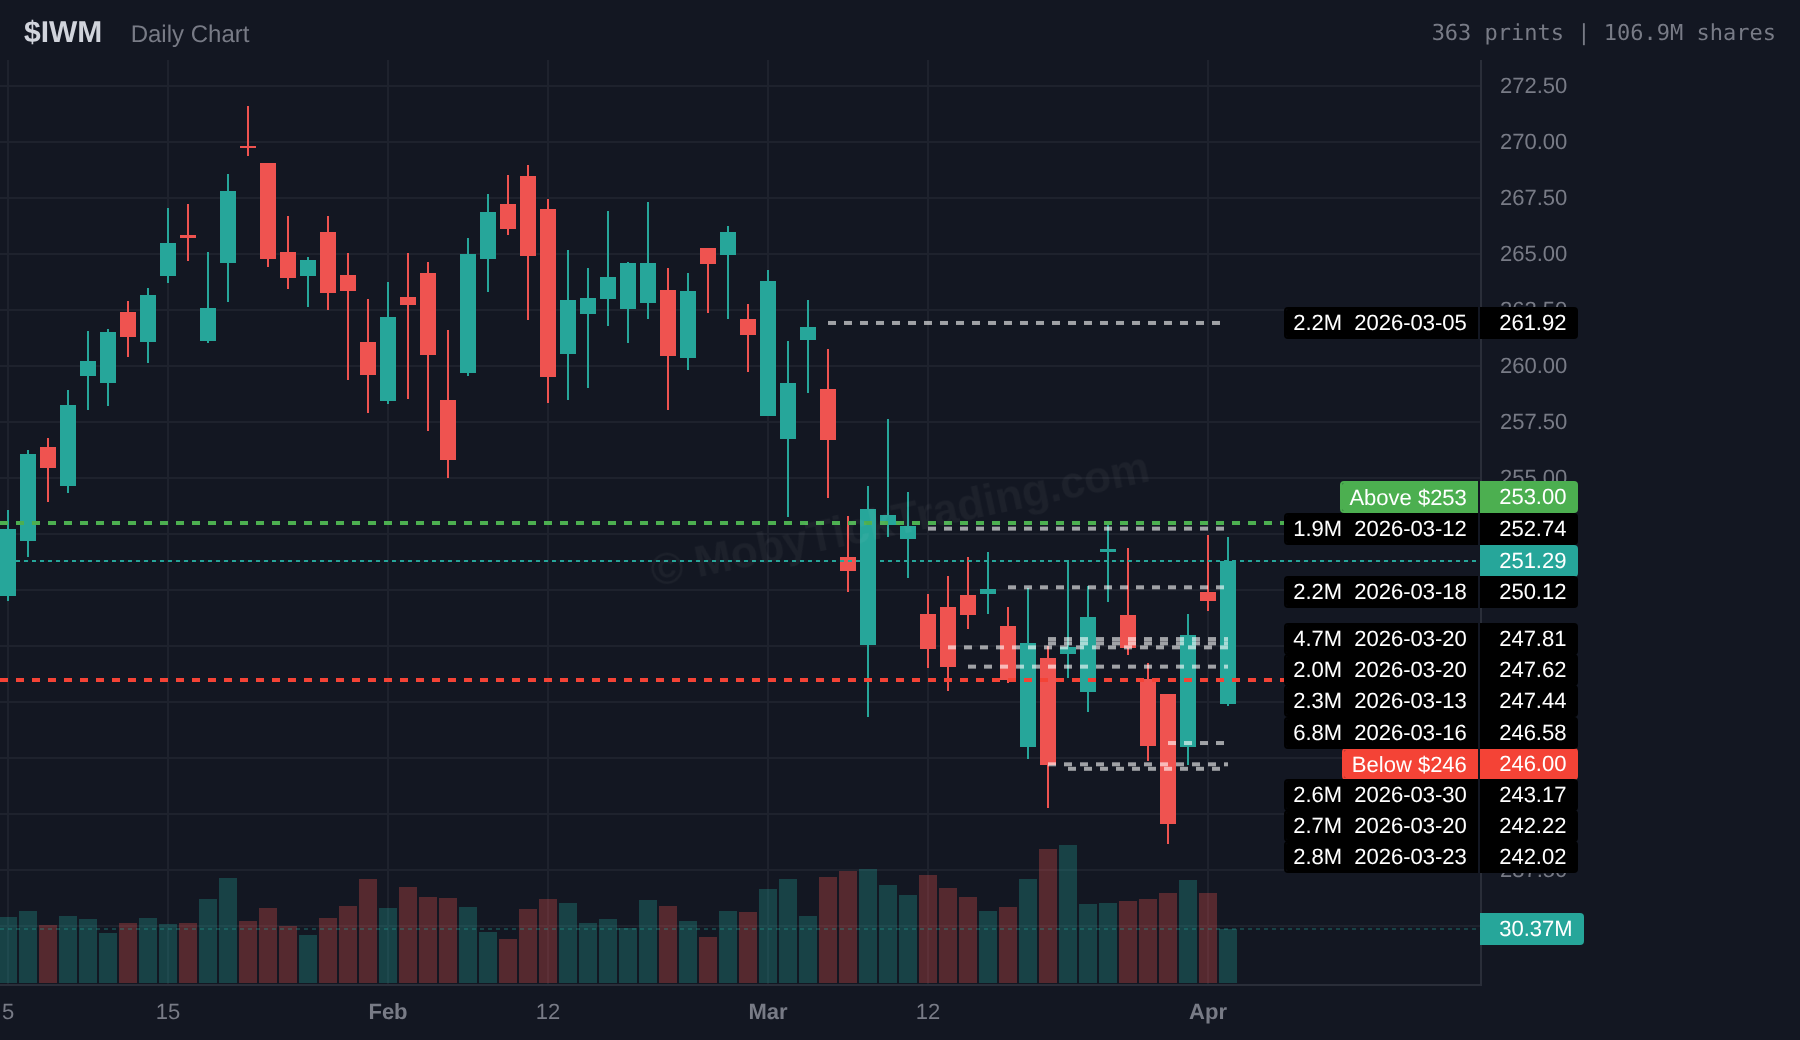
- IWM received notably heavy dark pool flow ($5.02B) this week — the most active small-cap week in recent memory.
- Prints ranged from $249 to $262 — consistent with the post-ceasefire small-cap rotation.
- Small caps remain sensitive to the ceasefire durability question.
$CRM — Salesforce
Dark Pool Print: $2.65B+ dark pool flow | 14 prints | 18% of ADV30
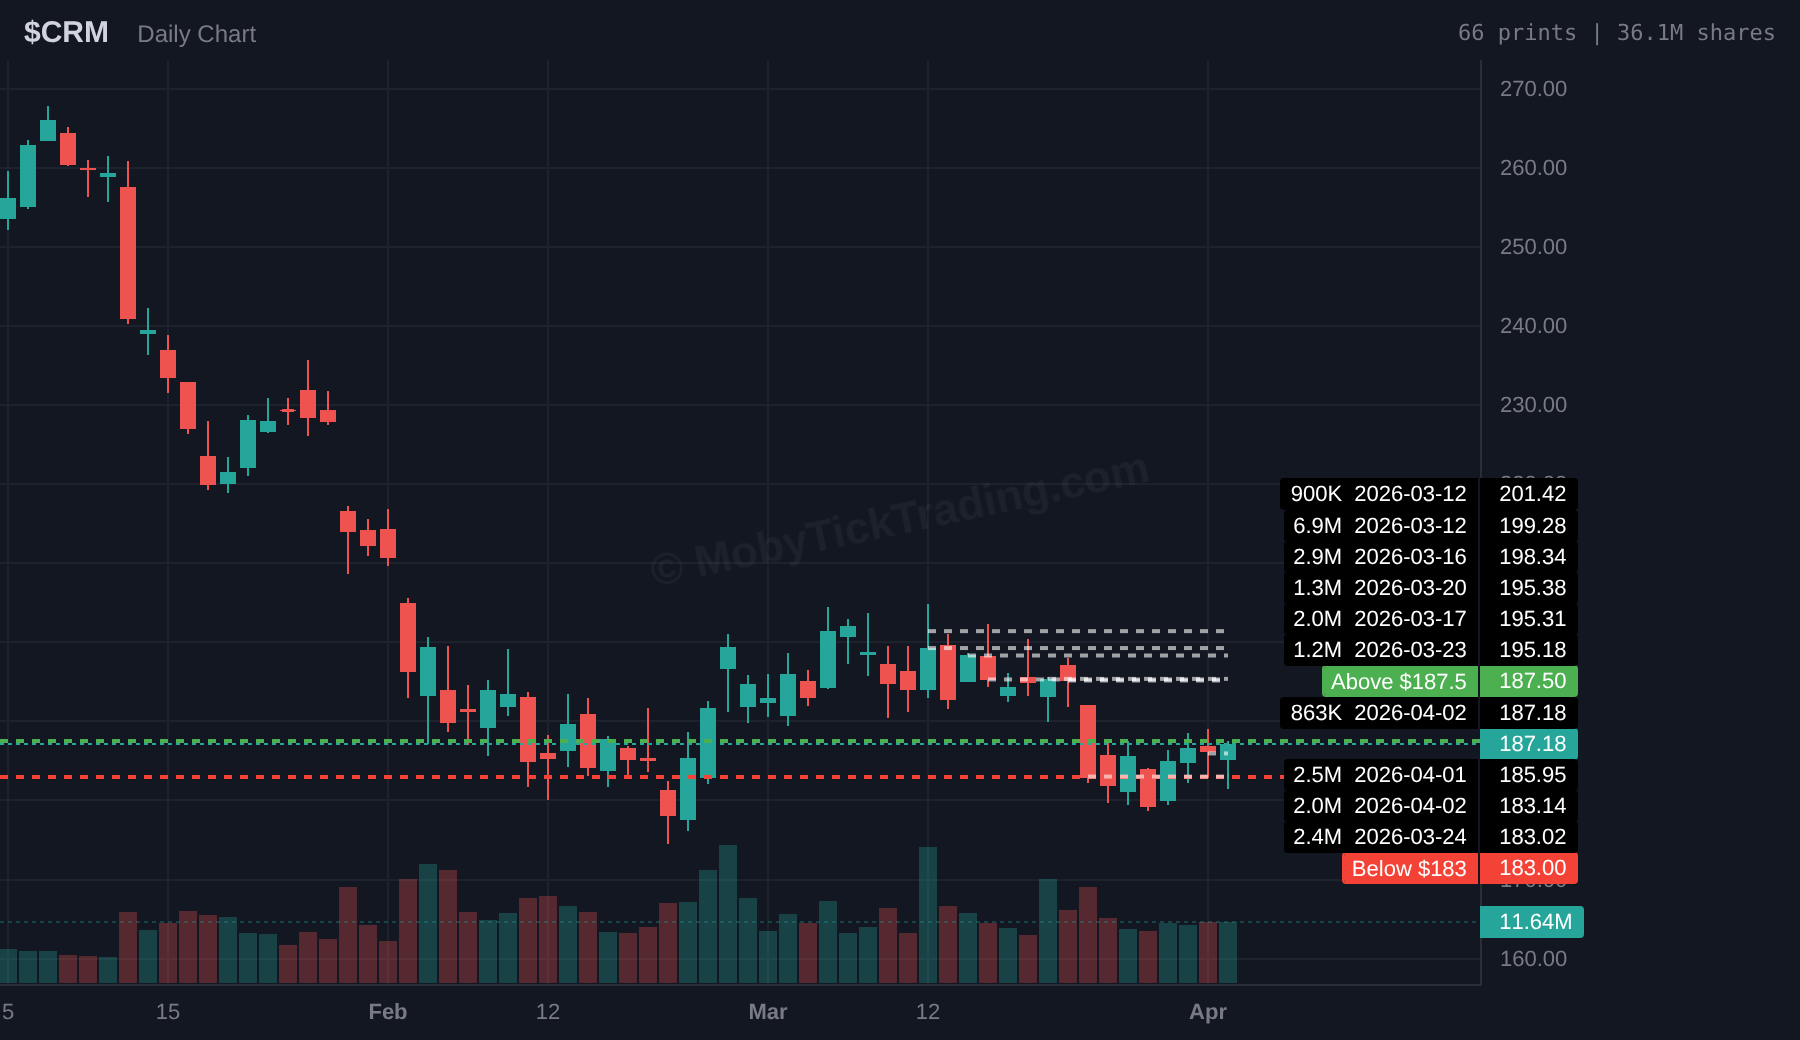
- CRM fell from $170.85 to $164.75 this week — one of the worst-performing S&P 500 stocks (-3.43% Thursday alone).
- The dark pool data tells a different story: 3 large prints totaling $2.65B+ crossed at $170-186 this week.
- The stock is down 26% from $220+ in January. A $50B share buyback was announced alongside a Buy rating from TipRanks.
$GOOGL — Alphabet
Dark Pool Print: $1.98B dark pool flow | 14 prints | 14% of ADV30
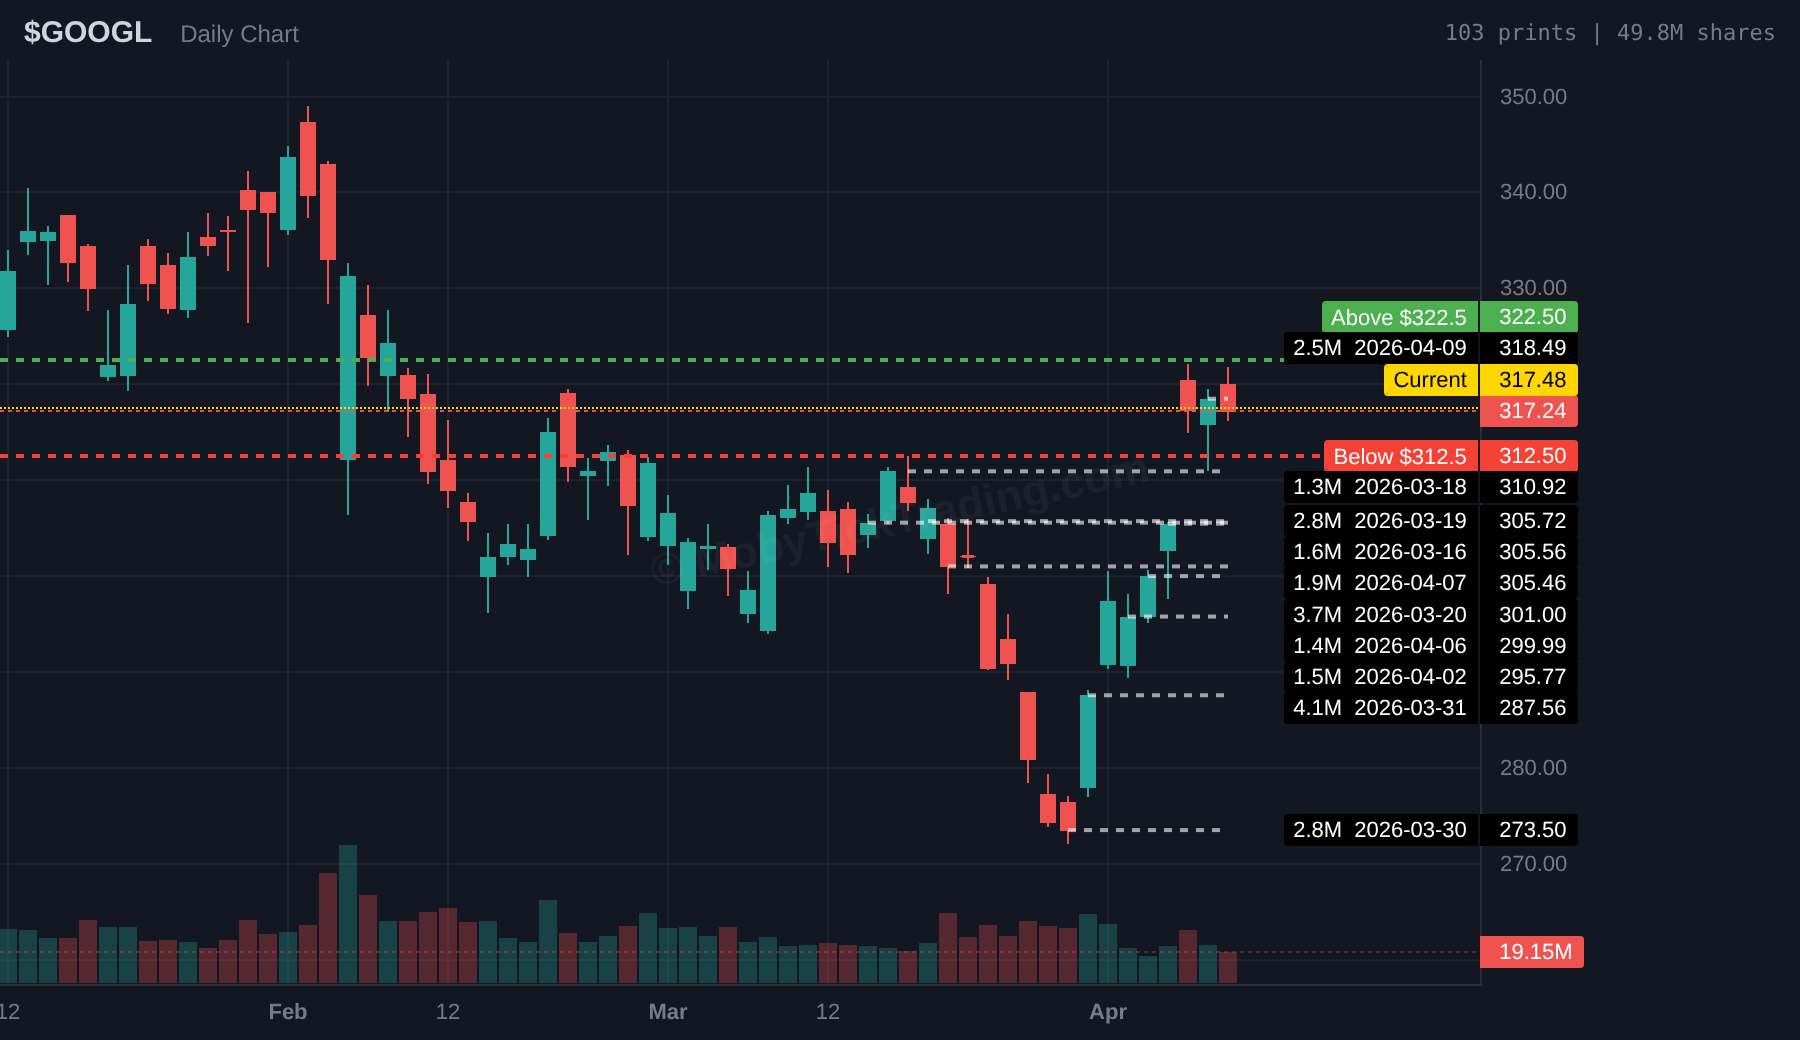
- GOOGL showed consistent institutional dark pool activity at the $305-$320 range this week.
- The stock drifted from $318.49 to $317.48 — relatively flat vs. the broader rally.
- Dark pool prints at $295-$310 suggest institutions view the price action as consolidation rather than distribution.
$AVGO — Broadcom
Dark Pool Print: $3.18B+ dark pool flow | Apr 7-9 prints
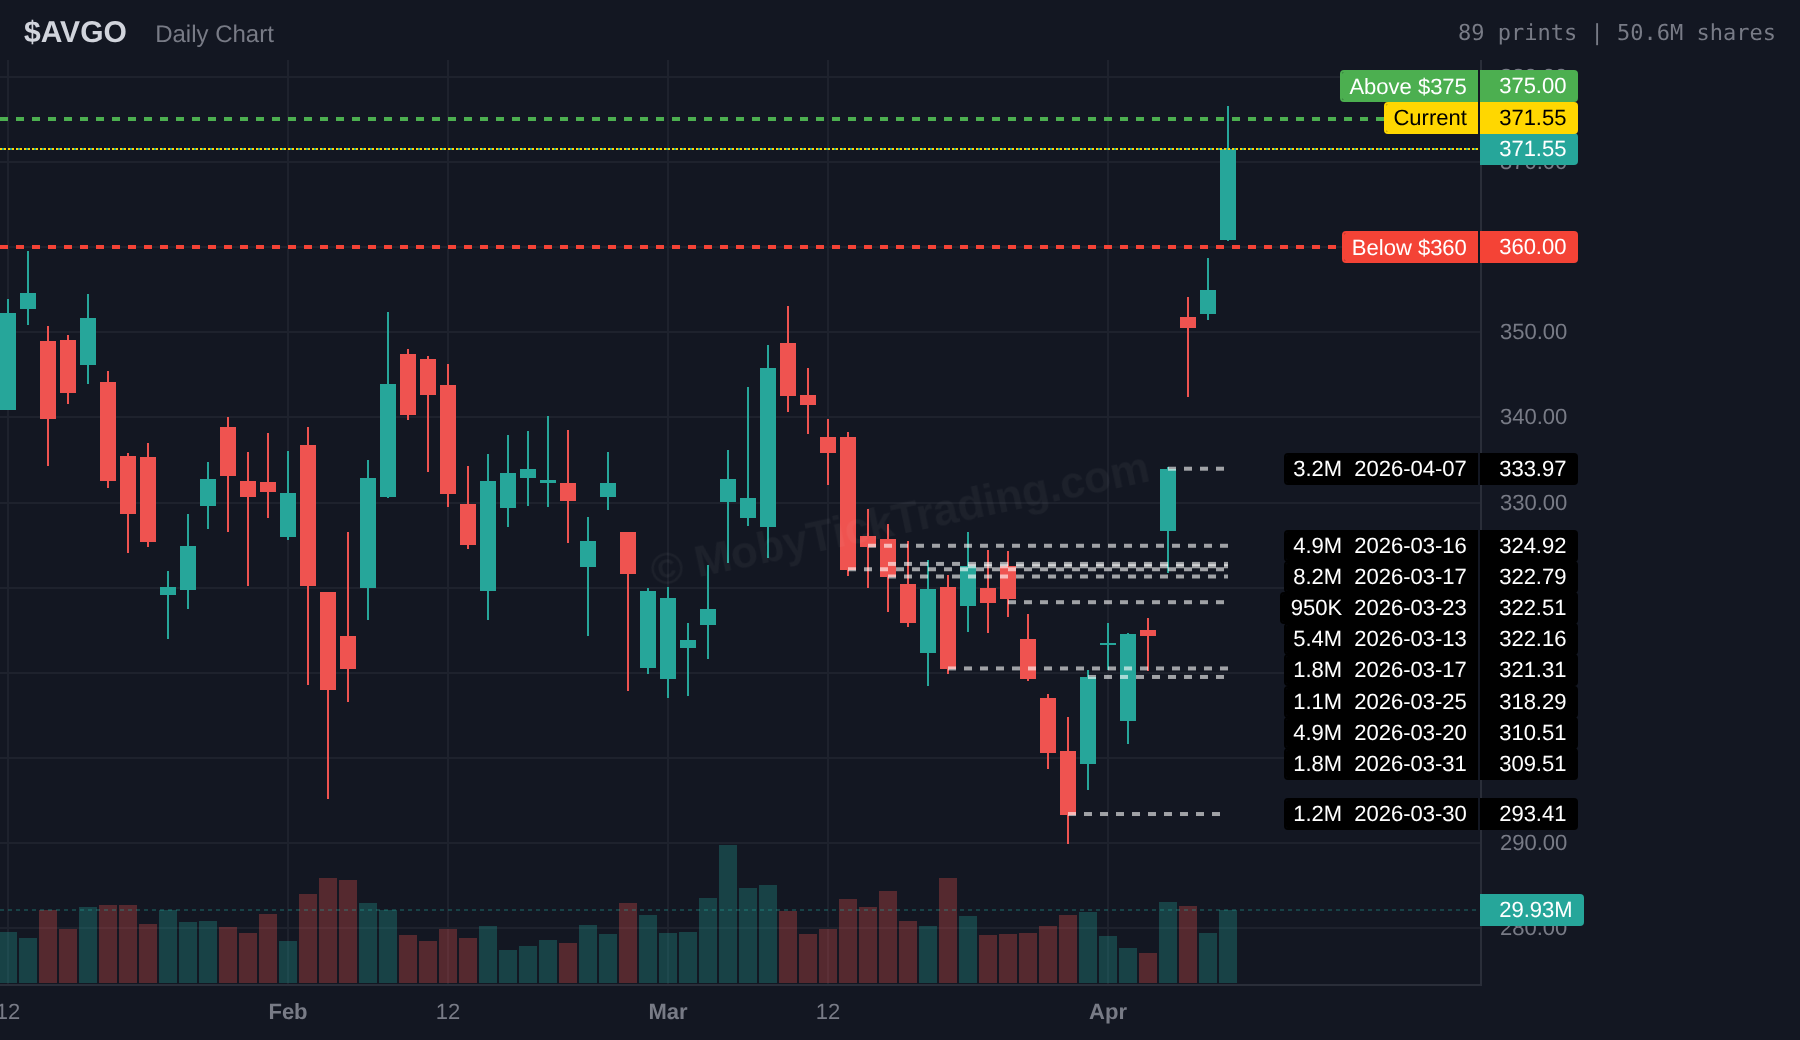
- AVGO surged from $354.91 to $371.55 — approximately +4.7% for the week.
- Dark pool prints of $3.18B+ crossed at $310-$334 this week. The April 7 print at $333.97 ($1.06B) was the largest.
- NVDA +2.58% and AVGO drove the Nasdaq on April 9. AI infrastructure demand remains the dominant theme.
$AMD — Advanced Micro Devices
Dark Pool Print: $2.21B dark pool flow | 9.4M shares
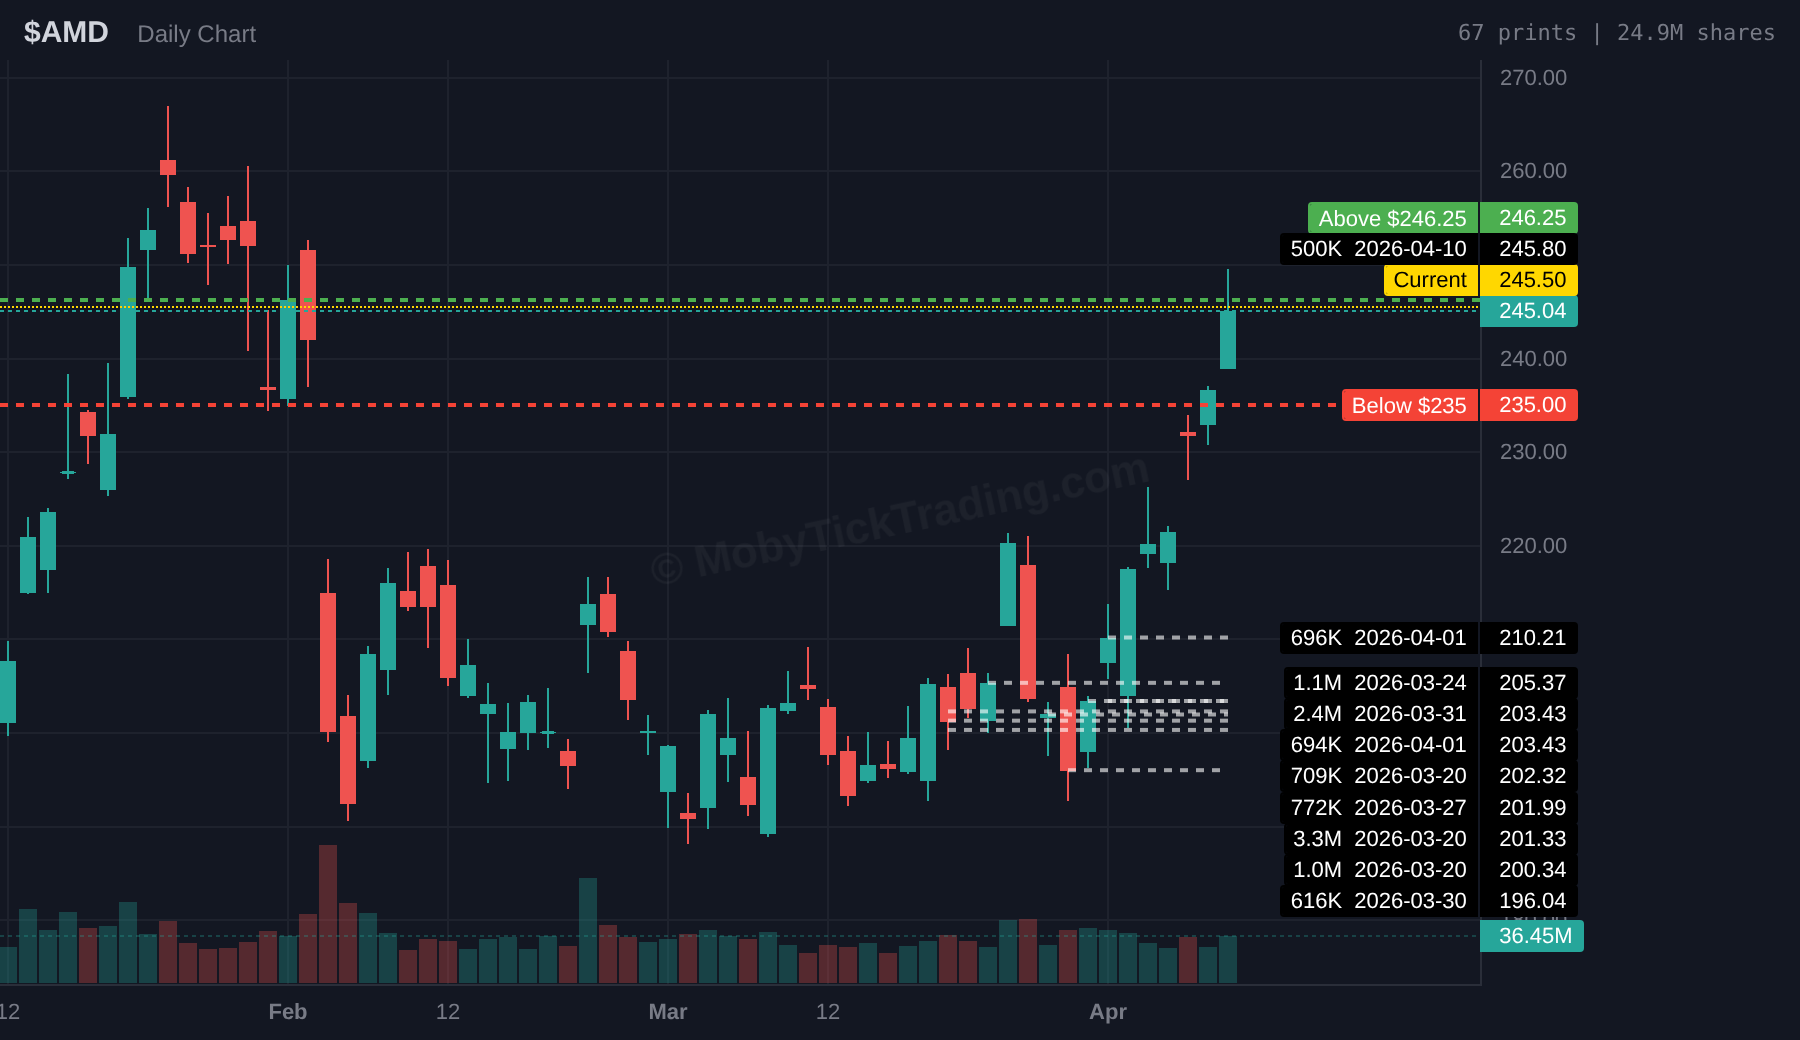
- AMD crossed $2.21B in dark pool prints this week. The stock gained from $236.64 to $245.50.
- A 500,000-share print at $245.80 on April 10 ($122.9M) was the week’s top print — verified $0.70 above the close.
- Dark pool prints at $220-$234 suggest institutions accumulating during the early-week dip.
$XOM — Exxon Mobil
Dark Pool Print: $1.02B dark pool flow | 50 prints
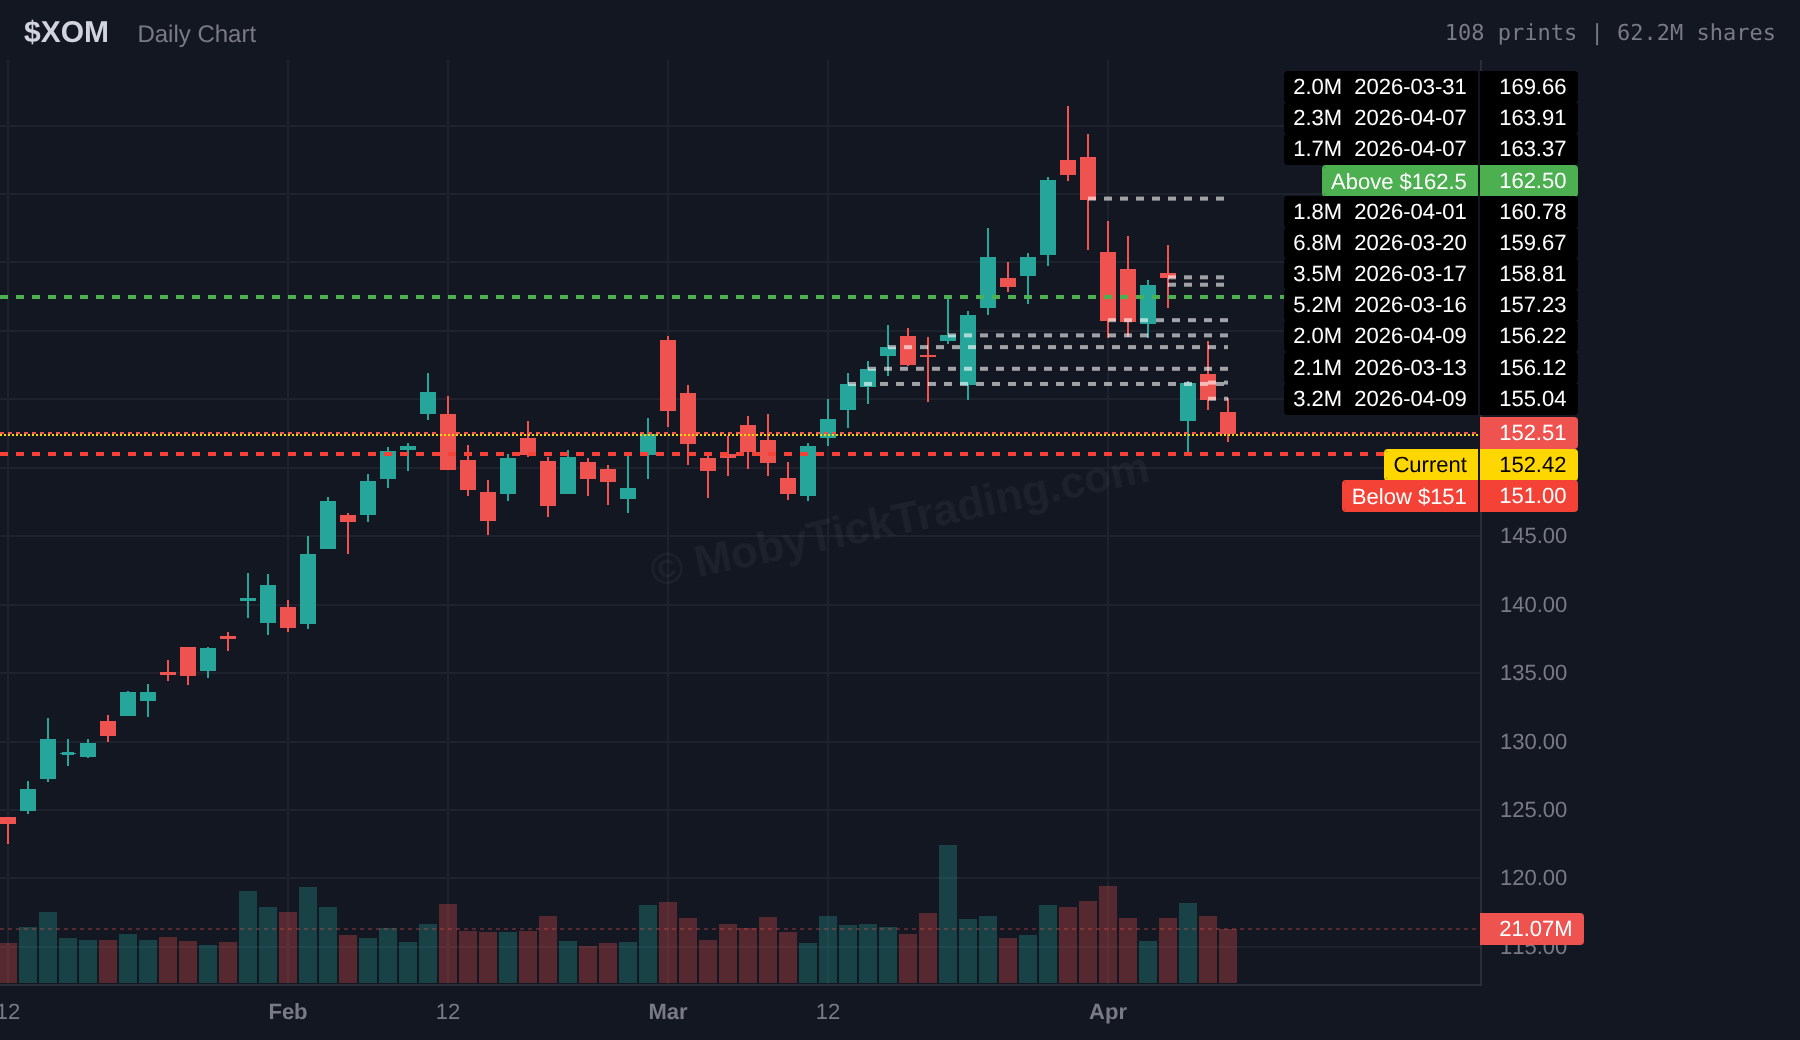
- XOM is a direct beneficiary of the Iran ceasefire. Energy had the most prints (50) of any sector this week.
- Brent crude settled at $95.92/barrel Thursday, down from $109 before the ceasefire.
- XOM dark pool prints at $155-$164 show institutions positioning in energy despite the oil price pullback.
$AAPL — Apple
Dark Pool Print: $1.90B dark pool flow | 7.5M shares
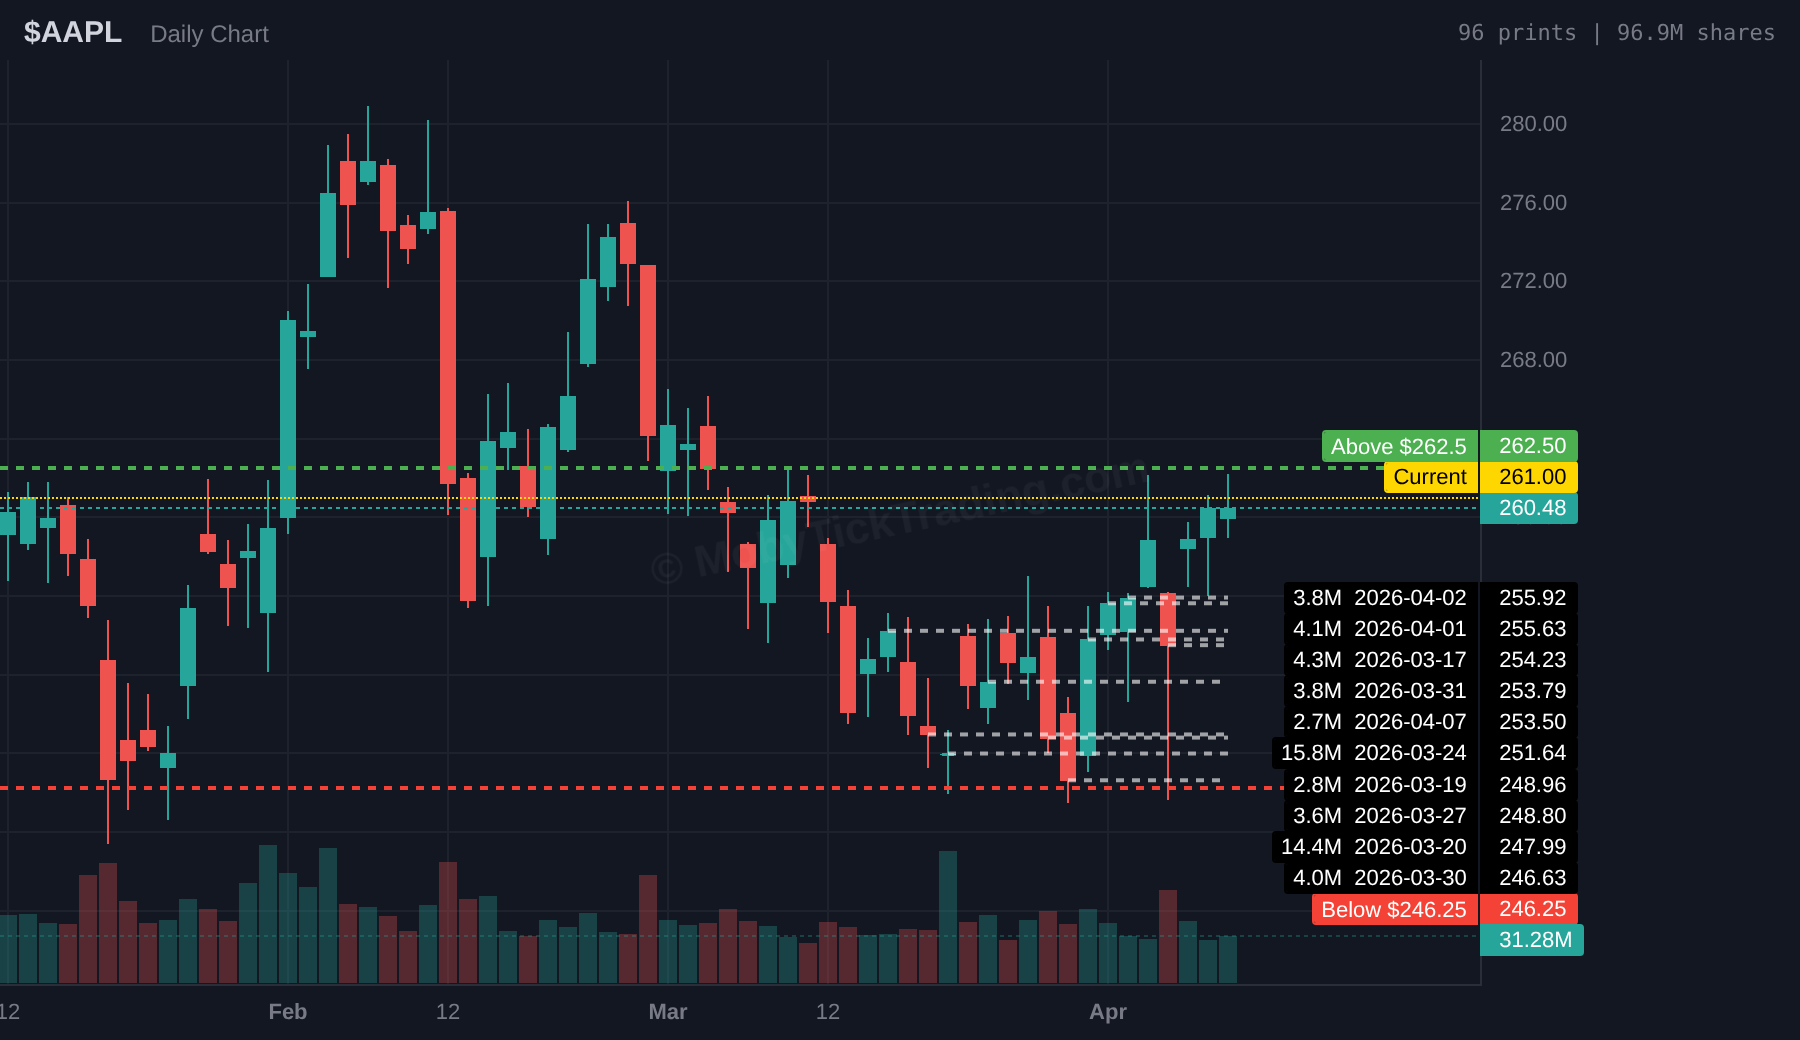
- AAPL showed mixed dark pool activity this week — $1.90B in prints at $256-$260 range.
- A 588,411-share print at $258.86 ($152M) on April 6 was verified $1.33 below the close.
- Apple AI developments and iPhone demand remain key catalysts.
$AMZN — Amazon
Dark Pool Print: $2.38B dark pool flow | 10.98M shares
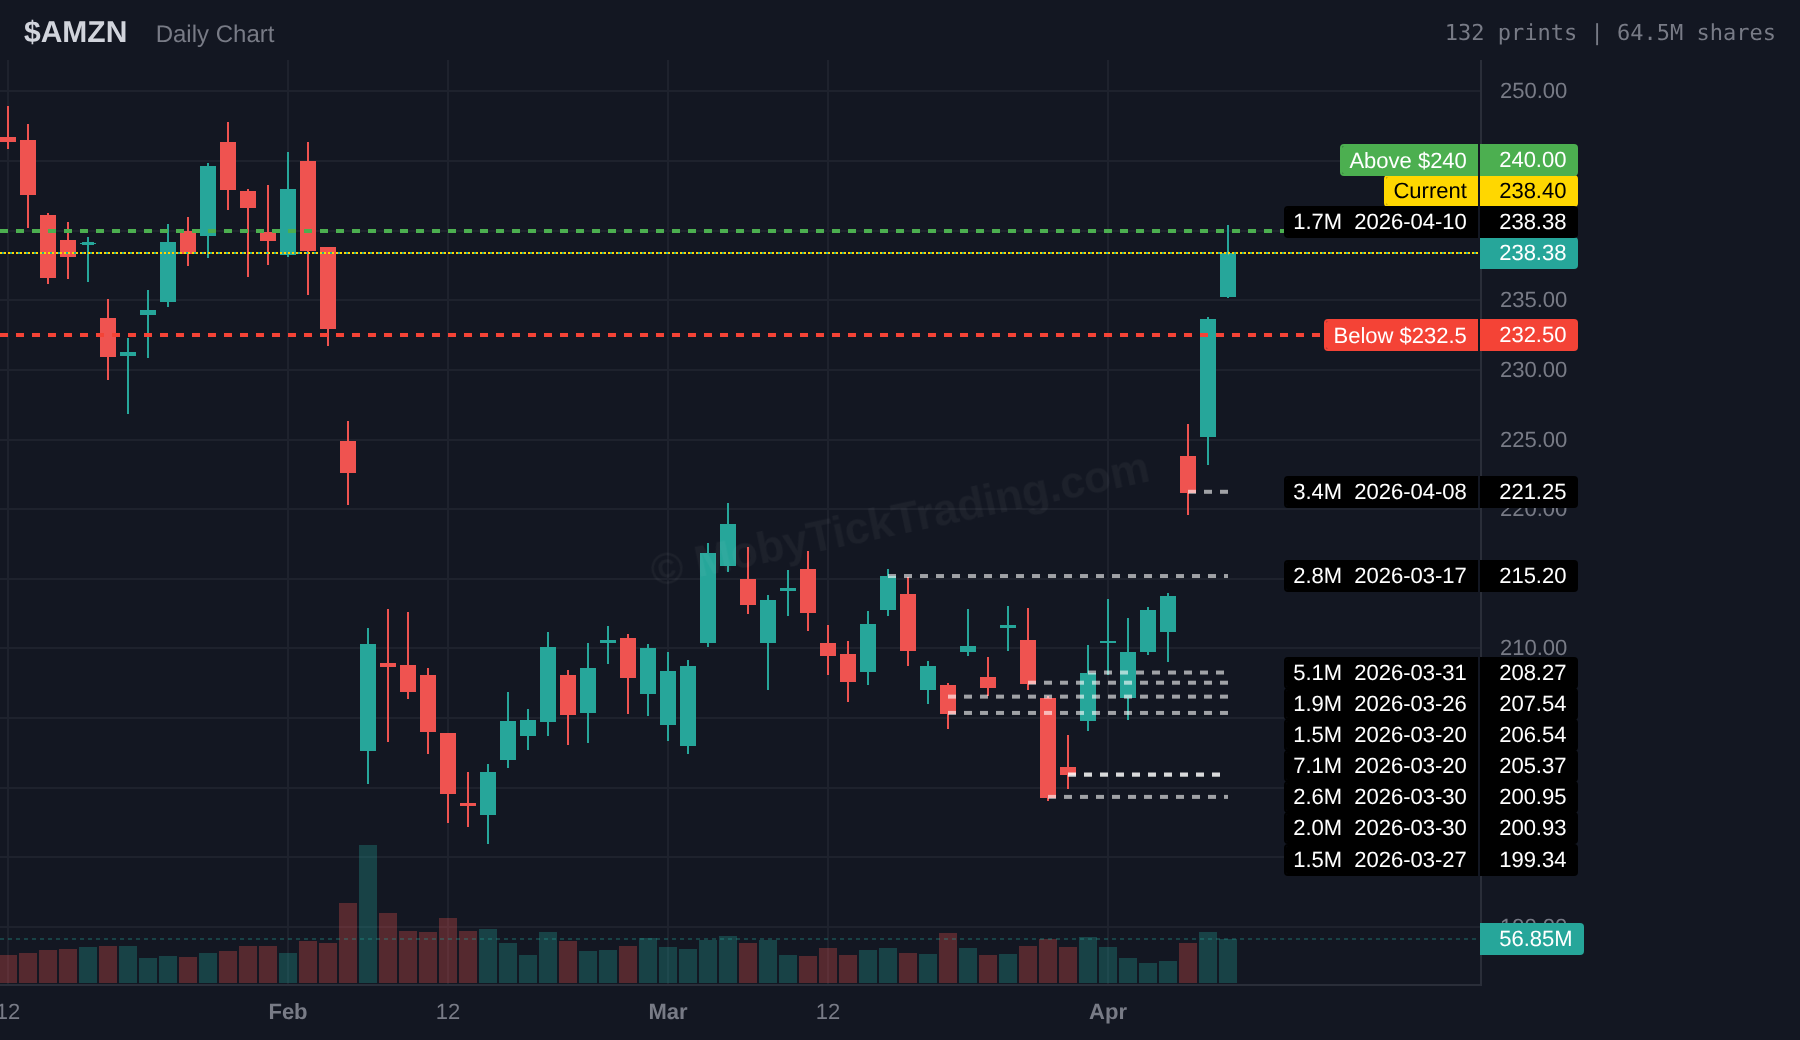
- AMZN gained 2.05% on Thursday alone. The stock closed at $238.40, up from $233.65.
- A $747.7M print at $221.25 on April 8 and a $395.5M print at $238.38 on April 10 frame the range.
- AWS growth and AI integration remain the dominant institutional thesis.
$IBIT — iShares Bitcoin Trust
Dark Pool Print: $340M dark pool flow | 8.4M shares
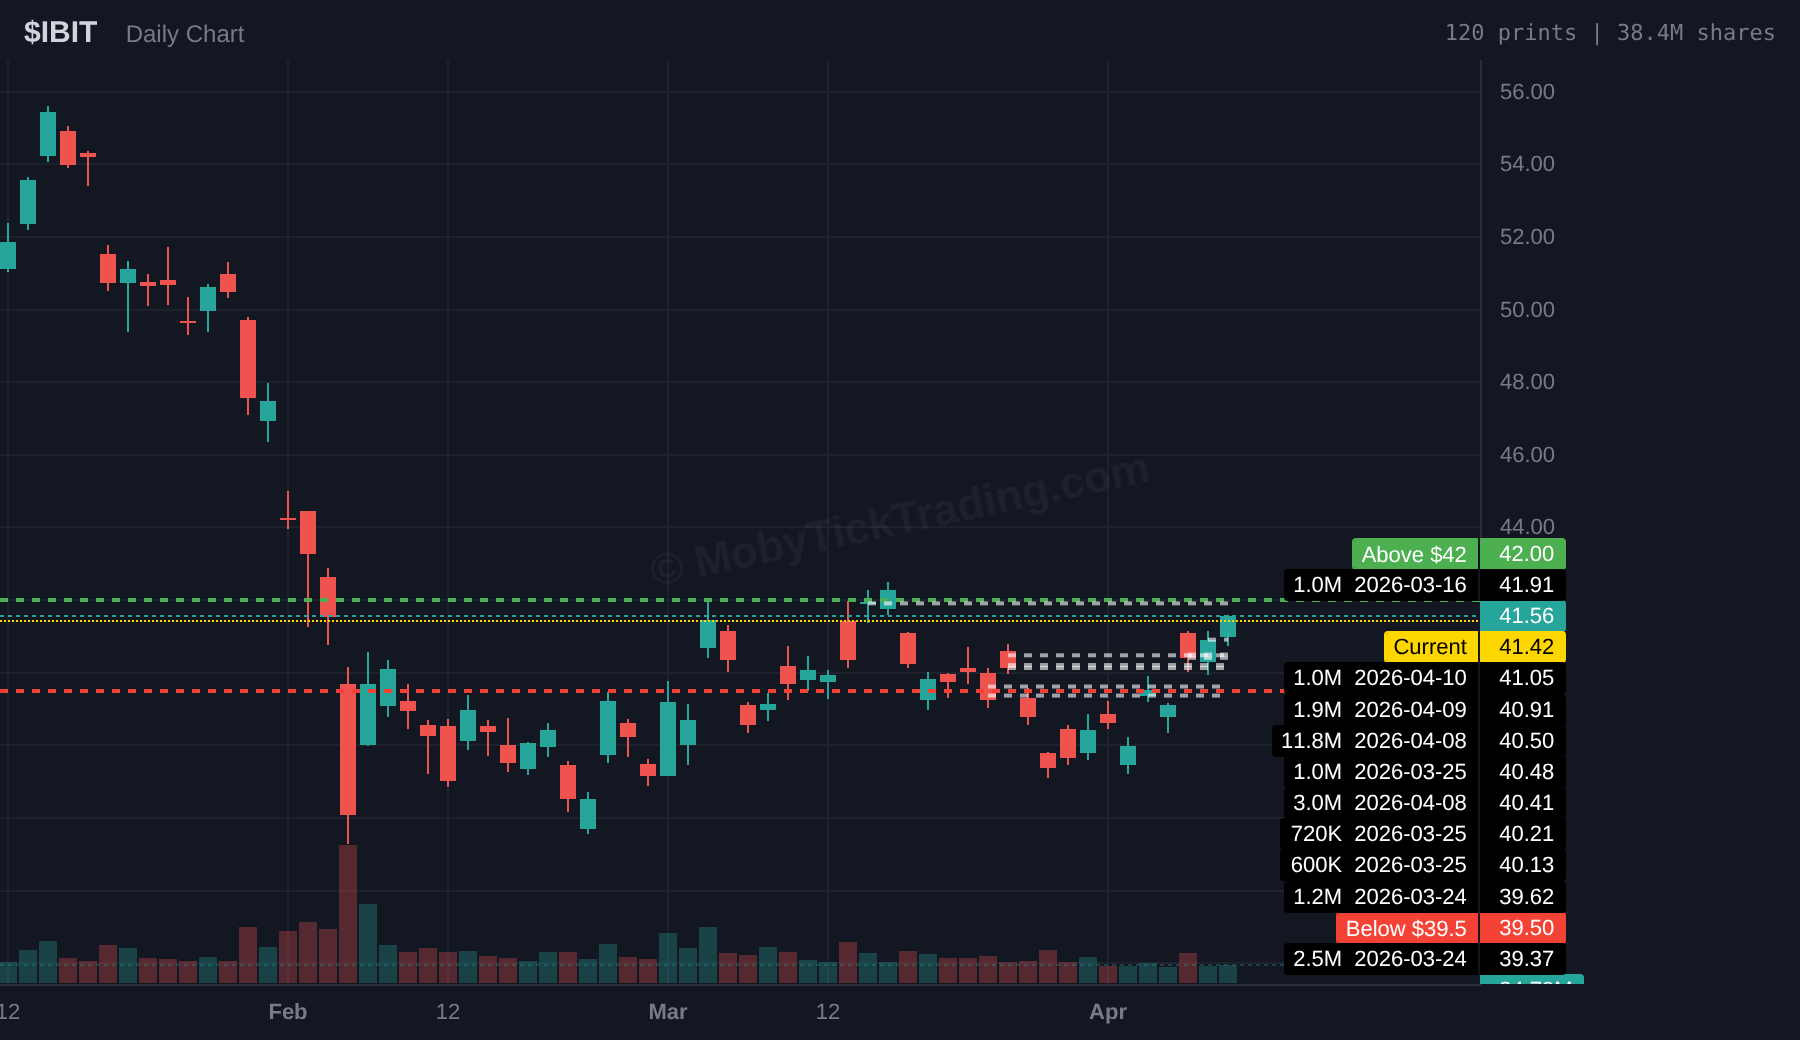
- IBIT had $340M in dark pool prints this week with April 8 the most active day ($479M at $40.41-$40.50).
- Bitcoin held firm around $40-41 as the Iran ceasefire reduced crypto’s risk-off premium.
- Dark pool prints at $40-$41 suggest institutional accumulation in the $40 zone.
$ET — Energy Transfer
Dark Pool Print: $473M dark pool flow | 24.8M shares
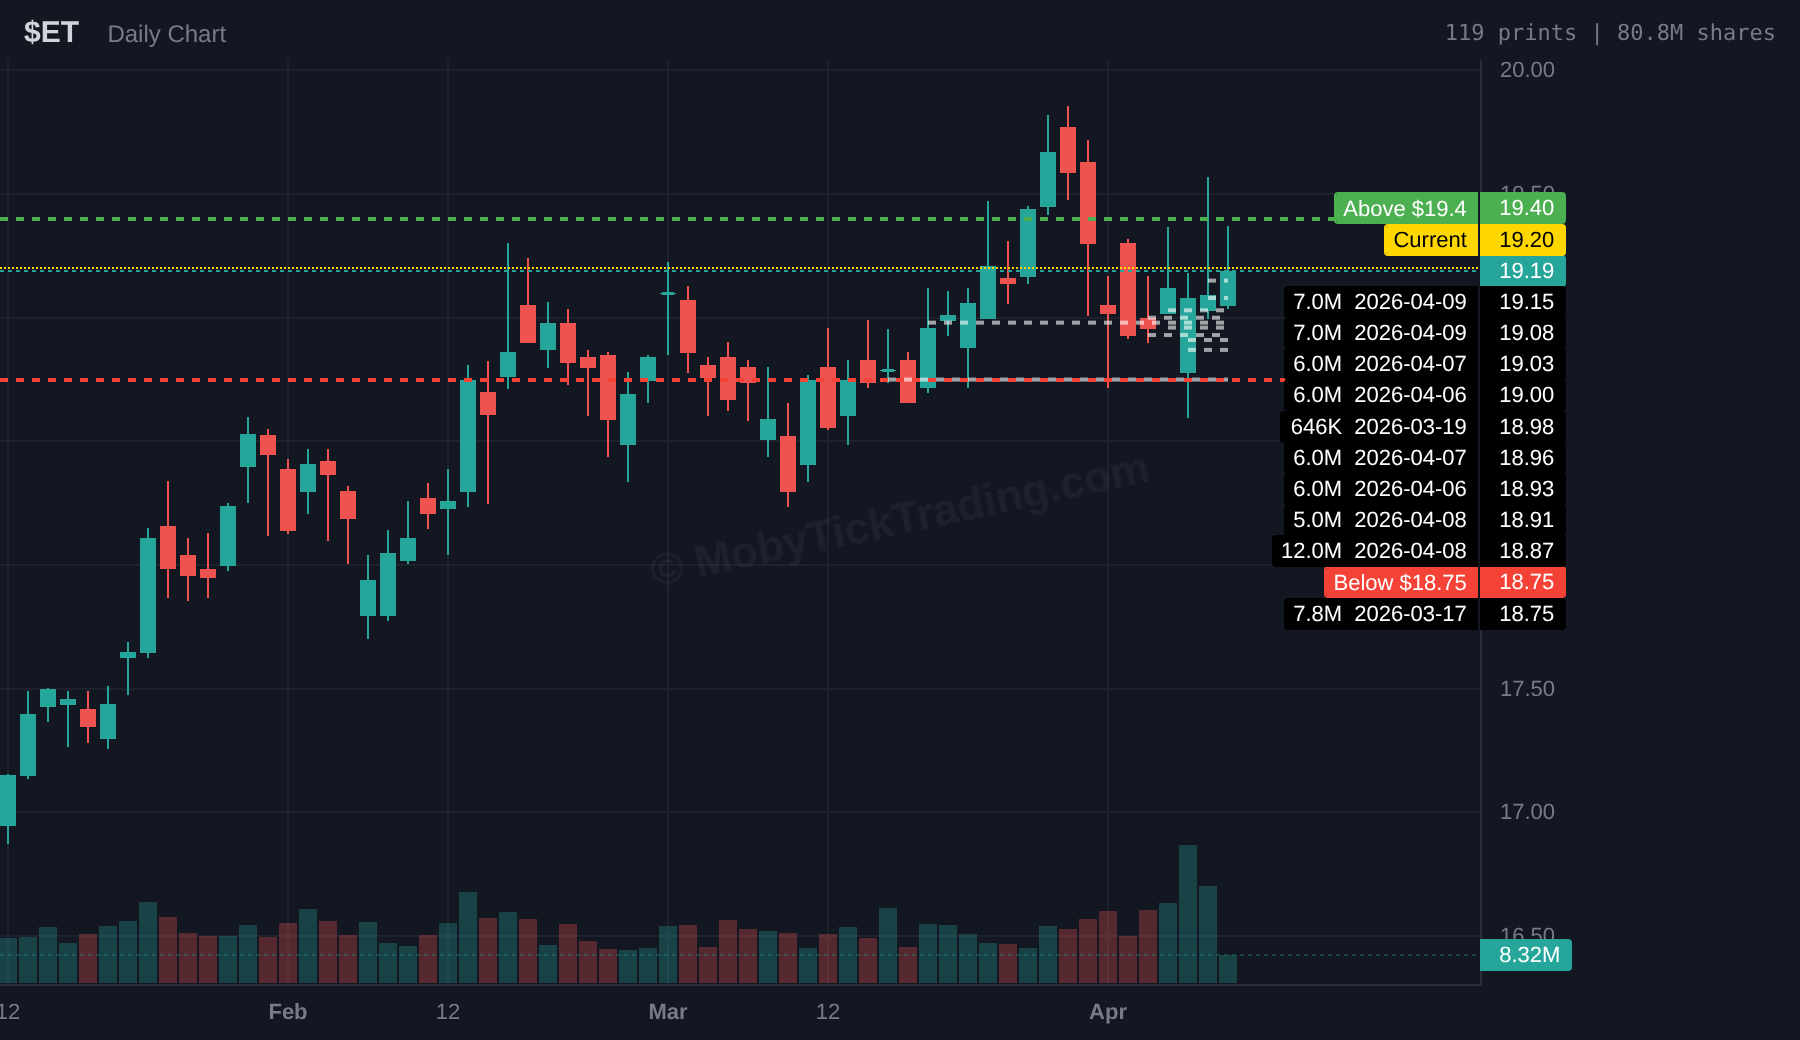
- ET had its most active dark pool day on April 8 — a 12M share print at $18.87 ($226M).
- Energy sector dark pool flow was dominated by XLE ($572M, 50 prints) and XOM ($1.02B).
- The stock traded from $19.09 to $19.20 — relatively stable despite oil price swings.
$SNDK — SanDisk (Western Digital)
Dark Pool Print: $522.7B dark pool flow | 719M shares
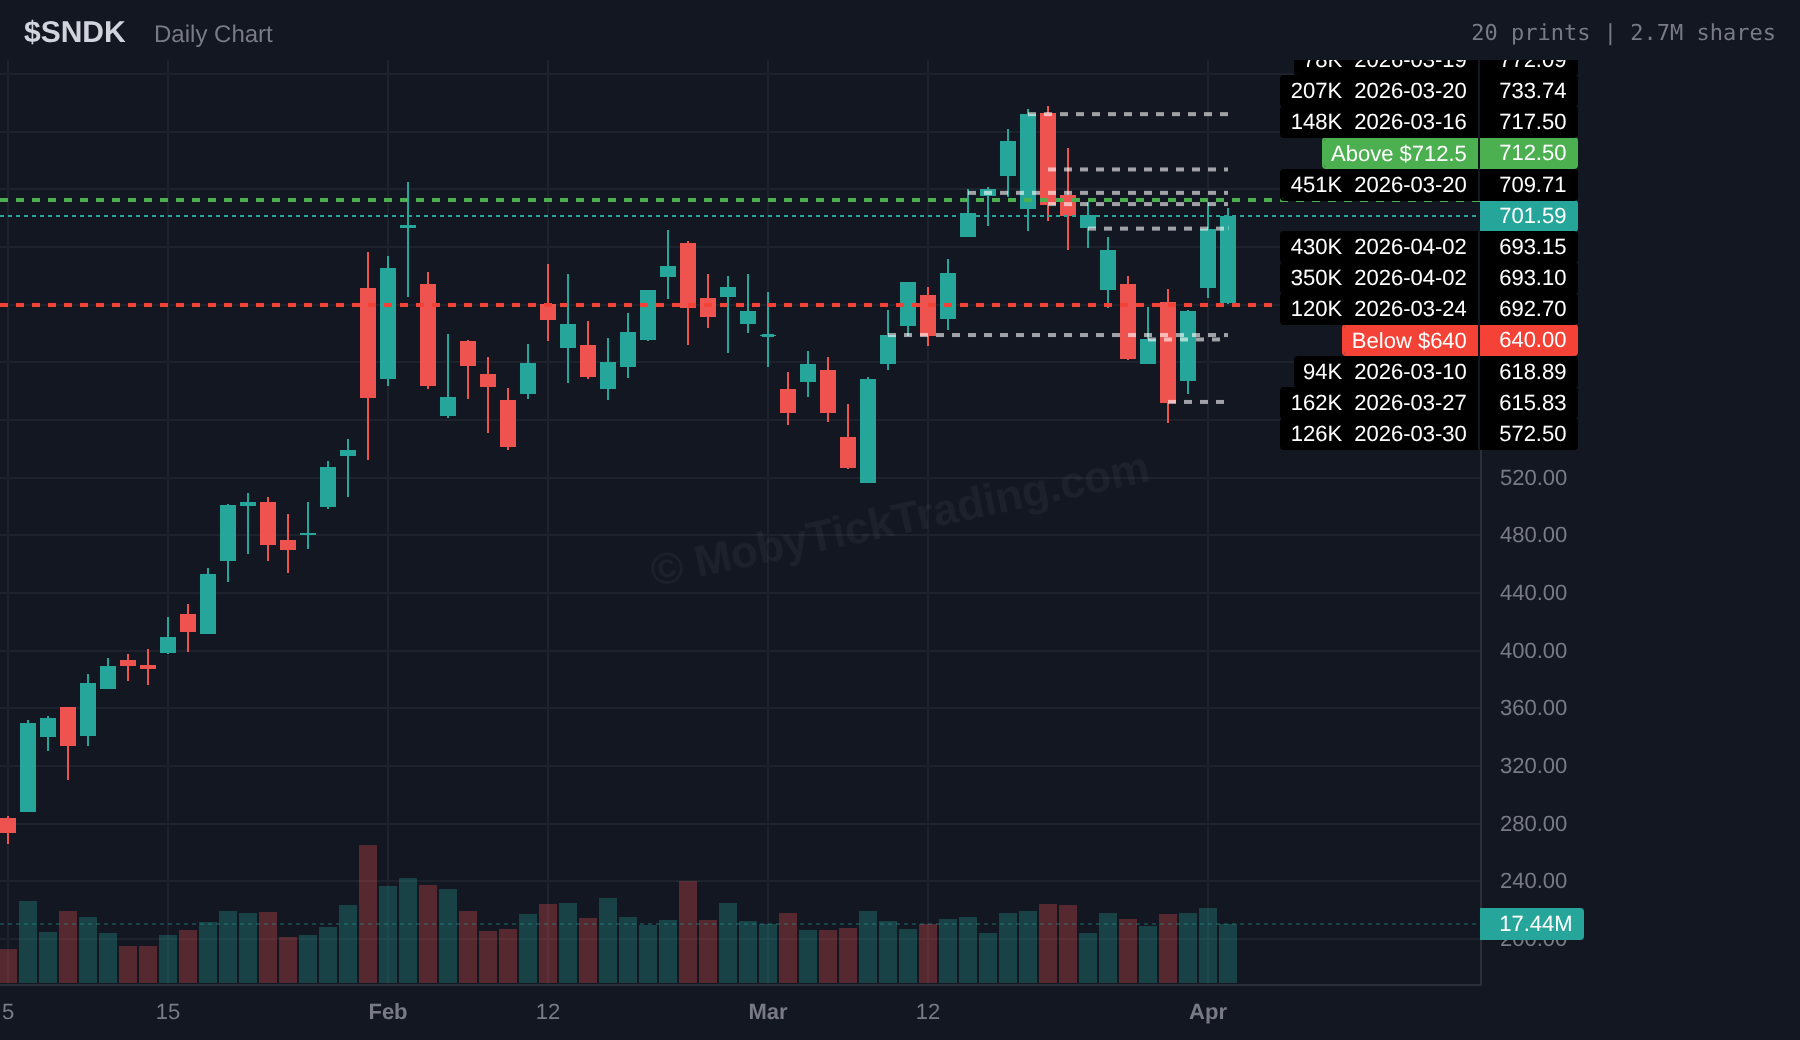
- SNDK had a $363.4M mega-print at $726.70 on April 6 and a $109M print at $851.77 on April 10.
- The stock has been on a strong momentum run from the $700s to $856.20.
- Flash storage demand from AI data center buildouts is a key thesis. The dark pool prints confirm significant institutional interest.
📚 Educational: What the Iran Ceasefire Tells Us About Dark Pool Timing
The Iran-U.S. ceasefire agreement announced mid-week produced one of the clearest dark pool timing signals in recent memory — and it offers a masterclass in how institutional investors use off-exchange prints to position before headline moves.
When the Strait of Hormuz faced disruption in late February, dark pool prints in energy names spiked immediately — days before Brent crude hit $109/barrel. XLE (Energy Select Sector SPDR) received $974 million in dark pool prints during the Mar 31-Apr 3 week, the most of any sector. By the time retail traders read the headlines, institutions had already moved.
Then came the ceasefire. Within 24 hours of the April 7 announcement, oil prices began retreating from their peaks. But the dark pool data for April 7-9 shows a telling reversal: Energy sector prints dropped sharply while technology and small-cap ETFs (QQQ, IWM) saw increased activity. This is institutional rotation in real time — documented in off-exchange prints before price charts confirm the move.
How can you use this? Track sector dark pool flow across weeks, not just individual tickers. When a sector that was previously quiet suddenly receives 3-5x its normal dark pool flow, it often signals an institutional thesis change days before the news breaks.
Moby Tick tracks dark pool prints across all 11 S&P 500 sectors plus all major broad market ETFs.