
Market data from the week of July 27–31, 2026. Trade setups for July 27-31 2026.
Market Overview
Week in Review: Jul 20–24
Crude ran the tape. Houthi militants claimed attacks on two Saudi tankers in the Red Sea mid-week, and Brent crossed $100/bbl for the first time since May. WTI futures jumped more than 5% Thursday to above $91. USO closed the week +10.27% — the largest move on our board by a wide margin.
Then Thursday happened. Alphabet beat expectations and fell ~7% anyway. Tesla missed on profit as AI spending climbed and dropped ~14%. The S&P 500 gave up 1.21% to 7,408.30 in that single session, and the VIX printed an intraday 20.31 after closing Wednesday at a weekly low of 16.64. It settled the week at 18.58 — net flat, all the drama compressed into one day.
Rates did not cooperate. The 10Y climbed every session, 4.598% Monday to 4.679% Friday (+13.8 bp), its highest level of the year. The fuel: initial jobless claims fell to 187,000, a 57-year low, from 209,000 prior. The four-week average dropped to 207,500, so that print wasn’t noise.
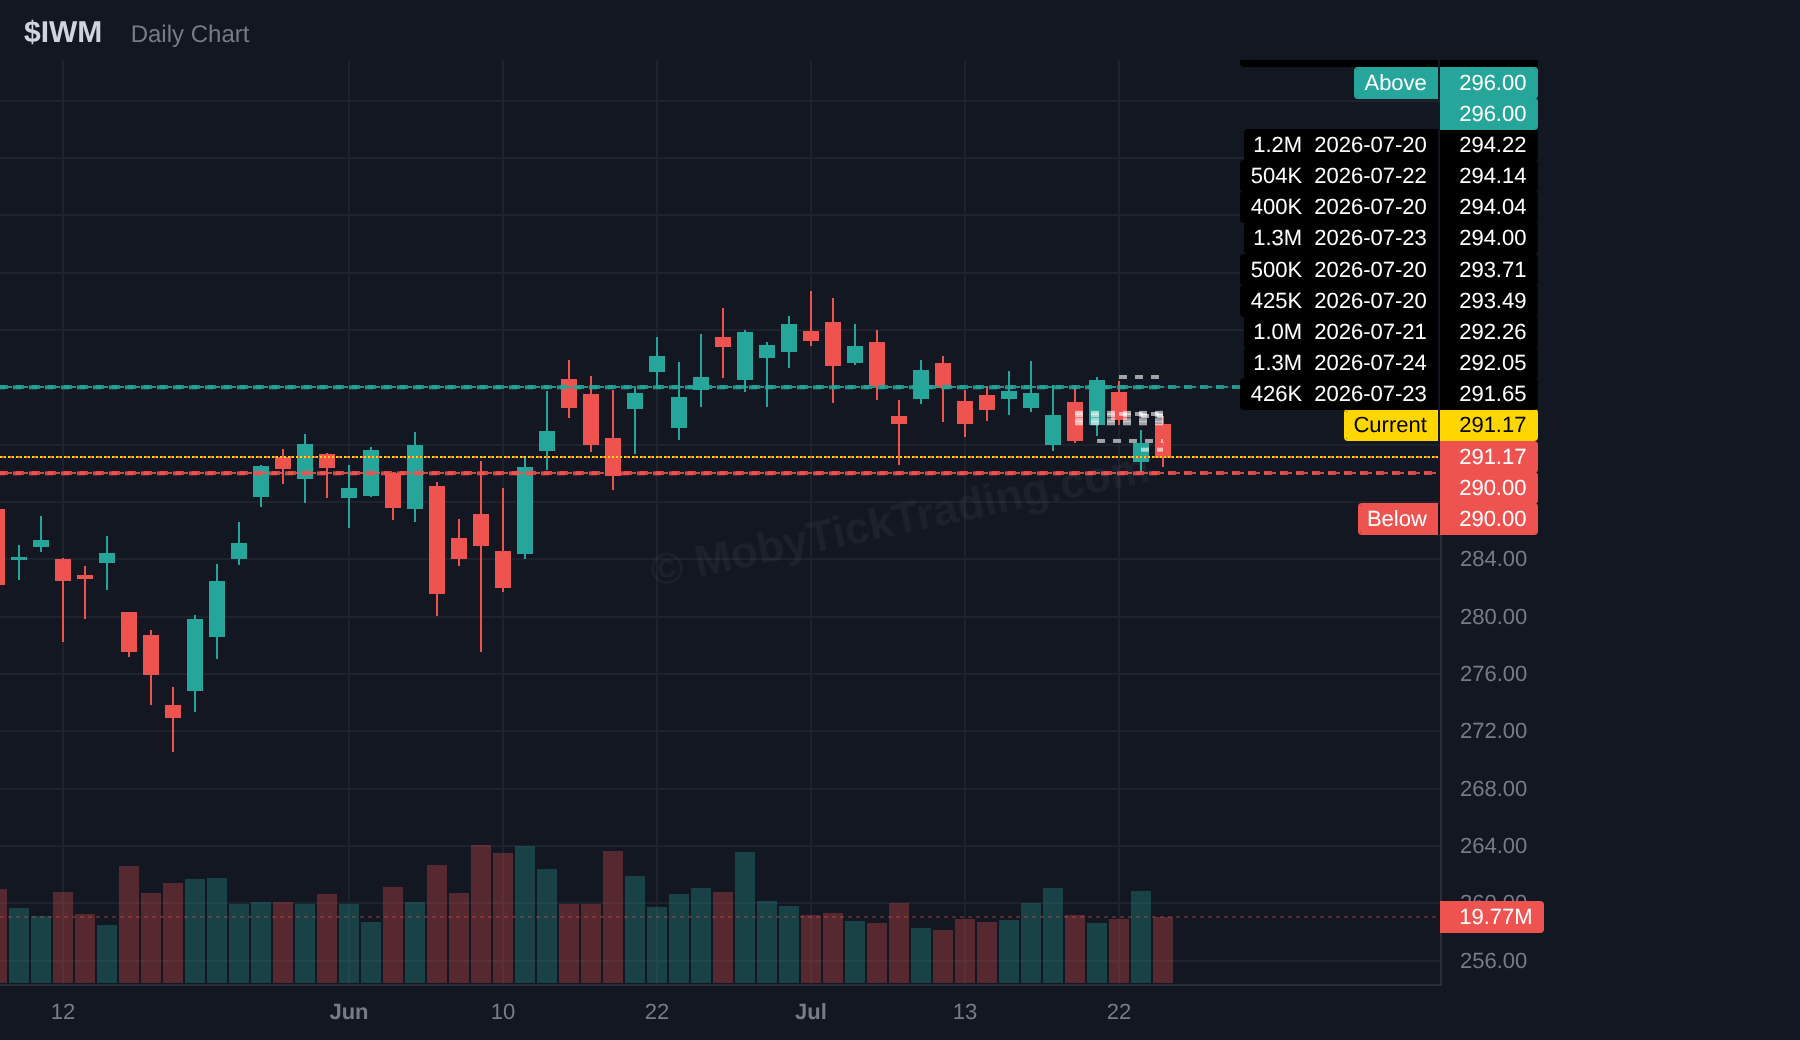
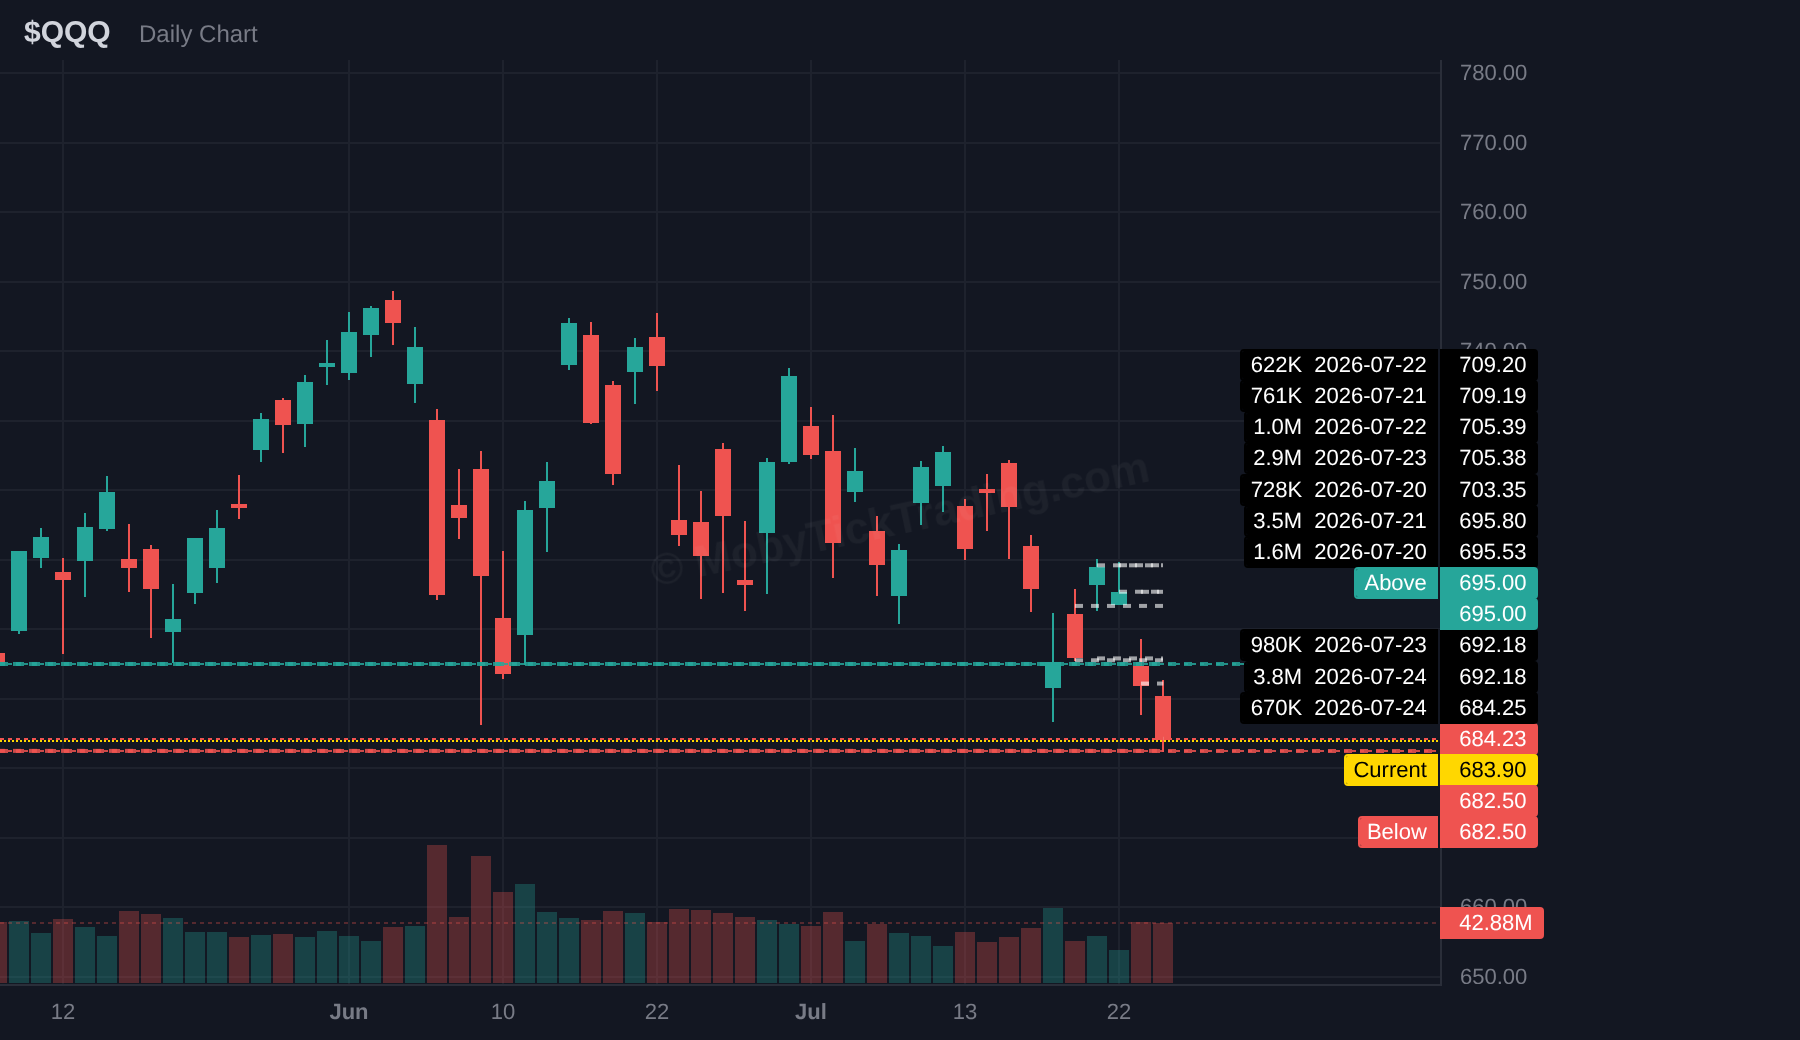
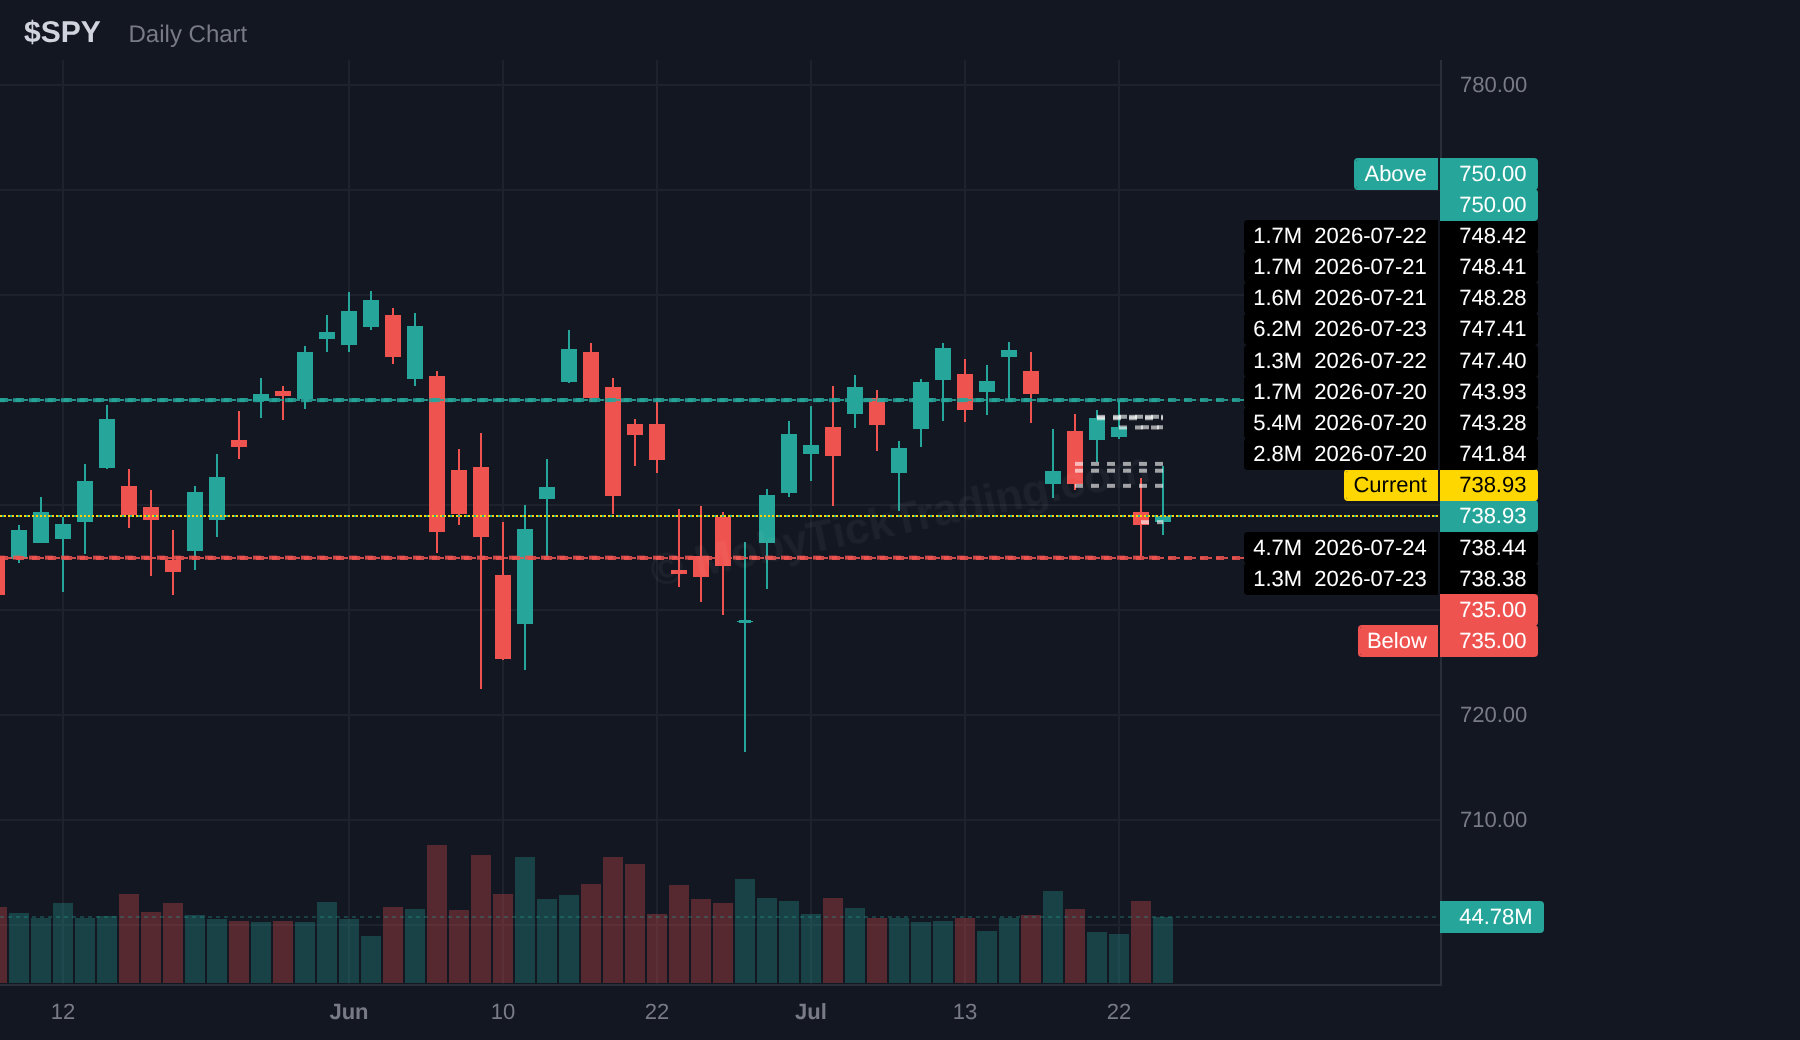
Index closes: SPY 738.93 (−0.59%), QQQ 684.23 (−1.60%), IWM 291.17 (−0.98%).
The damage was narrower than headlines implied. 8 of 11 sectors closed higher. Energy led at +3.36%, followed by Utilities +2.48% and Industrials +1.81%. The three decliners were Consumer Discretionary (−5.22%), Communication Services (−3.93%) and Consumer Staples (−1.24%) — and the first two took nearly all of it Thursday, the ETFs holding Tesla and Alphabet respectively. Broad Technology finished +0.17%. XLF ended +0.09%. Read that again: QQQ dropped 1.60% while the tech sector ETF was flat. This was a two-stock event, not a sector rotation.
Scorecard: 19 Targets Hit
Seven tickers reached at least one profit target for a total of 19 targets hit. Five Above levels triggered, four Below levels triggered, four never activated.
The standouts:
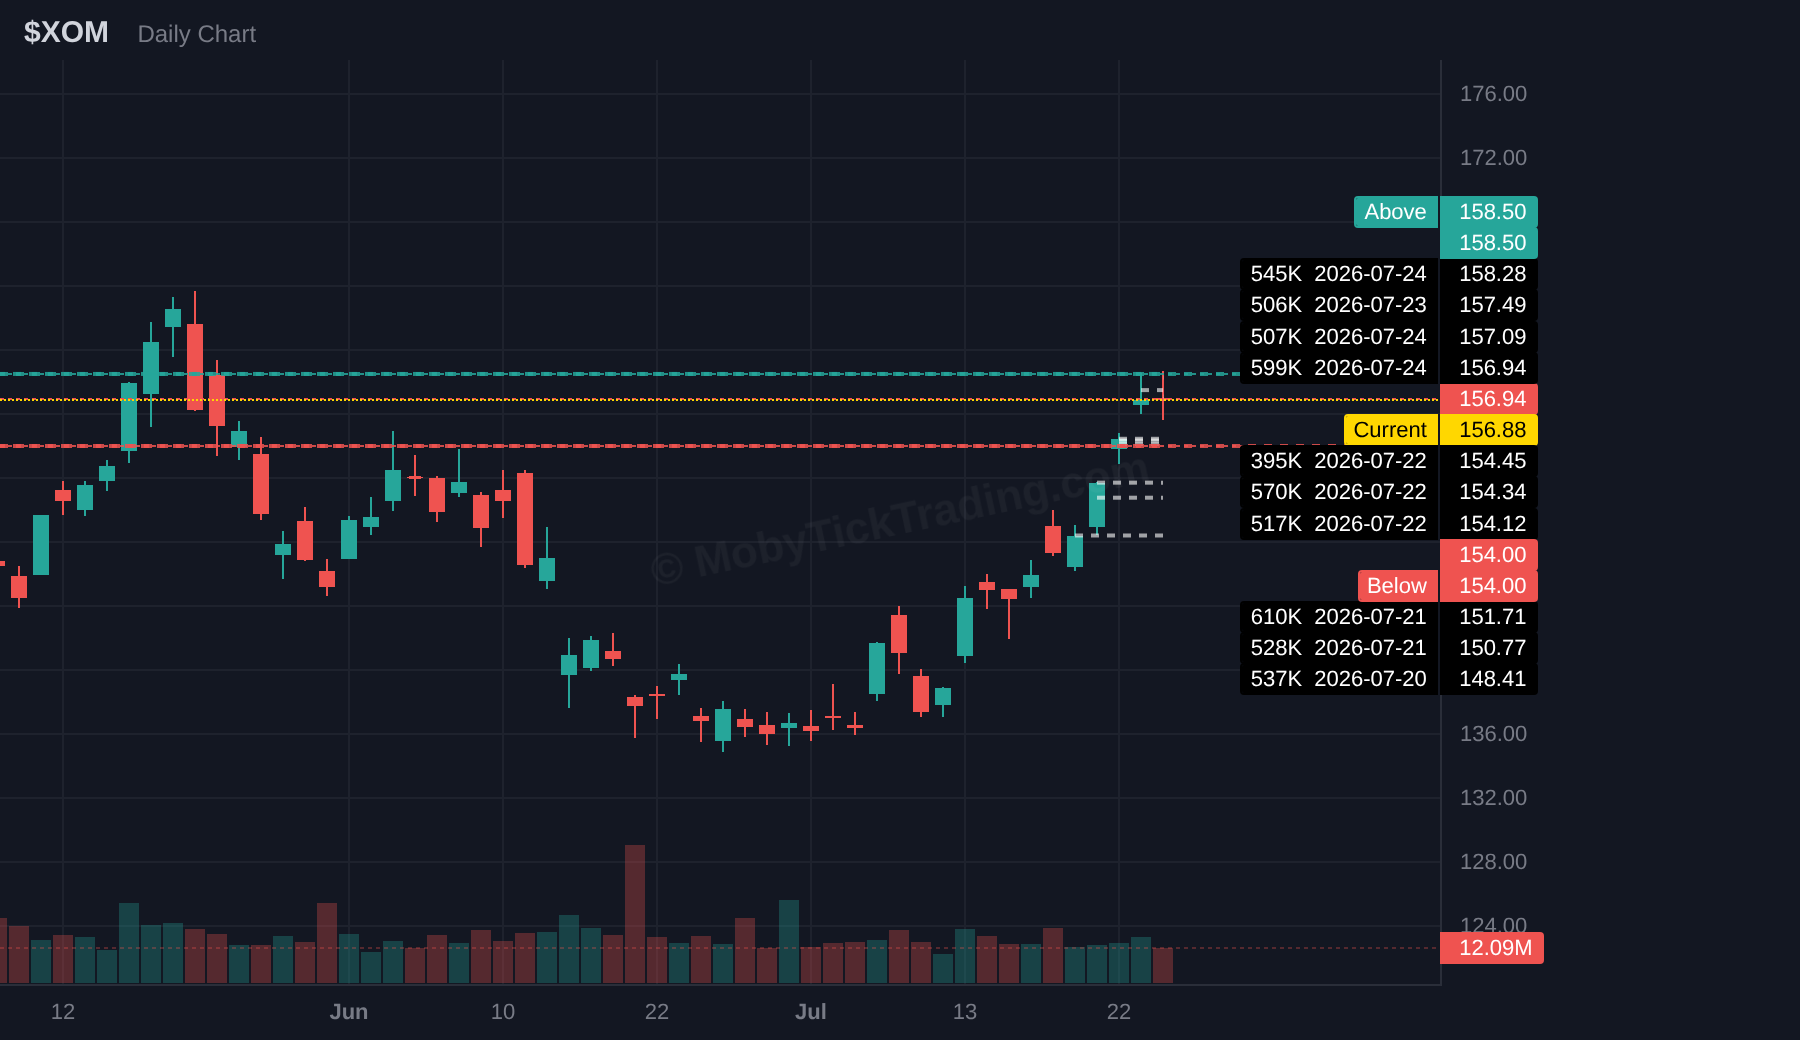
• XOM — Above $151.00 triggered, ran to $158.71 for +5.11%, tagging T3
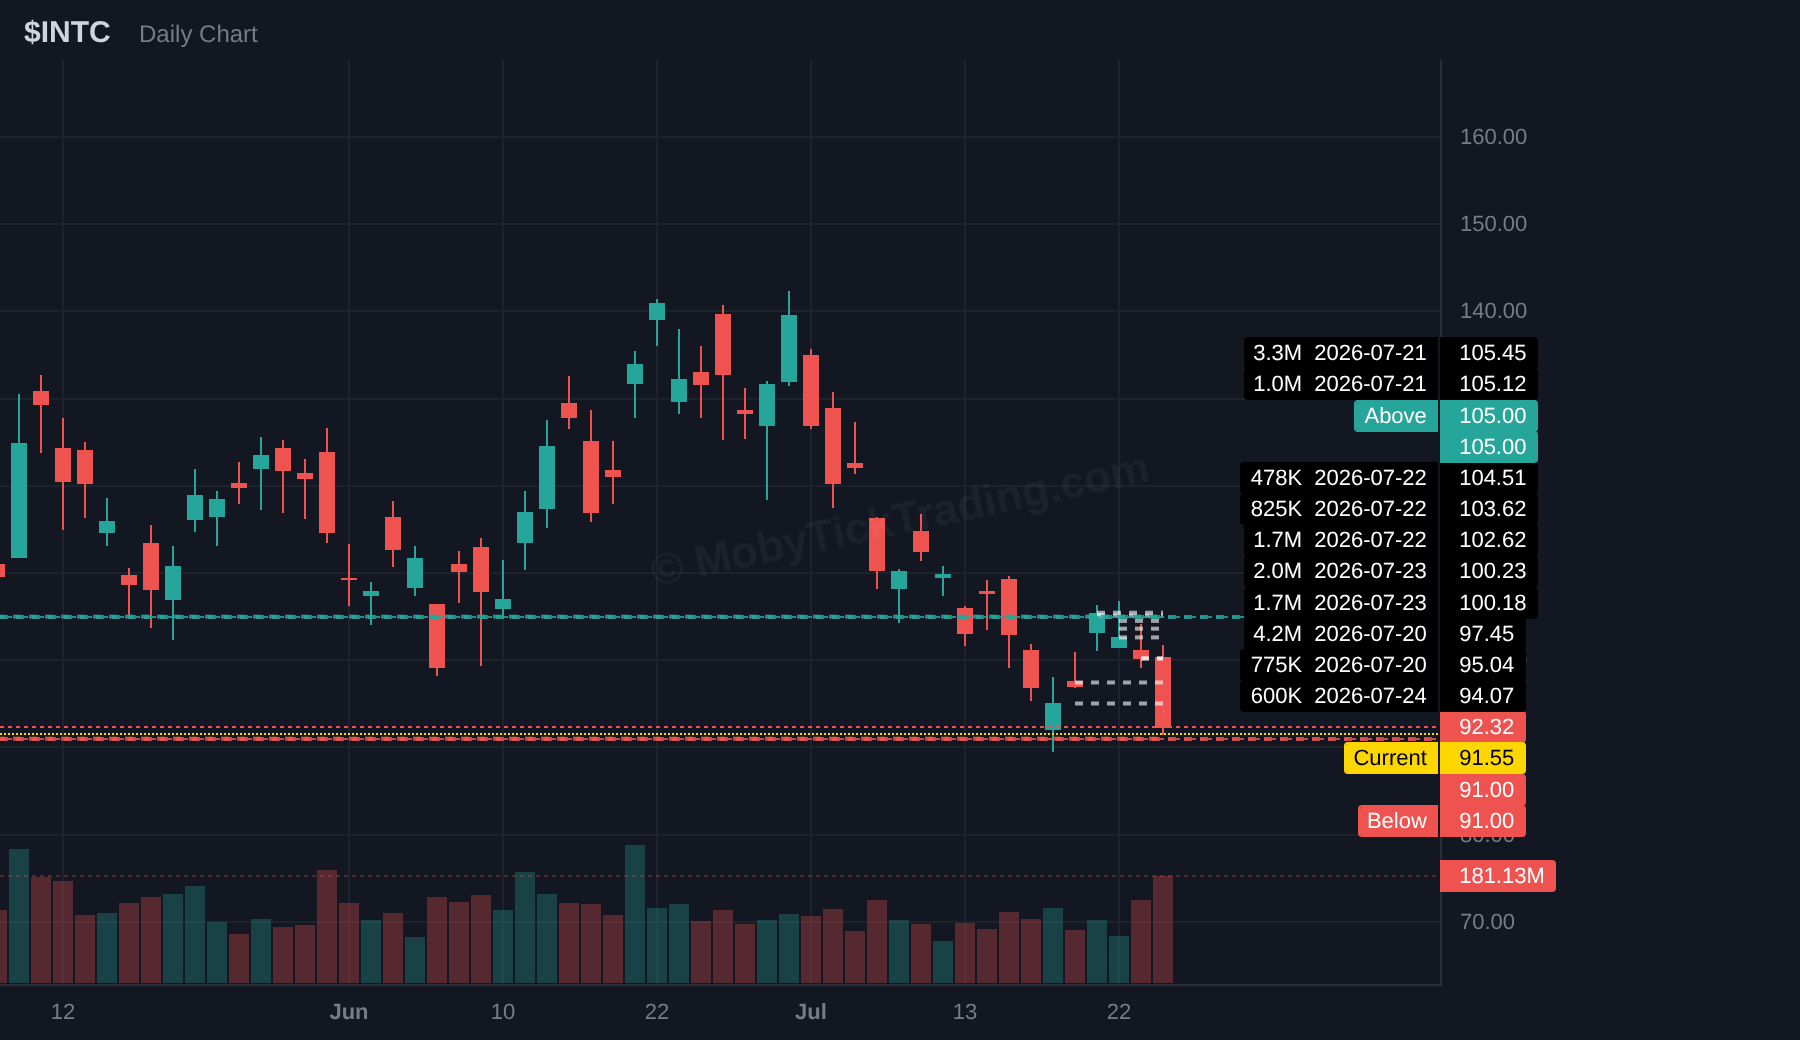
• INTC — Above $100.00 triggered, high of $106.85, +6.85% through T1
• FCX — Above $60.00 triggered, high of $65.43, +9.05% through T3
• GOOGL — Below $340.00 triggered, low of $314.90, −7.38%, full run to T5 (5 of 5)
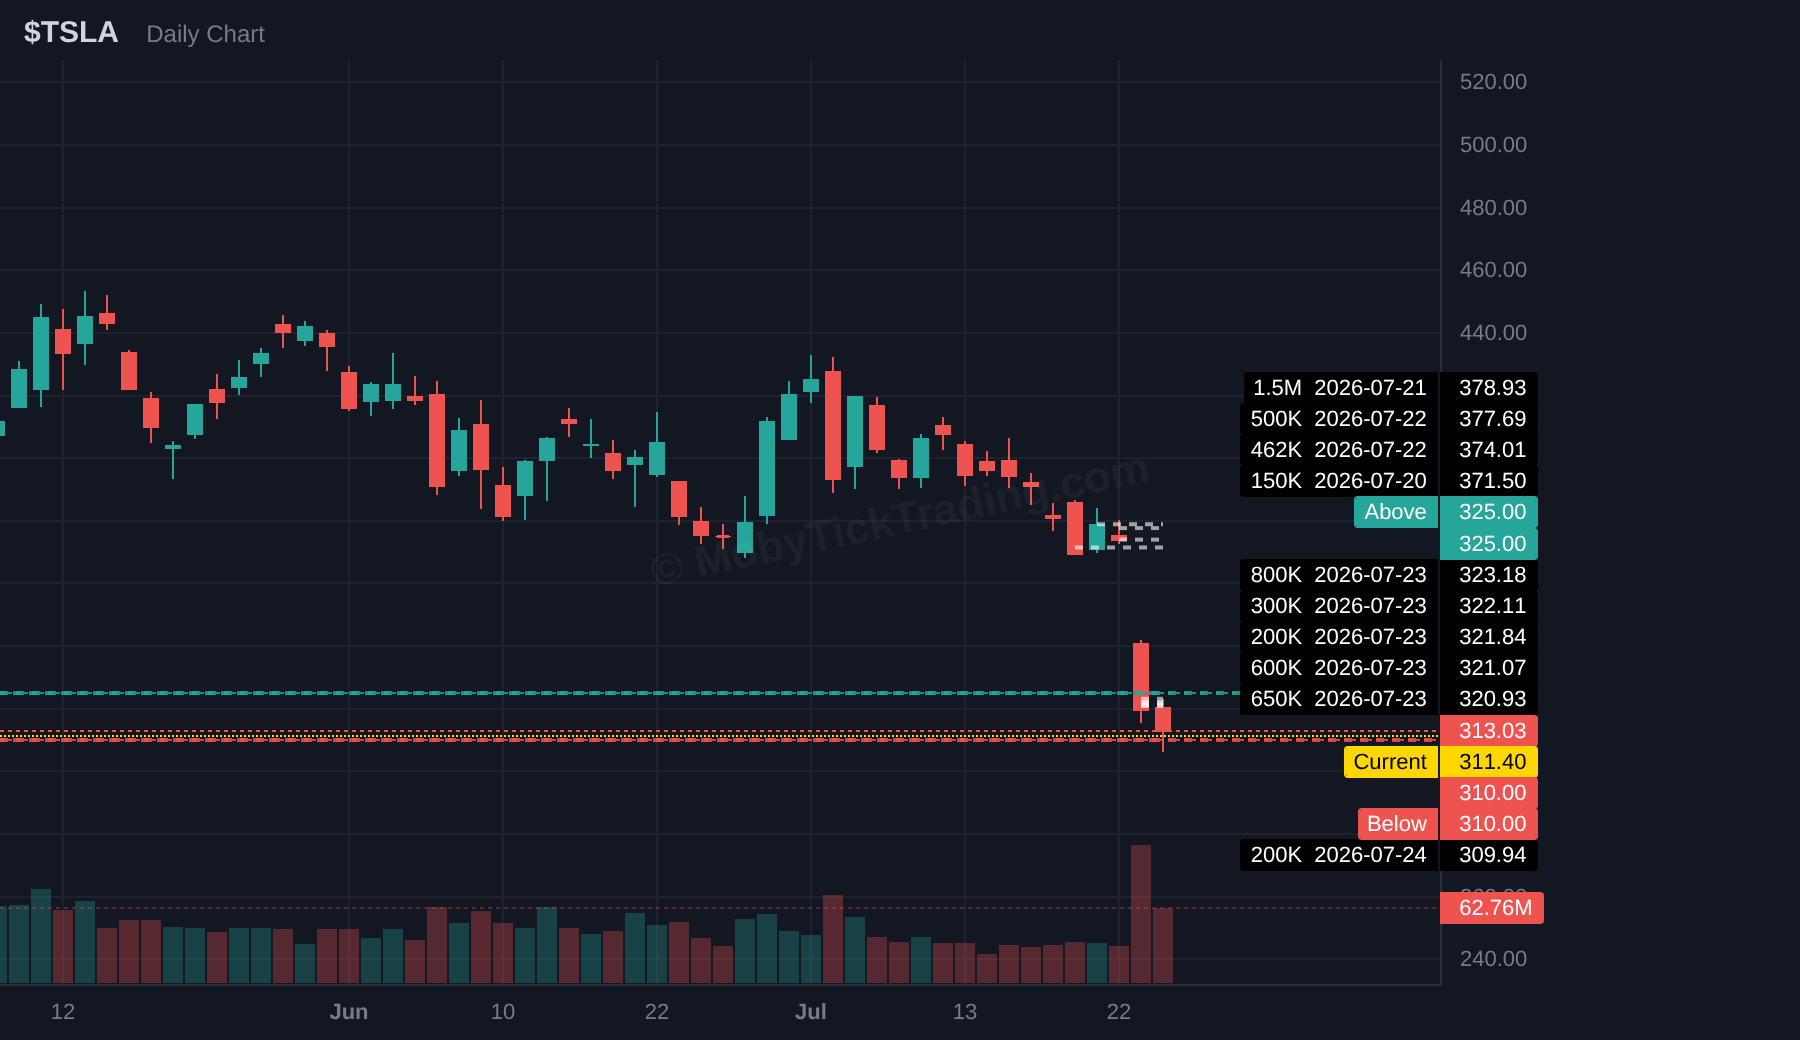
• TSLA — Below $374.00 triggered, low of $306.51, −18.05%, all four downside targets
• QQQ — Above $702.50 triggered, high of $710.05, T2
Both sides of the book paid.
Dark Pool Flow
$19.1B crossed the broad-market ETF complex — SPY, QQQ, IWM, VOO, IVV — across 695 total prints logged for the week. SPY alone accounted for $9.88B on 20 prints.
In individual names, NVDA led at $4.5B (21.64M shares, 26 prints) with AAPL right behind at $4.4B (13.64M shares, 15 prints).
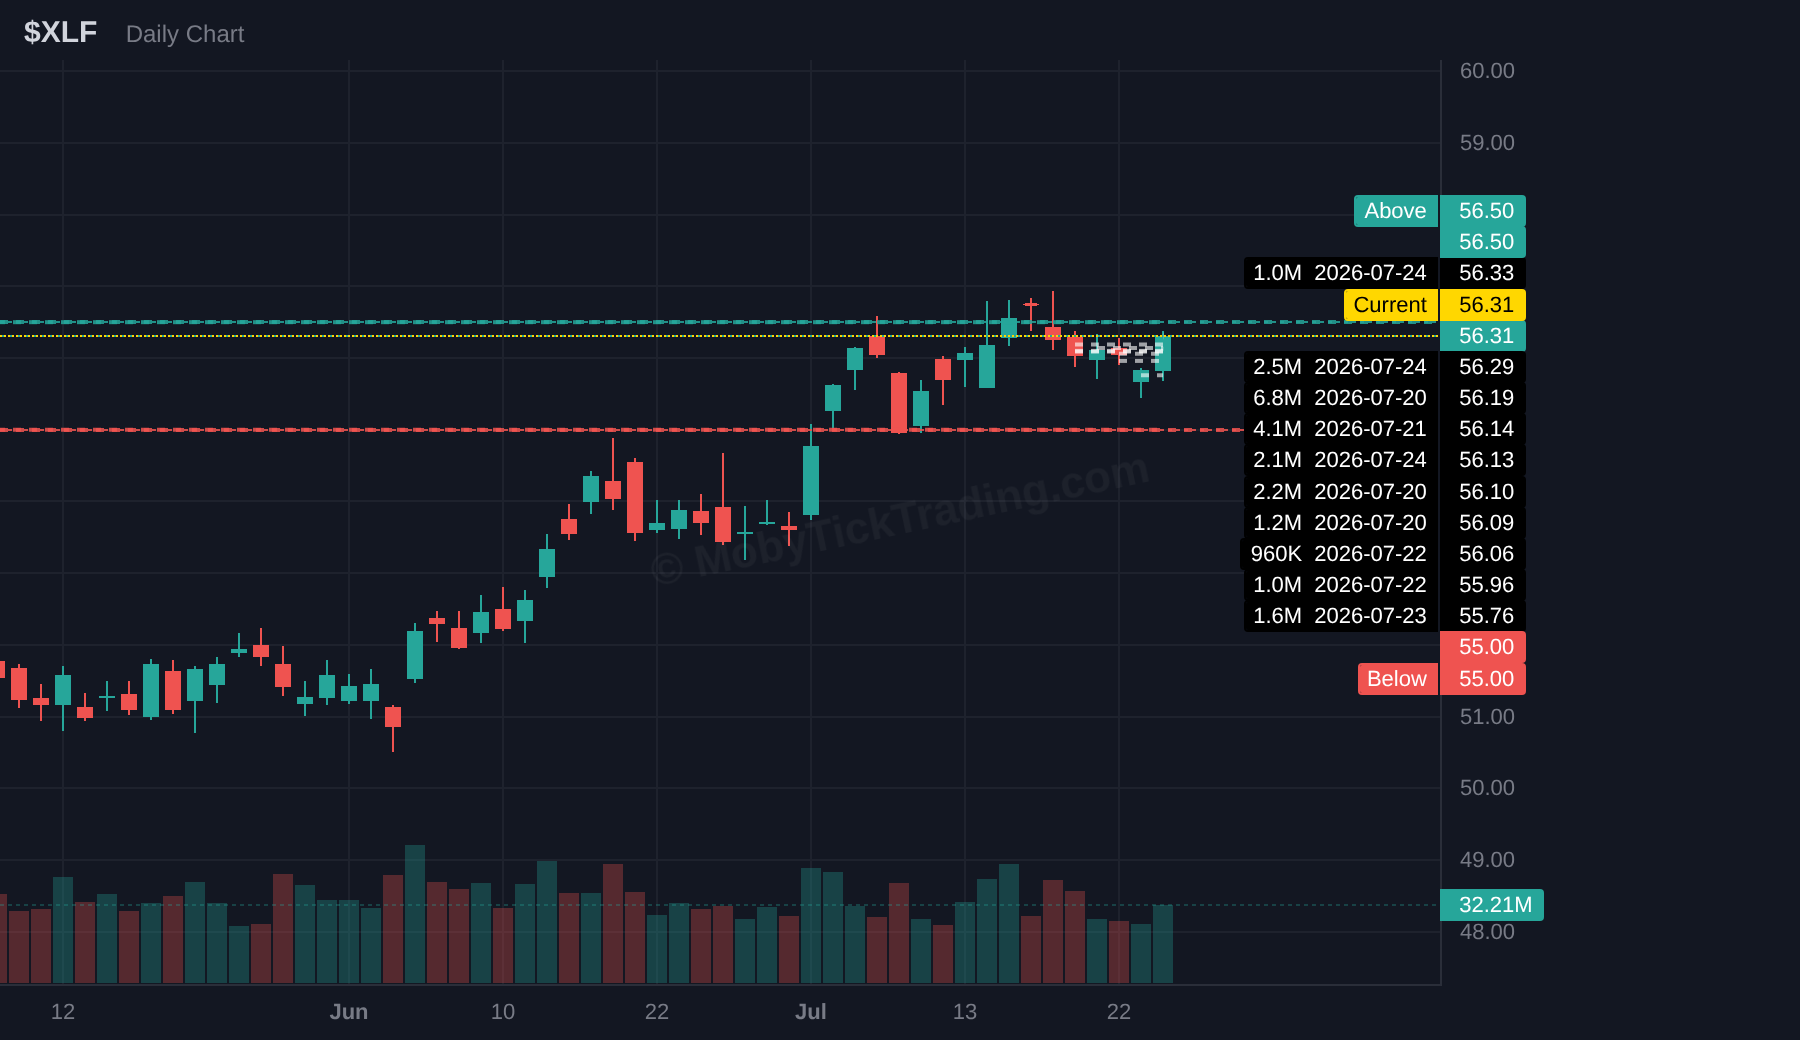
Sector ETFs saw $2.7B total, and XLF led at $1.47B — 26.21M shares across 15 prints, the most print activity of any sector fund. Worth noting given XLF’s flat weekly close.
Looking Ahead: Jul 27–31
FOMC, Tuesday and Wednesday (Jul 28–29). No decision came last week, which is why every Friday wrap read like a waiting room. Markets are assigning roughly 34% odds to a hike, up materially on the 187K claims print, inflation at 3.7%, and Brent above $100.
Thirteen tickers on the board: SPY, QQQ, IWM, XLF, AAPL, AMZN, XOM, TSLA, JPM, INTC, EWY, HOOD, UNH. Six are new this week — XLF, AMZN, JPM, EWY, HOOD and UNH. Two of those (XLF, JPM) sit in the sector that just absorbed the heaviest dark pool flow of the week, and JPM itself logged $1.86B in prints.
Levels are set. Let the tape come to you.
*Data sourced from MobyTick.*
Scorecard — Last Week’s Callout Performance
| Ticker | Above | Below | High | Low | Close | Triggered | Targets Hit | Move From Trigger |
|---|---|---|---|---|---|---|---|---|
| SPY | $751.00 | $740.00 | $750.02 | $735.21 | $738.93 | Below | 0 of 6 | $740.00 → $735.21 (−0.65%) |
| QQQ | $702.50 | $686.00 | $710.05 | $682.48 | $684.23 | Above | 2 of 7 → T2 ($710.00) | $702.50 → $710.05 (+1.07%) |
| IWM | $298.00 | $290.00 | $296.75 | $290.17 | $291.17 | Not triggered | Not triggered | — |
| NVDA | $215.00 | $197.50 | $214.39 | $202.28 | $206.84 | Not triggered | Not triggered | — |
| XOM | $151.00 | $144.50 | $158.71 | $146.23 | $156.94 | Above | 3 of 7 → T3 ($157.50) | $151.00 → $158.71 (+5.11%) |
| INTC | $100.00 | $89.50 | $106.85 | $91.58 | $92.32 | Above | 1 of 7 → T1 ($105.00) | $100.00 → $106.85 (+6.85%) |
| AAPL | $335.00 | $313.00 | $334.37 | $319.35 | $333.02 | Not triggered | Not triggered | — |
| GOOGL | $360.00 | $340.00 | $359.68 | $314.90 | $319.74 | Below | 5 of 5 → T5 ($320.00) | $340.00 → $314.90 (−7.38%) |
| TSLA | $390.00 | $374.00 | $386.61 | $306.51 | $313.03 | Below | 4 of 4 → T4 ($340.00) | $374.00 → $306.51 (−18.05%) |
| SPCX | $140.00 | $122.00 | $129.88 | $110.85 | $115.07 | Below | 1 of 6 → T1 ($120.00) | $122.00 → $110.85 (−9.14%) |
| ACN | $147.50 | $135.00 | $147.53 | $135.96 | $146.99 | Above | 0 of 5 | $147.50 → $147.53 (+0.02%) |
| FCX | $60.00 | $56.00 | $65.43 | $58.52 | $62.60 | Above | 3 of 6 → T3 ($65.00) | $60.00 → $65.43 (+9.05%) |
| PFE | $26.00 | $24.00 | $25.19 | $24.51 | $24.54 | Not triggered | Not triggered | — |
Tally: Above triggered: 5 · Below triggered: 4 · Not triggered: 4
Targets: Tickers reaching ≥1 target: 7 · Total profit targets hit: 19
New tickers this week (no prior callout): XLF, AMZN, JPM, EWY, HOOD, UNH
*Data sourced from MobyTick.*
Bullish Setups — Above Trigger (July 27-31 2026)
| Ticker | Above | T1 | T2 | T3 | T4 | T5 | T6 |
|---|---|---|---|---|---|---|---|
| SPY | $750.00 | $755.00 | $757.00 | $760.00 | $765.00 | $760.00 | $770.00 |
| QQQ | $695.00 | $700.00 | $705.00 | $710.00 | $715.00 | $720.00 | $725.00 |
| IWM | $296.00 | $297.50 | $300.00 | $302.50 | $305.00 | $307.50 | $310.00 |
| XLF | $56.50 | $57.50 | $58.25 | $60.00 | $61.25 | $62.50 | — |
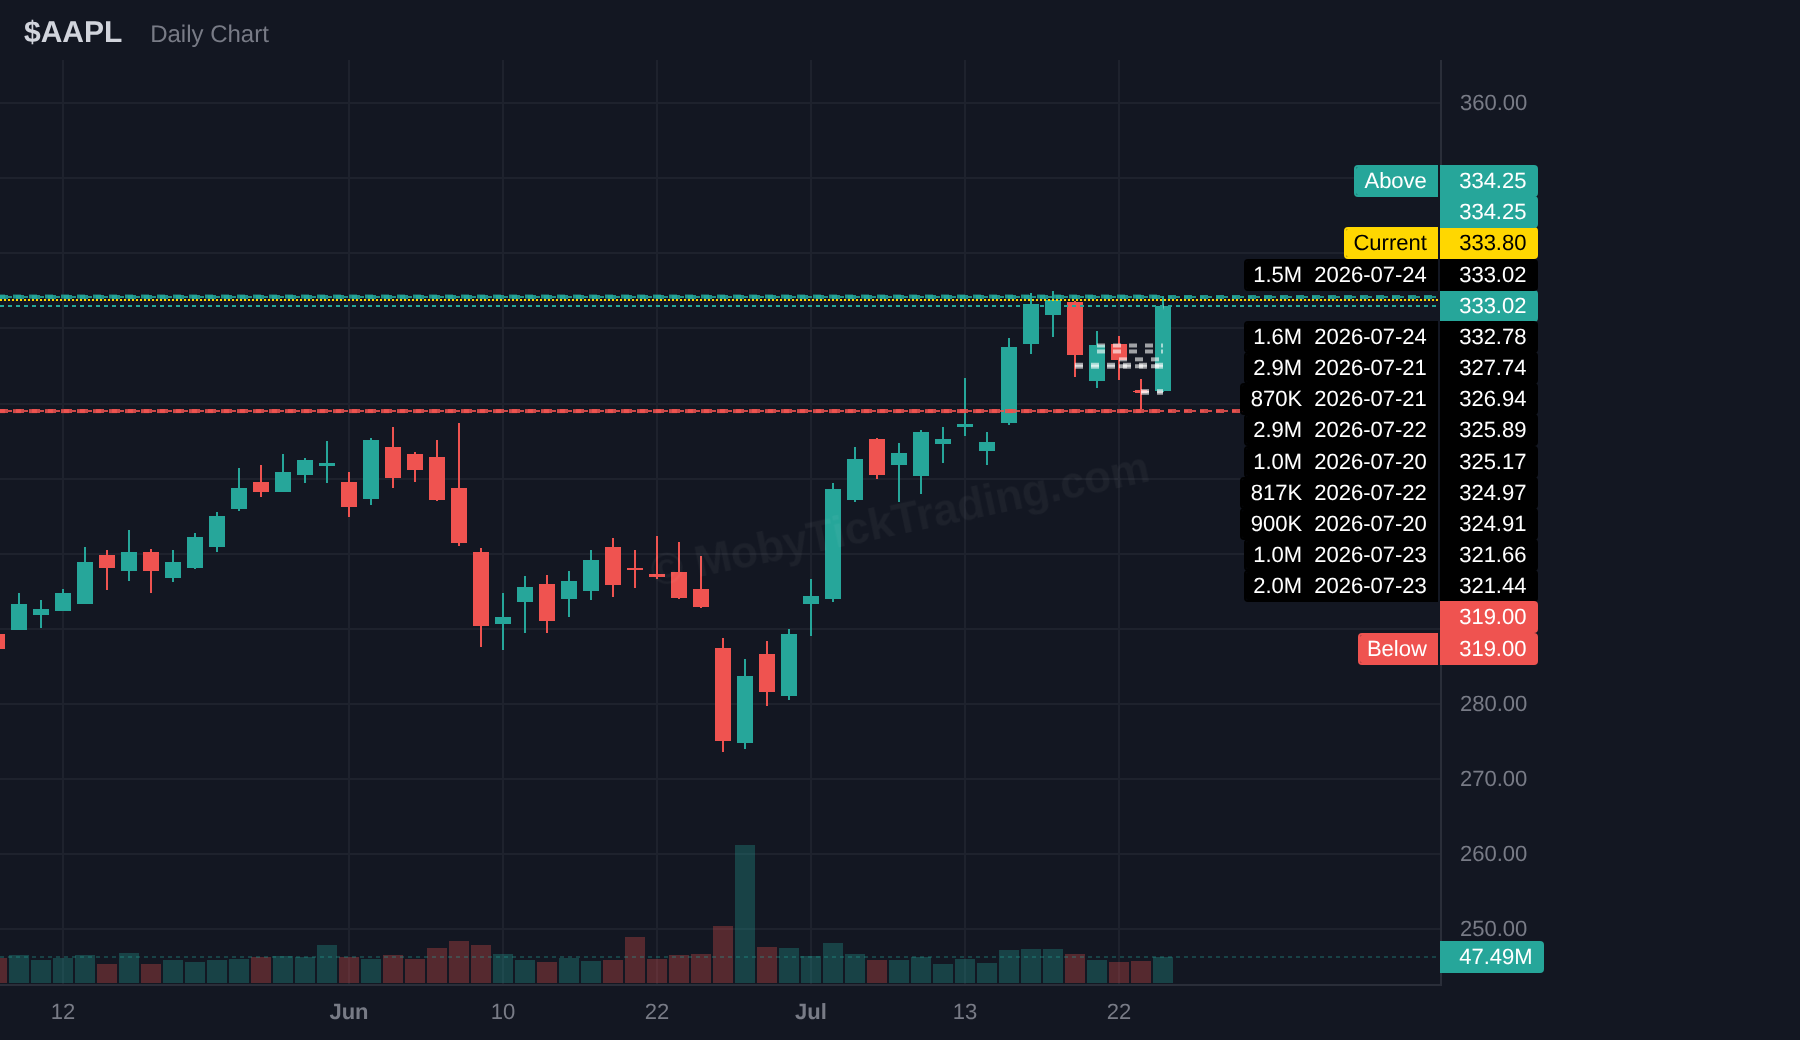
| AAPL | $334.25 | $337.50 | $340.00 | $342.50 | $345.00 | $350.00 | — |
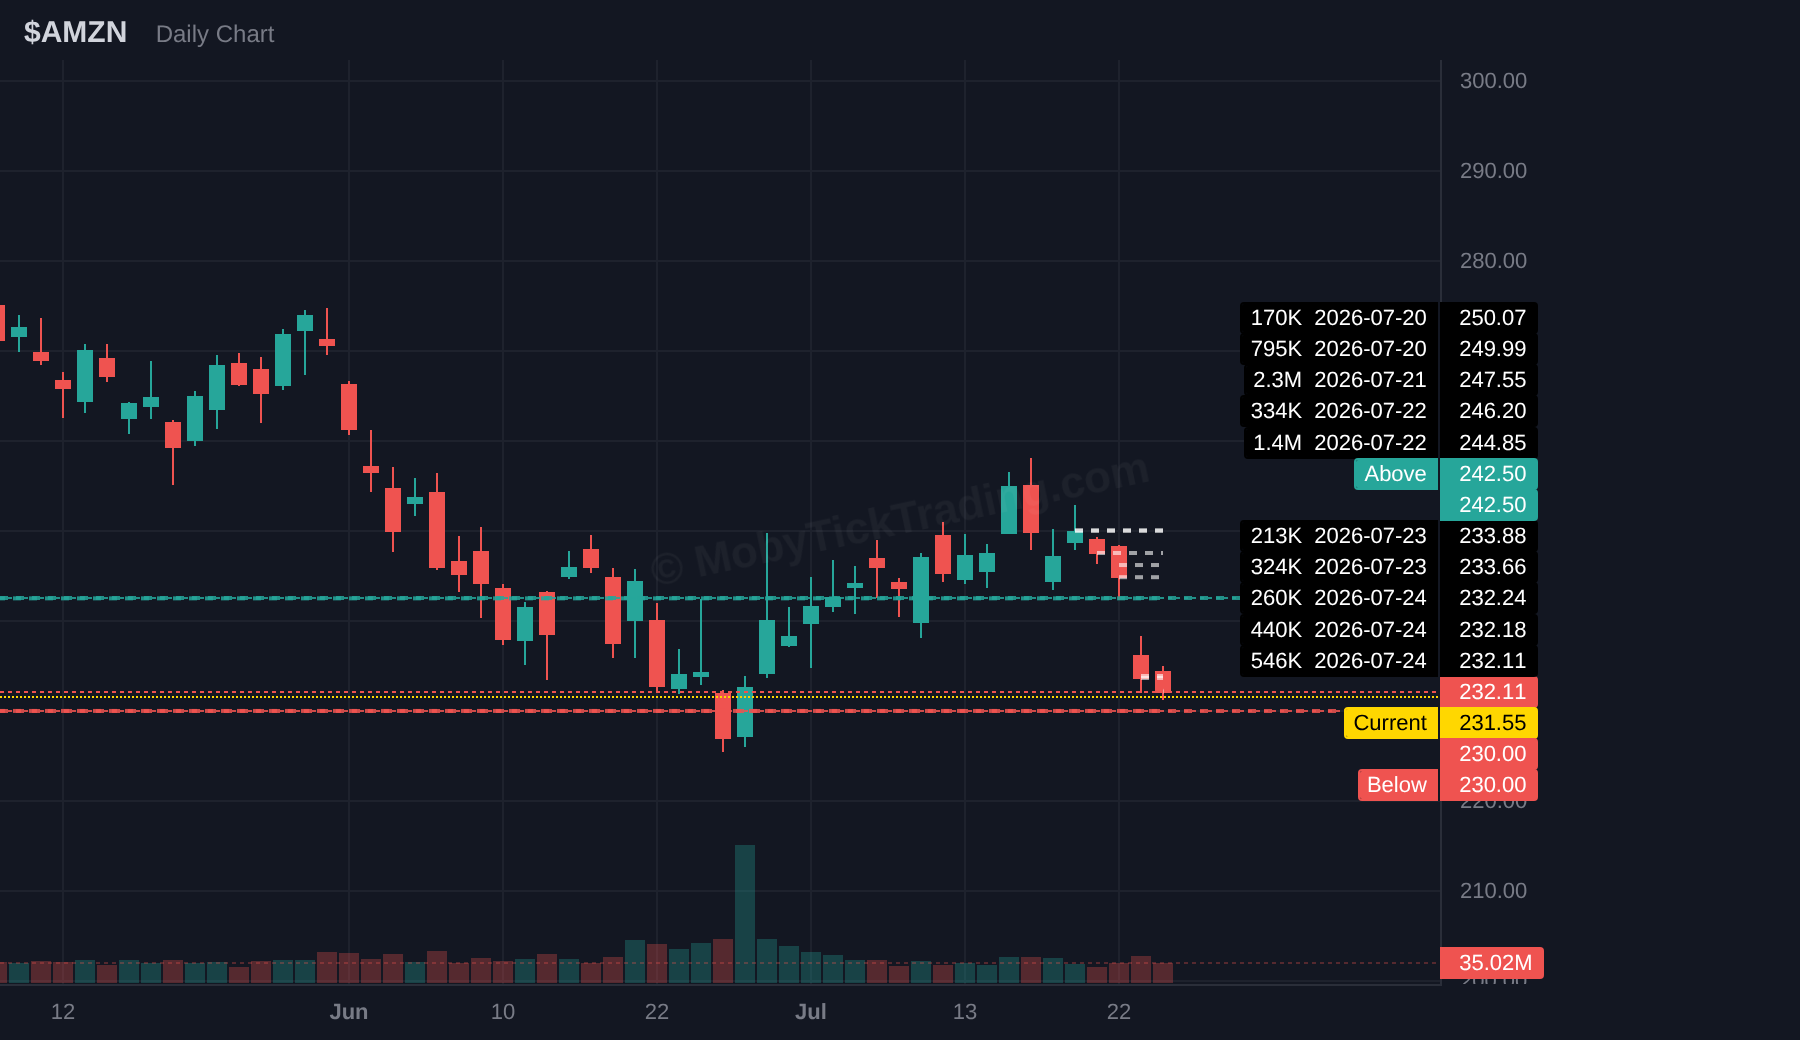
| AMZN | $242.5 | $245 | $247.50 | $250 | $255 | $260 | — |
| XOM | $158.5 | $160 | $162.5 | $165 | $167.5 | $170 | — |
| TSLA | $325 | $340 | $350 | $360 | $374 | — | — |
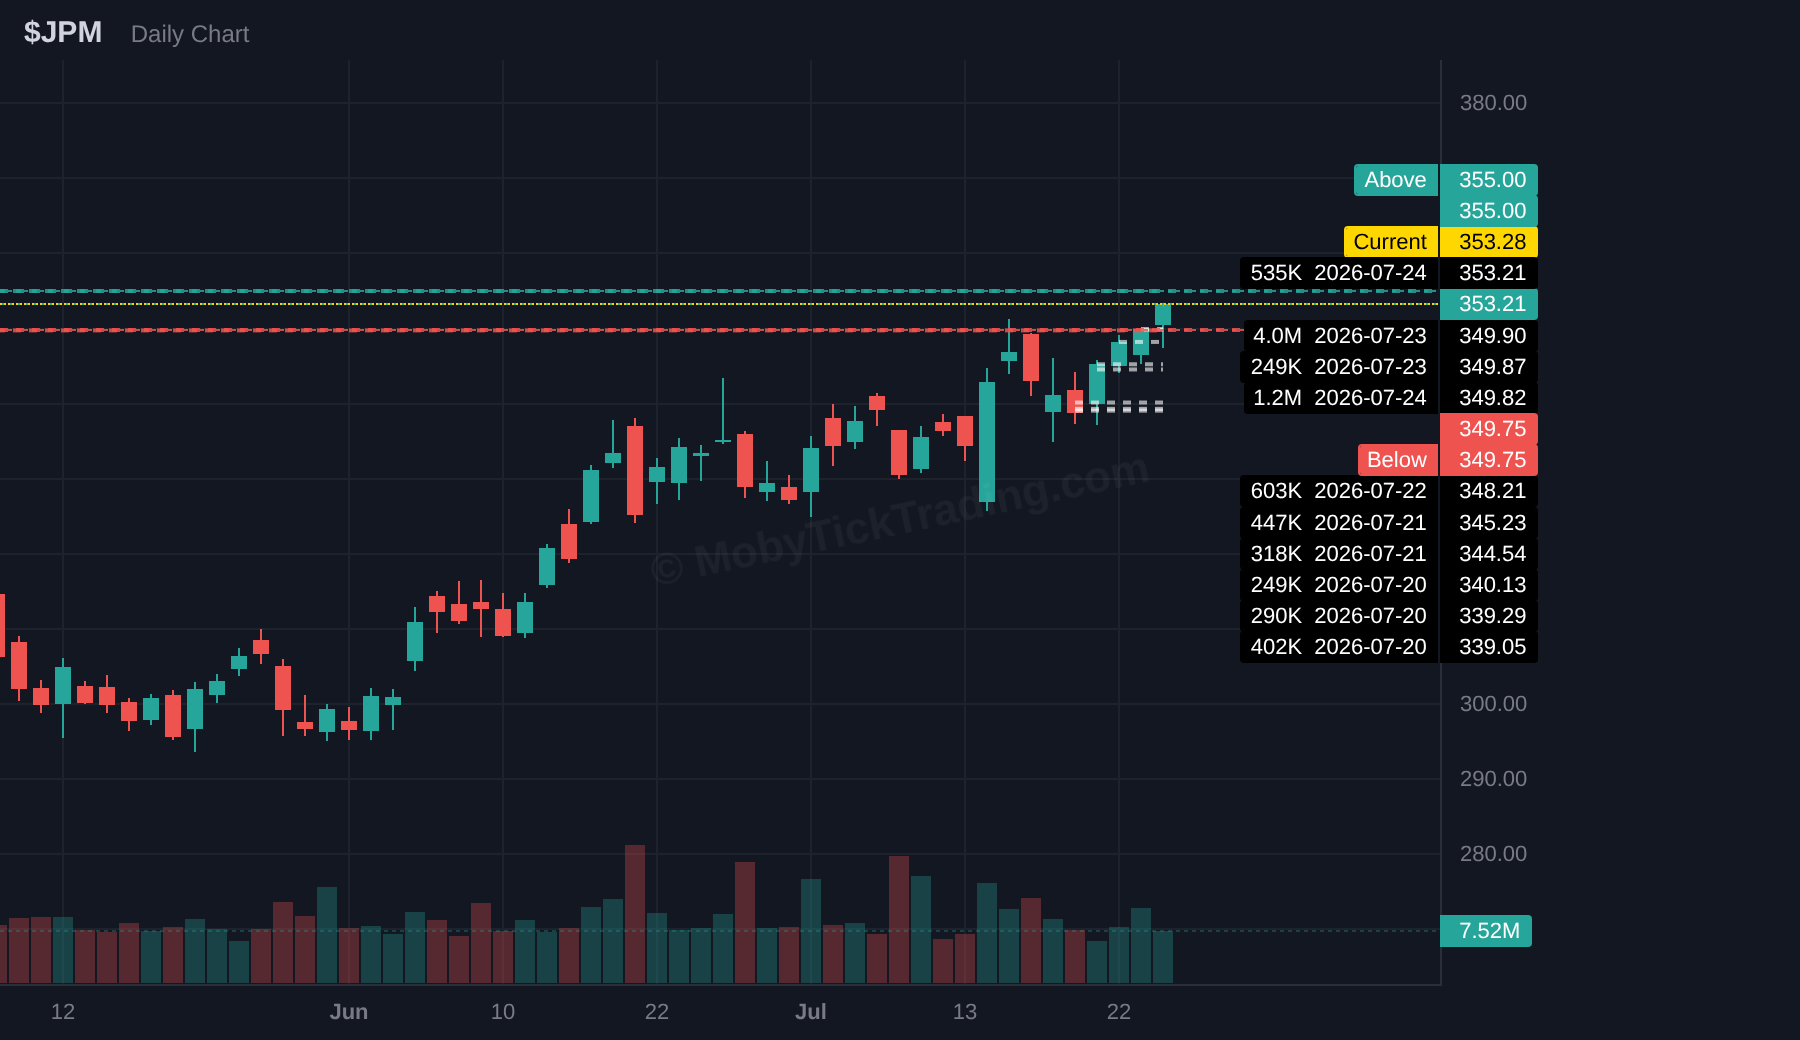
| JPM | $355 | $360 | $362.5 | $365 | $367.5 | $370 | $375 |
| INTC | $105 | $110 | $120 | $130 | $140 | — | — |
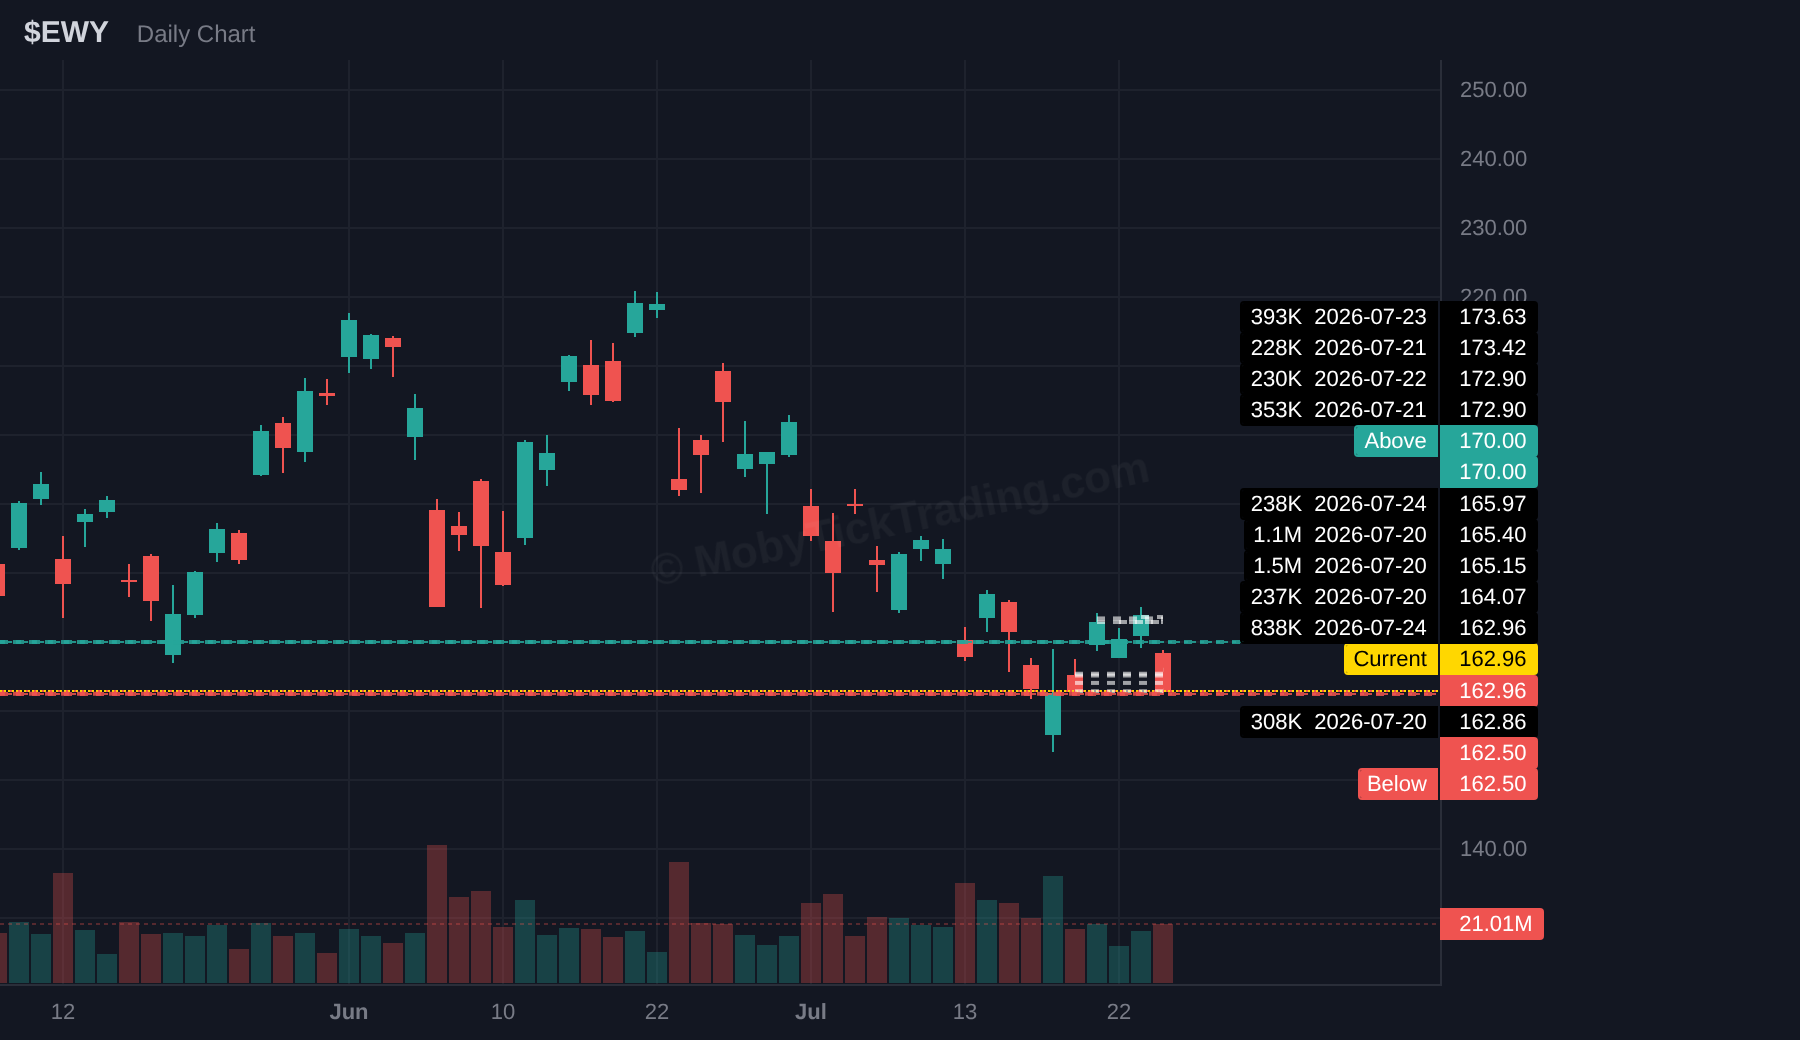
| EWY | $170 | $172.5 | $175 | $177.5 | $180 | $185 | $190 |
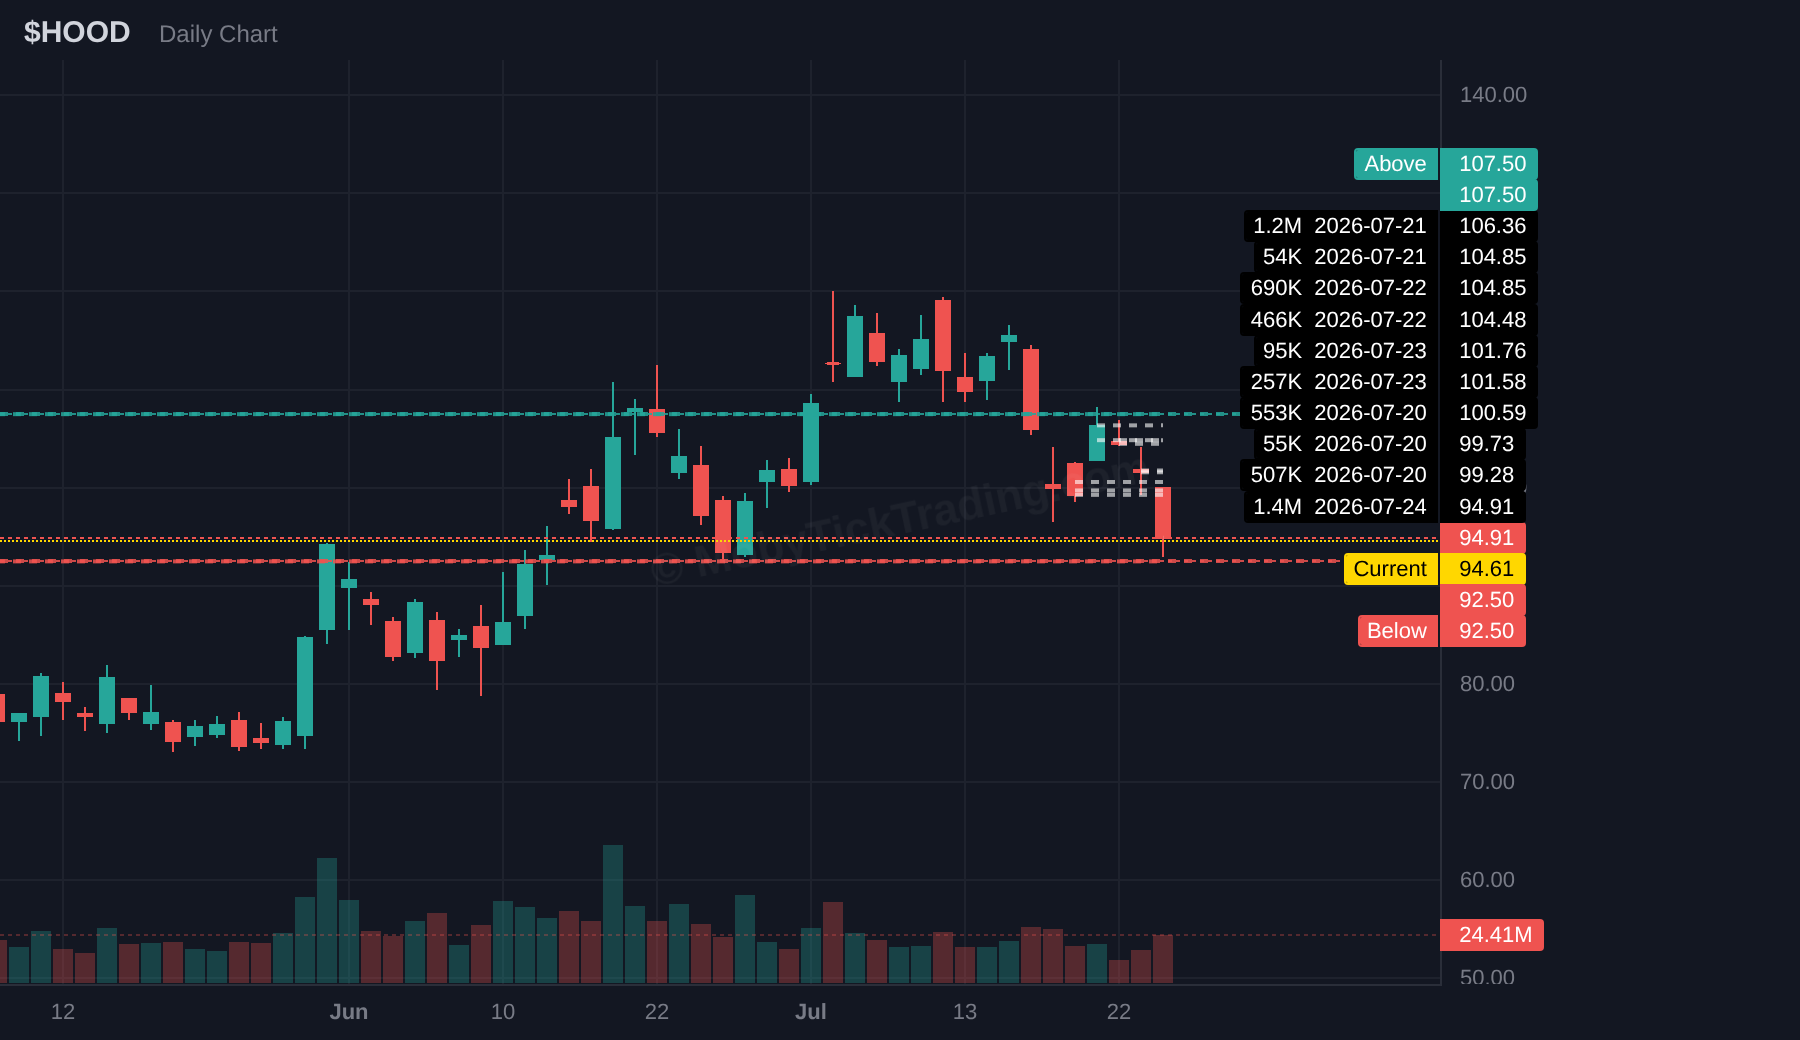
| HOOD | $107.50 | $110 | $115 | $118.5 | $120 | $125 | $130 |
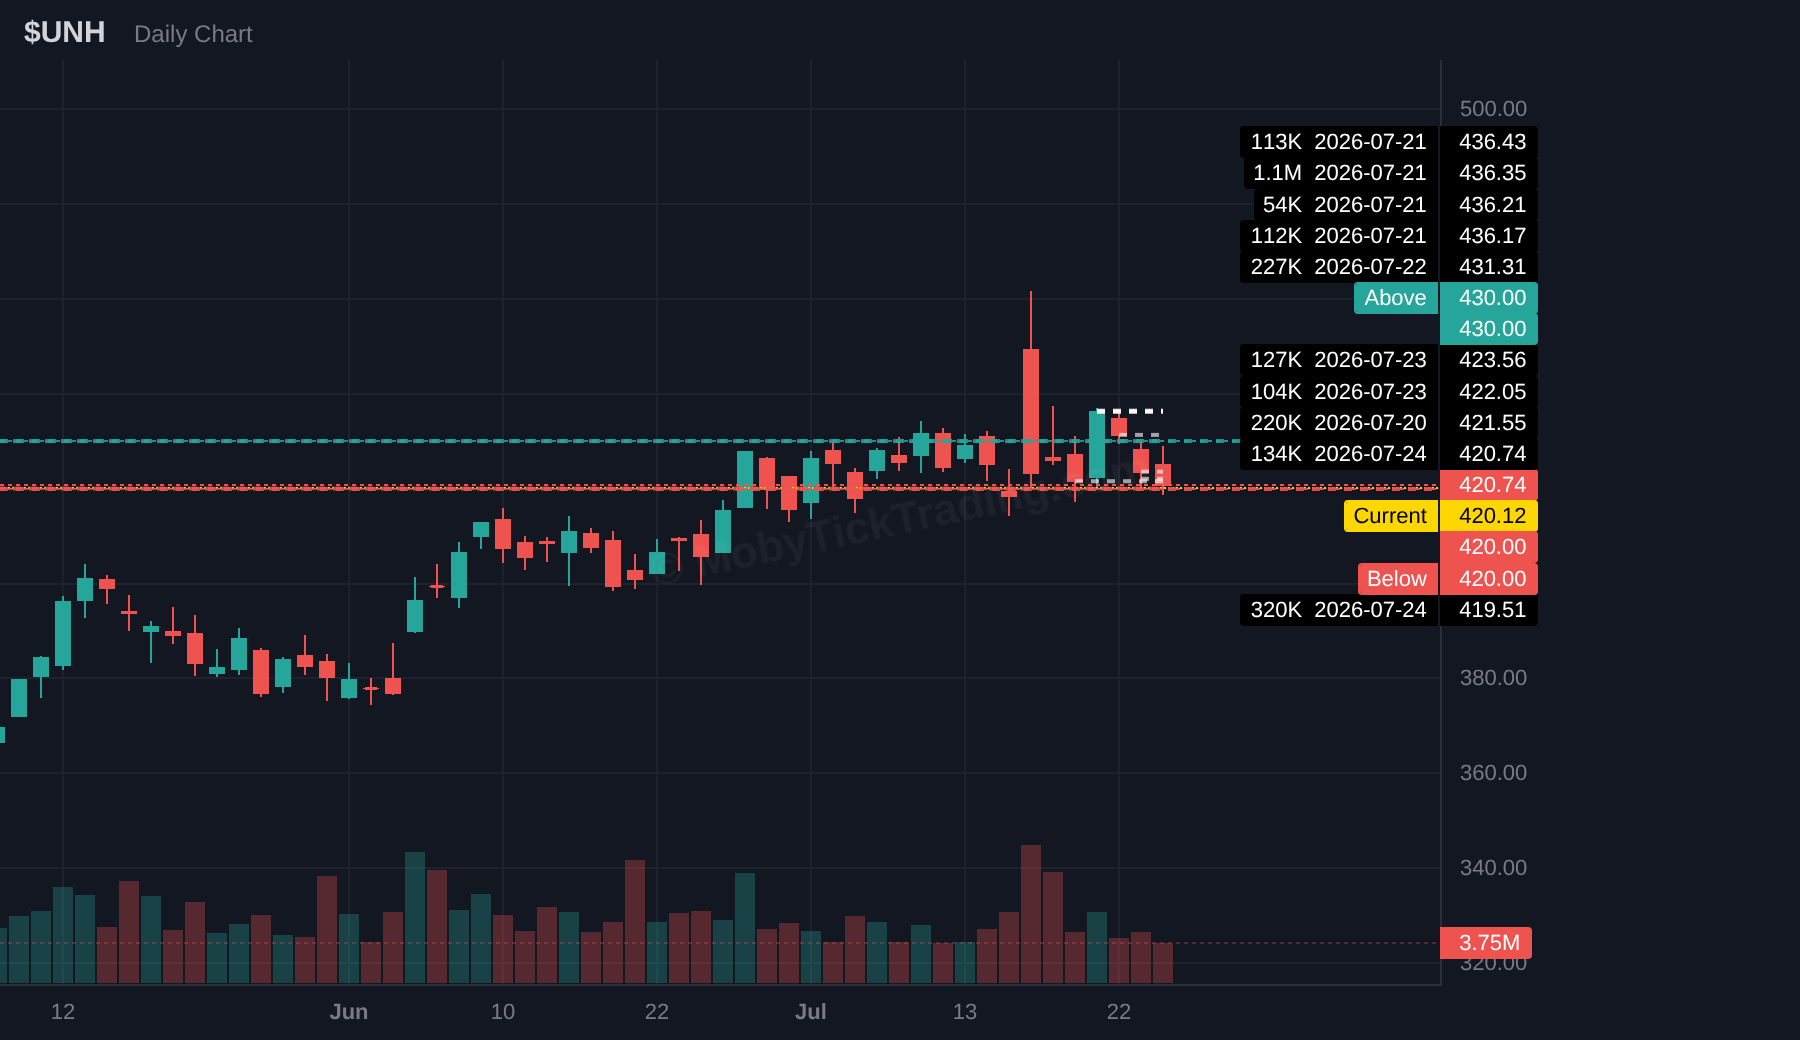
| UNH | $430 | $435 | $440 | $445 | $450 | $460 | — |
Bearish Setups — Below Trigger (July 27-31 2026)
| Ticker | Below | T1 | T2 | T3 | T4 | T5 | T6 | T7 |
|---|---|---|---|---|---|---|---|---|
| SPY | $735.00 | $732.50 | $730.00 | $725.00 | $720.00 | $715.00 | $712.50 | — |
| QQQ | $682.50 | $672.50 | $665.00 | $660.00 | $650.00 | $640.00 | — | — |
| IWM | $290.00 | $287.50 | $285.00 | $282.00 | $280.00 | $277.50 | $275.00 | $272.50 |
| XLF | $55.00 | $54.00 | $53.50 | $52.00 | $51.50 | — | — | — |
| AAPL | $319.00 | $317.50 | $315.00 | $310.00 | $300.00 | $290.00 | — | — |
| AMZN | $230 | $227.5 | $225 | $220 | $215 | $210 | — | — |
| XOM | $154 | $152.5 | $150 | $147.5 | $145 | — | — | — |
| TSLA | $310 | $300 | $282.5 | $265 | $250 | — | — | — |
| JPM | $349.75 | $345 | $340 | $337.5 | $335 | $332.5 | $330 | — |
| INTC | $91 | $85 | $81 | $75 | $70 | $65 | — | — |
| EWY | $162.50 | $160 | $155 | $150 | $140 | $133.5 | — | — |
| HOOD | $92.5 | $90 | $87.50 | $85 | $80 | $75 | $70 | — |
| UNH | $420 | $416 | $411 | $407.5 | $405 | $400 | $398 | $300 |
ETF Dark Pool Flow
Broad market: $19.1B across five vehicles.
Dark pool flow in the major index ETFs totaled $19.06B for the week of Jul 20–24. SPY carried the load with $9.88B across 20 prints (13.3M shares, $742.85 average price) — 52% of all broad-market ETF flow by itself. Behind it: IVV $4.38B (6 prints), VOO $2.21B (6 prints), QQQ $1.93B (6 prints), and IWM $661.6M (5 prints).
Two single names outpaced everything except SPY. NVDA printed $4.50B across 26 blocks — the highest print count in the entire dataset — at an average of $207.87. AAPL followed at $4.44B on 15 prints, average $325.86. Both cleared IVV. When individual equities absorb more block volume than the second-largest S&P vehicle, that’s a concentration signal worth logging.
Sector SPDRs: $2.7B, and it wasn’t spread evenly.
Total flow across the 11 sector ETFs came to $2.70B — roughly one-seventh of broad-market volume. XLF led at $1.47B on 15 prints (26.2M shares, $56.12 average), taking 54% of all sector flow on its own. XLE was a distant second at $467.1M (6 prints), then XLC at $387.2M (3 prints). Those three accounted for 86% of sector activity.
The bottom of the table is the story. XLV registered zero qualifying prints, as did XLI and XLRE. XLB ($27.7M), XLU ($29.5M), and XLY ($52.5M) each cleared on a single print. Eight of eleven sector ETFs were effectively invisible in the block tape.
Price action ran a different script.
XLE led performance at +3.36%, tracking the crude move, followed by XLU +2.48% and XLI +1.81%. XLY was the week’s worst at −5.22%, taking most of its damage Thursday on Tesla’s post-earnings drop, with XLC −3.93% close behind on Alphabet. 8 of 11 sectors closed higher — index-level weakness was concentrated, not broad.
The flag: XLF.
XLF pulled the most sector dark pool flow of the week and closed at +0.09% — flat. Over $1.4B in block volume changed hands with essentially zero price displacement. Dark pool prints don’t disclose which side initiated, so this isn’t a call on positioning. But size moving through a name that doesn’t move is the kind of divergence that usually resolves later, not never. XLF goes on the watchlist.
*Data sourced from MobyTick. 695 total prints captured Jul 20–24, 2026.*
Educational
Four of last week’s thirteen callouts — IWM, NVDA, AAPL, and PFE — never triggered Above or Below. New readers often read that as a miss. It isn’t. It’s a signal in its own right, and it’s one of the more useful ones we get.
Here’s the mechanic. Every callout brackets a ticker with two levels drawn from where institutional size actually printed. The Above level sits over the dark pool band; the Below level sits under it. When price closes the week *between* them, the read was correct: size accumulated inside a range, and the range held.
Look at AAPL. The band was $313 to $335. The week’s actual travel was $319.35 to $334.37 — a full week of trading that never escaped either side. Dark pool prints in AAPL averaged $325.86 across 15 prints worth $4.44B, essentially dead-center in that band. Price didn’t break out because institutions weren’t pushing it out; they were transacting inside it.
IWM is the tighter example. Below sat at $290.00. The week’s low was $290.17 — seventeen cents of daylight. That’s not luck, that’s the band doing its job as a boundary. NVDA did the same thing on both ends: $202.28 to $214.39 inside a $197.50/$215.00 bracket, with $4.5B in prints averaging $207.87.
Why this matters practically:
A “no trigger” week is a range read, not a dead week. Consolidation inside a dark pool band means the level structure is still valid. Nothing invalidated it.
It informs position sizing. Breakout entries have no edge until a trigger actually fires. Waiting costs you nothing; guessing costs you the trigger’s whole purpose.
It sharpens the next callout. AAPL’s new band this week is $334.25 / $319.00 — nearly identical to last week’s realized high and low. IWM’s Above tightened from $298.00 to $296.00. When a range holds, the band compresses around it, and compression is what makes the eventual trigger meaningful.
A trigger that doesn’t fire told you exactly what it was supposed to: not yet.
*Data sourced from MobyTick.*
Dark Pool Charts — July 27-31 2026
AAPL
AMZN
EWY
HOOD
INTC
IWM
JPM
QQQ
SPY
TSLA
UNH
XLF
XOM
Stop Guessing. Track the Smart Money.
Get institutional dark pool intelligence delivered weekly.
Start Your 7-Day Free Trial