
Market Overview
Large caps finished the week lower, and technology accounted for most of the decline. SPY closed at 763.25, down 1.97% for the week. QQQ fell 5.52% to 709.80 and IWM dropped 3.05% to 270.44. The Dow ETF was the exception, adding 0.58% to close at 519.10. The S&P 500 and Nasdaq both posted their worst week since June, the Washington Post reported.
| ETF | Open | High | Low | Close | Week % |
|---|---|---|---|---|---|
| SPY | 778.78 | 779.40 | 760.64 | 763.25 | -1.97% |
| QQQ | 749.69 | 749.79 | 707.23 | 709.80 | -5.52% |
| IWM | 278.47 | 279.14 | 269.88 | 270.44 | -3.05% |
| DIA | 516.42 | 525.09 | 512.96 | 519.10 | +0.58% |
What Led and What Lagged
The split was sector-level. Semiconductors and AI infrastructure fell sharply. SMH lost 10.53% on the week and XLK fell 7.70%. On Friday alone, SMH fell 3.41% and the PHLX Semiconductor Index dropped 3.83%. TradingEconomics reported that chips fell for an eighth consecutive session, their longest losing streak since 2008. The Nasdaq 100 closed Friday down 2.50%, compared with 1.09% for the S&P 500 and 0.34% for the Dow. The VIX rose 21.45% on the day to 19.99.
Defensive and commodity sectors took the other side. XLP gained 5.02%, XLE 4.86%, XLV 3.45% and XLB 3.01%. XLU added 1.93% and XLF 1.44%. XLC, XLY and XLI each finished the week slightly lower.
Rates and Crude
The 10-year Treasury yield ended at 5.09%, down 1 basis point on Friday, and the 2-year finished at 4.74%, down 3 basis points. Crude kept climbing. November WTI rose 3.82% to $101.71, its seventh straight up session, and Brent gained 3.74% to $109.88. The research digest attributed the supply risk premium to Iranian attacks on tankers. Inflation data released during the week came in hot, and Morgan Stanley’s read is that the Fed stays on hold in October. Fed Chair Kevin Warsh declined to signal the October decision.
Dark Pool Flow
MobyTick counts prints of 50,000 shares or more and excludes the opening and closing auctions. QQQ printed $32.66B across 44.78M shares at 133 levels, slightly ahead of SPY at $32.28B, 41.88M shares and 68 levels. IWM printed $7.15B across 26.09M shares at 99 levels.
On the single-name watch list, MSFT printed $6.72B at an average of $537.34 and closed at 529.05. MDT printed $5.70B on 60.43M shares across only 16 levels, averaging $94.38, and closed at 94.75. TSLA printed $2.94B at an average of $363.70 and closed at 354.72. PG saw $1.93B at an average of $157.30, PLTR $1.44B at $199.91 and WMT $0.71B at $116.39. In the sector funds, XLF printed $1.73B across 75 levels and XLU $0.33B across 37 levels. PBR printed $0.17B and AVTR $42.3M.
Last Week’s Scorecard
Of the levels issued October 12, above-side triggers fired on 8 tickers and below-side triggers on 7. Two tickers, PLTR among them, triggered on both sides. Twelve of 13 tickers reached at least one target, with 37 targets hit in total. QQQ and TSLA each reached 6 of 6 lower-side targets. MDT reached 4 of 4 upper-side targets on a 7.22% move from the trigger, and WMT reached 4 of 4 upper-side targets on a 7.42% move.
On the Calendar
Friday’s session was monthly options expiration. Among the tickers covered here, TSLA reports first, on Wednesday, October 21 after the close, followed by PG before the open on Thursday, October 22, with its call at 8:30 a.m. ET. The following week brings the FOMC meeting on October 27 and 28, plus AVTR before the open and MSFT after the close on October 28. PLTR, PBR and WMT report in November. MDT has not announced a date; its historical window runs November 18 to 27. SPY, QQQ, IWM, XLU and XLF are ETFs and do not report.
| Date | Event |
|---|---|
| Fri Oct 16 | Monthly options expiration |
| Wed Oct 21 | TSLA earnings, after close |
| Thu Oct 22 | PG earnings, before open (call 8:30 a.m. ET) |
| Oct 27–28 | FOMC meeting |
| Wed Oct 28 | AVTR earnings, before open |
| Wed Oct 28 | MSFT earnings, after close |
| Mon Nov 2 | PLTR earnings, after close |
| Tue Nov 10 | PBR earnings, after close |
| Thu Nov 19 | WMT earnings, before open |
| TBA | MDT earnings (historical window Nov 18–27) |
Semiconductors head into the new week after eight consecutive losing sessions.
Last Week’s Callout Performance
| Ticker | Above | Below | High | Low | Close | Triggered | Targets Hit | Move From Trigger |
|---|---|---|---|---|---|---|---|---|
| SPY | $780.00 | $772.00 | $779.40 | $760.64 | $763.25 | Below | 2 of 4 → T2 ($765.00) | $772.00 → $760.64 (-1.47%) |
| QQQ | $762.50 | $747.00 | $749.79 | $707.23 | $709.80 | Below | 6 of 6 → T6 ($720.00) | $747.00 → $707.23 (-5.32%) |
| IWM | $282.50 | $275.00 | $279.14 | $269.88 | $270.44 | Below | 2 of 6 → T2 ($270.00) | $275.00 → $269.88 (-1.86%) |
| MDT | $90.00 | $85.00 | $96.50 | $90.20 | $94.75 | Above | 4 of 4 → T4 ($95.00) | $90.00 → $96.50 (+7.22%) |
| NVDA | $235.00 | $225.00 | $228.86 | $212.85 | $214.13 | Below | 4 of 4 → T4 ($215.00) | $225.00 → $212.85 (-5.40%) |
| PLTR | $210.00 | $185.00 | $212.94 | $184.45 | $186.03 | Both | Above: 1 of 6 → T1 ($212.50) · Below: 0 of 6 | $210.00 → $212.94 (+1.40%) · $185.00 → $184.45 (-0.30%) |
| TSLA | $390.00 | $367.50 | $382.70 | $349.33 | $354.72 | Below | 6 of 6 → T6 ($350.00) | $367.50 → $349.33 (-4.94%) |
| WMT | $113.00 | $106.00 | $121.38 | $111.31 | $118.81 | Above | 4 of 4 → T4 ($120.00) | $113.00 → $121.38 (+7.42%) |
| MRNA | $226.00 | $182.50 | $242.29 | $204.70 | $218.01 | Above | 3 of 7 → T3 ($240.00) | $226.00 → $242.29 (+7.21%) |
| AMZN | $263.25 | $250.00 | $263.70 | $248.60 | $250.00 | Both | Above: 0 of 5 · Below: 0 of 5 | $263.25 → $263.70 (+0.17%) · $250.00 → $248.60 (-0.56%) |
| MSFT | $537.50 | $516.00 | $551.15 | $524.43 | $529.05 | Above | 3 of 5 → T3 ($550.00) | $537.50 → $551.15 (+2.54%) |
| PBR | $25.50 | $23.75 | $26.10 | $25.11 | $26.00 | Above | 1 of 7 → T1 ($26.00) | $25.50 → $26.10 (+2.35%) |
| XLU | $41.50 | $40.50 | $42.29 | $41.09 | $42.21 | Above | 1 of 7 → T1 ($42.00) | $41.50 → $42.29 (+1.90%) |
Above triggered: 8 · Below triggered: 7 · Not triggered: 0
Tickers reaching ≥1 target: 12 · Total profit targets hit: 37
Upper Reference Levels
| Ticker | Upper Reference | Reference Levels | Earnings |
|---|---|---|---|
| SPY | $775 | $777.50 → $780 → $785 → $790 → $795 → $800 | — |
| QQQ | $728 | $730 → $735 → $740 → $743.50 → $750 → $755 | — |
| IWM | $277.50 | $280 → $281.50 → $285 → $287.50 → $290 | — |
| MDT | $96.50 | $97.50 → $100 → $101.25 → $102.5 → $105 → $107.50 | Not yet announced (est. Nov 18–27) |
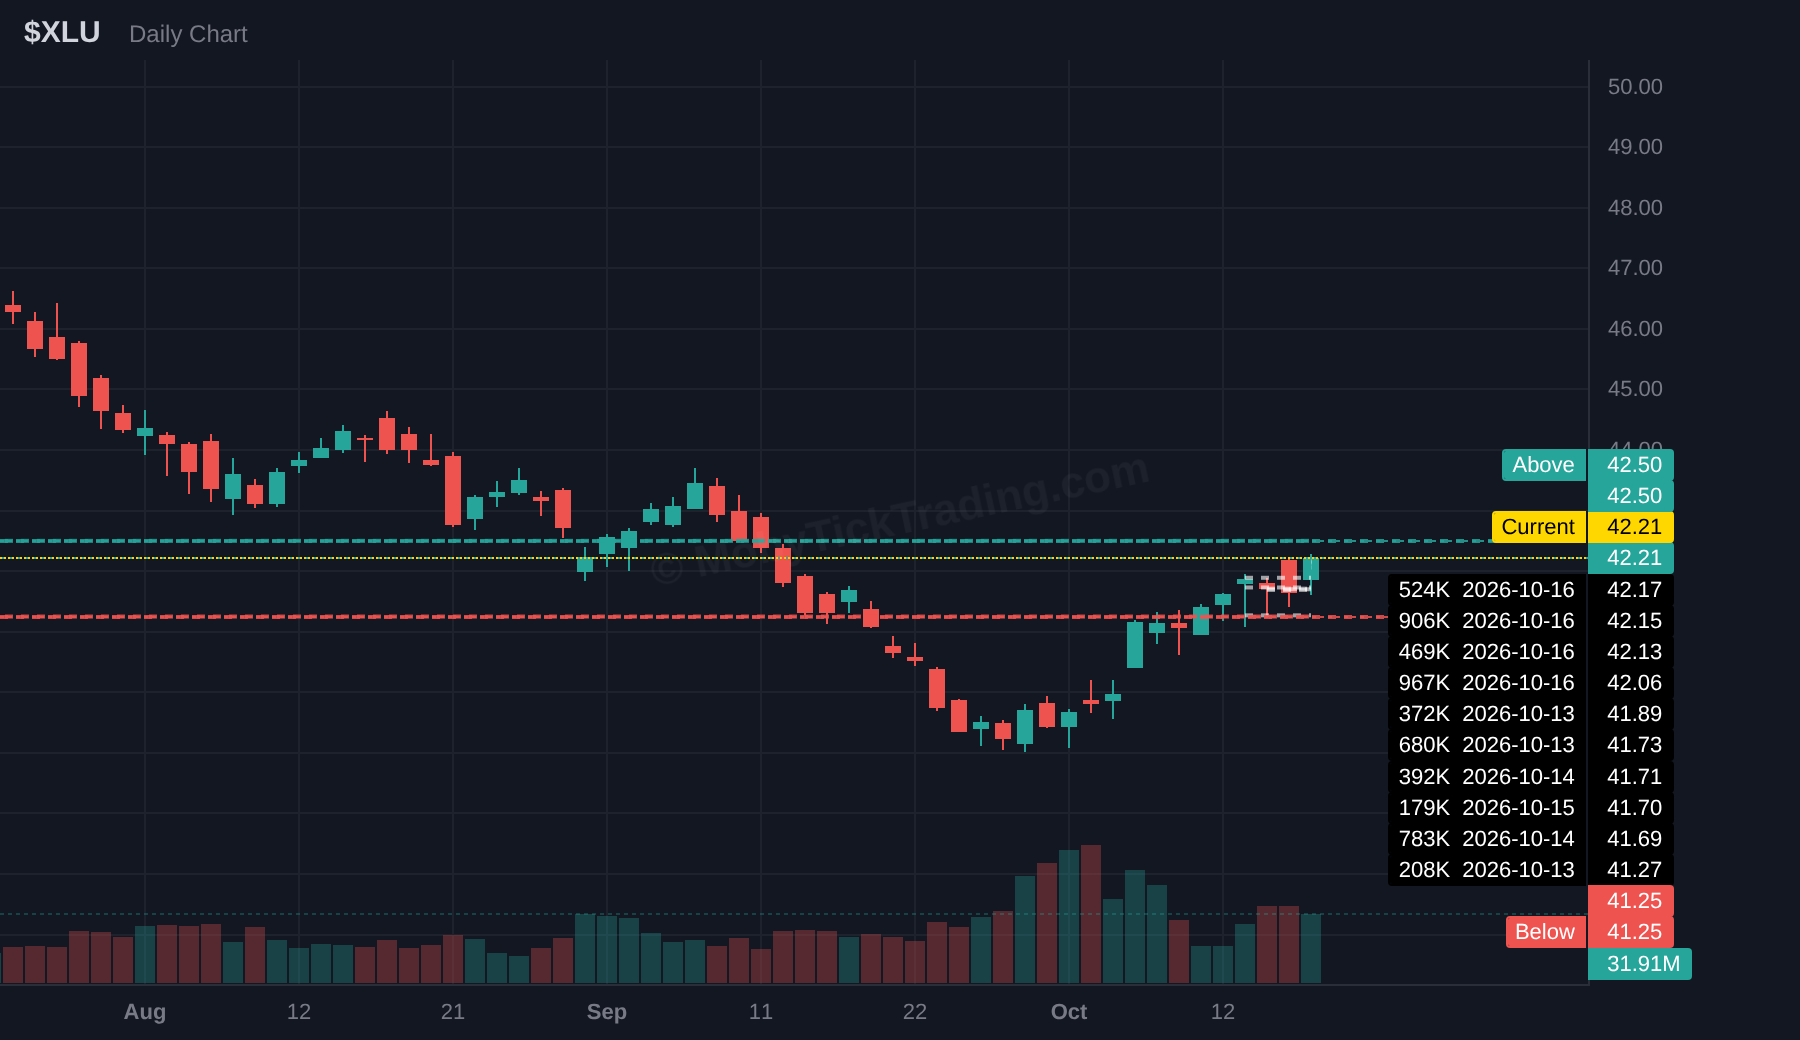
| XLU | $42.50 | $43 → $43.5 → $44 → $44.5 → $45 | — |
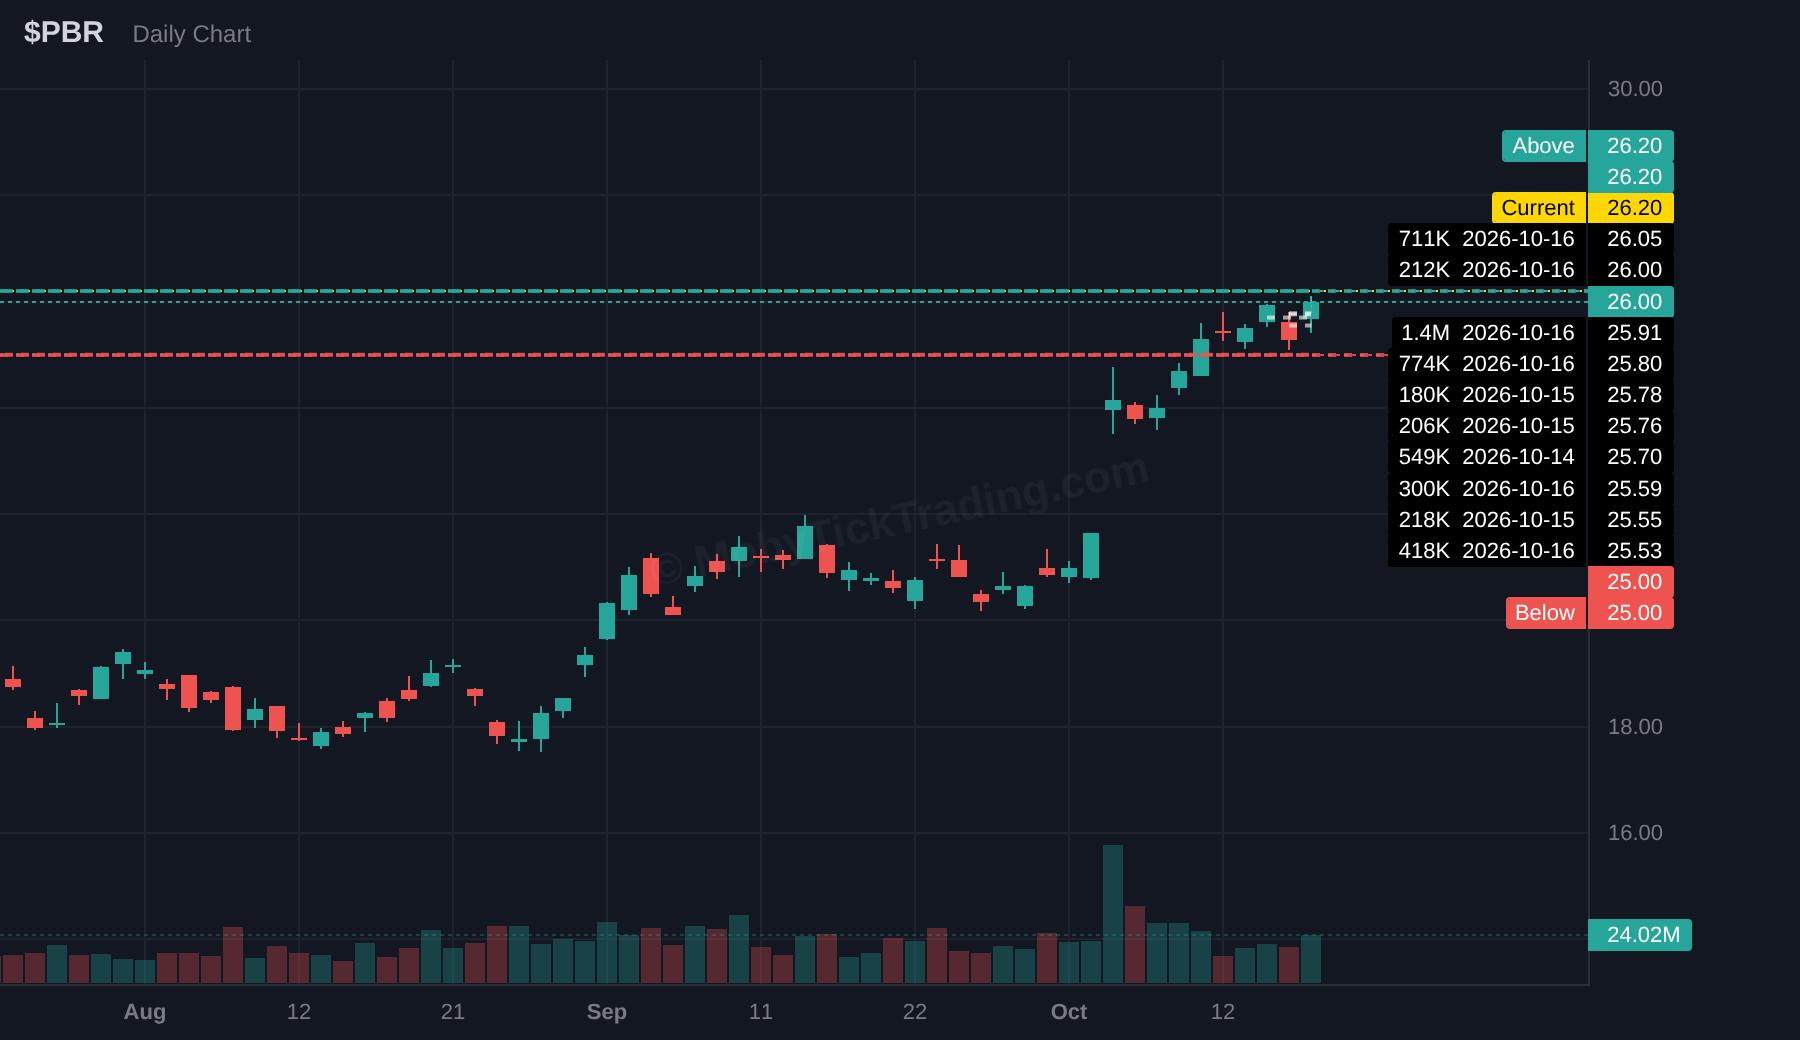
| PBR | $26.2 | $26.5 → $27 → $27.5 → $28 → $29 → $30 | Tue Nov 10 · after close |
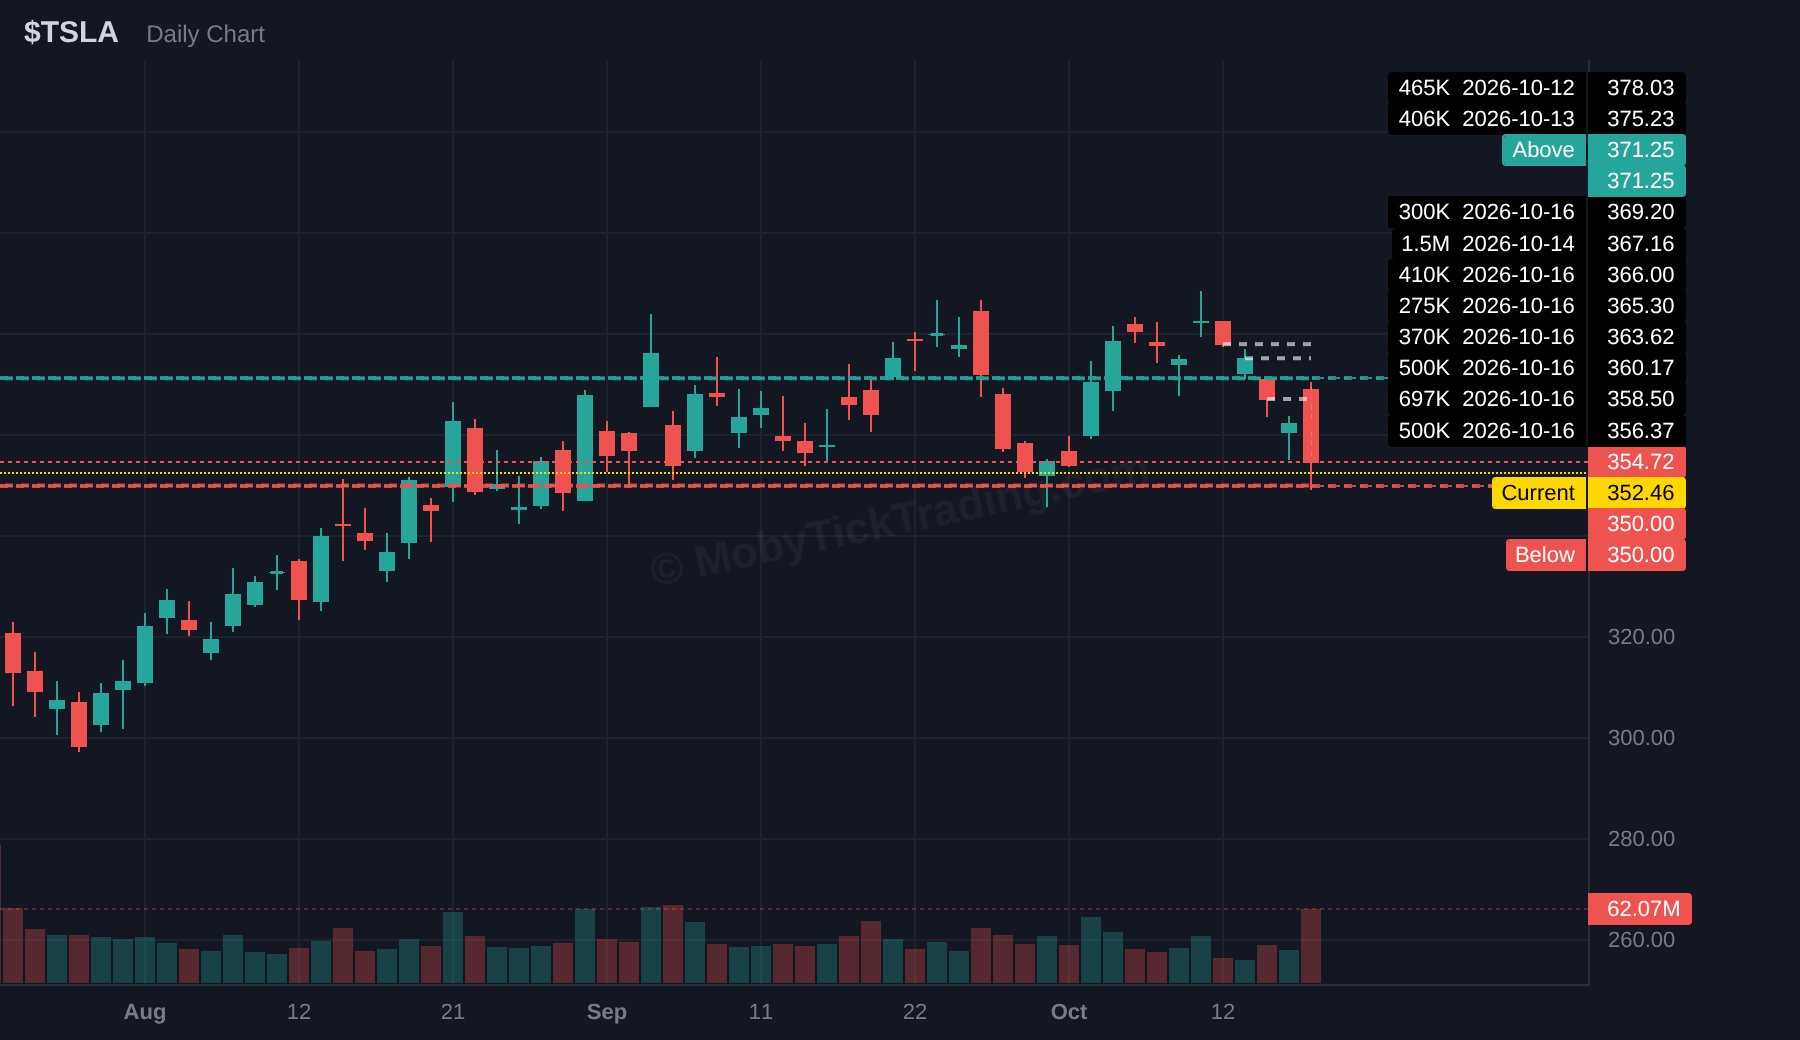
| TSLA | $371.25 | $375 → $380 → $390 → $400 | Wed Oct 21 · after close |
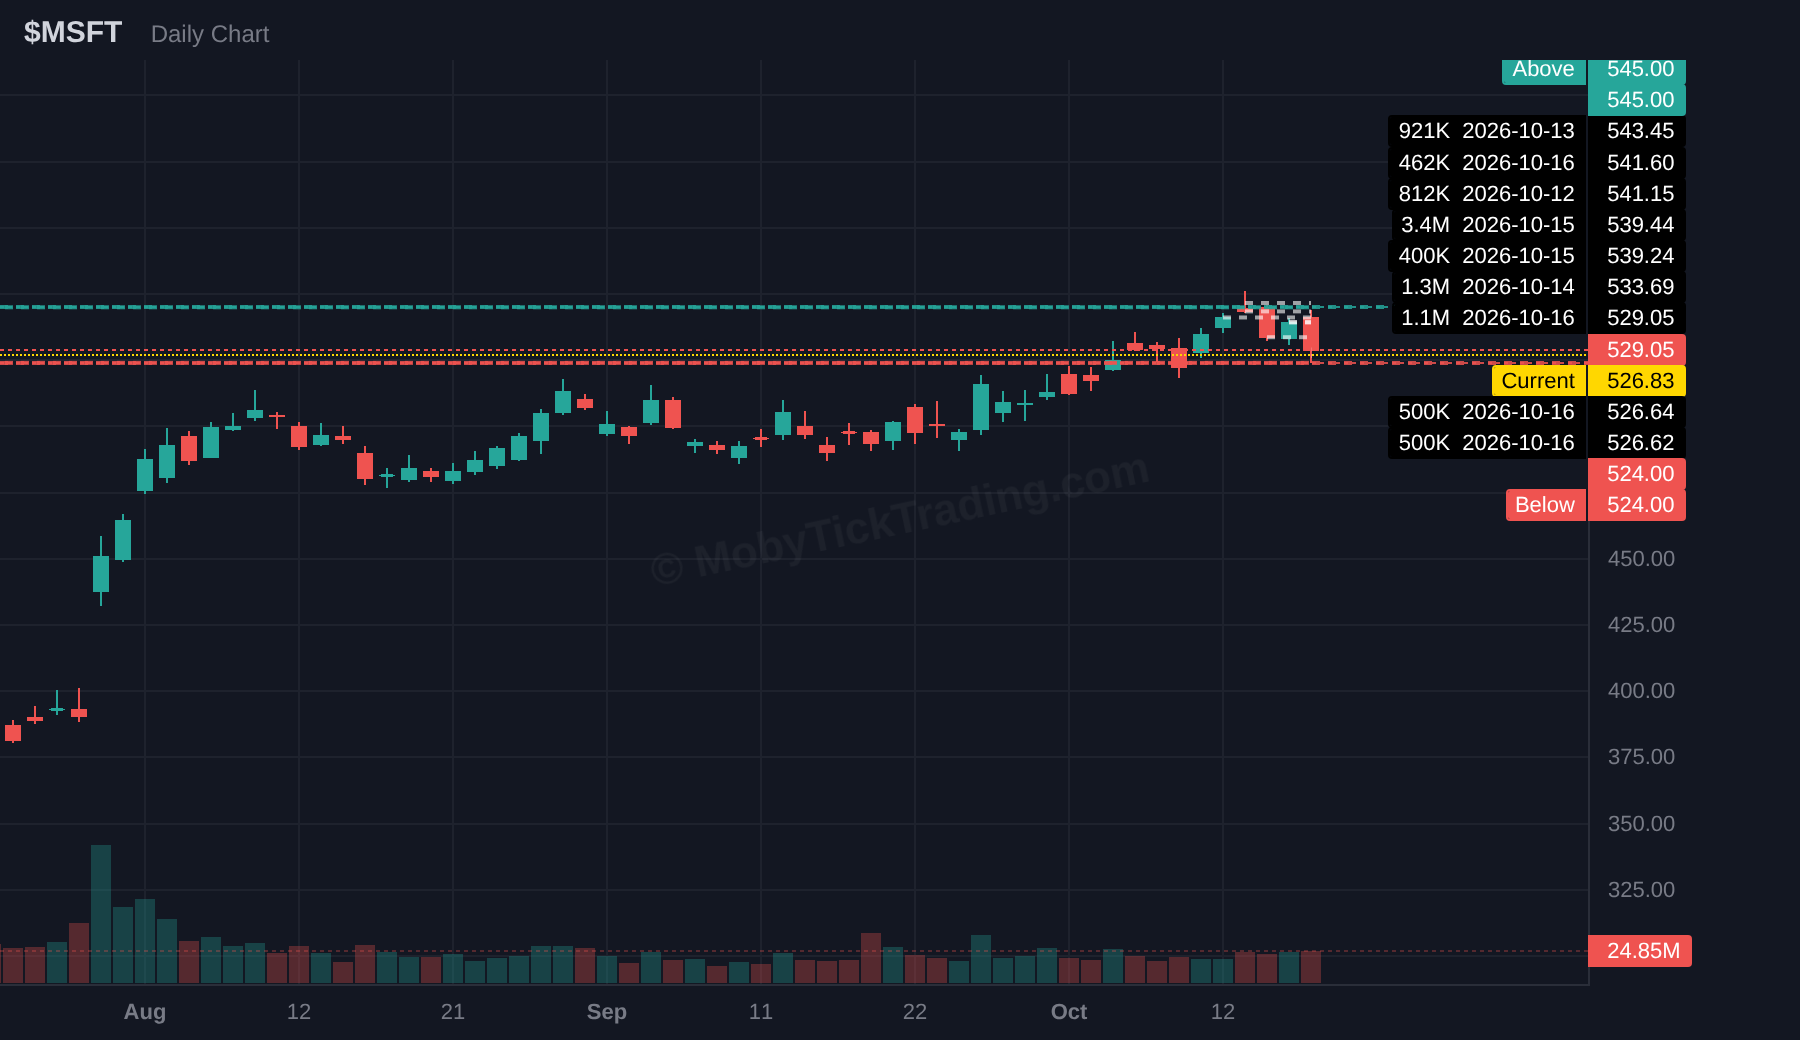
| MSFT | $545 | $550 → $560 → $570 → $575 → $580 | Wed Oct 28 · after close |
| WMT | $121.5 | $122.5 → $124 → $125 → $126.25 → $127.5 → $130 | Thu Nov 19 · before open |
| PG | $160 | $161.25 → $162.5 → $164 → $165 → $167.50 → $170 | Thu Oct 22 · before open |
| XLF | $56.5 | $57 → $57.25 → $58 → $58.50 | — |
| PLTR | $203.5 | $205 → $207.5 → $210 → $212.5 → $215 → $220 | Mon Nov 2 · after close |
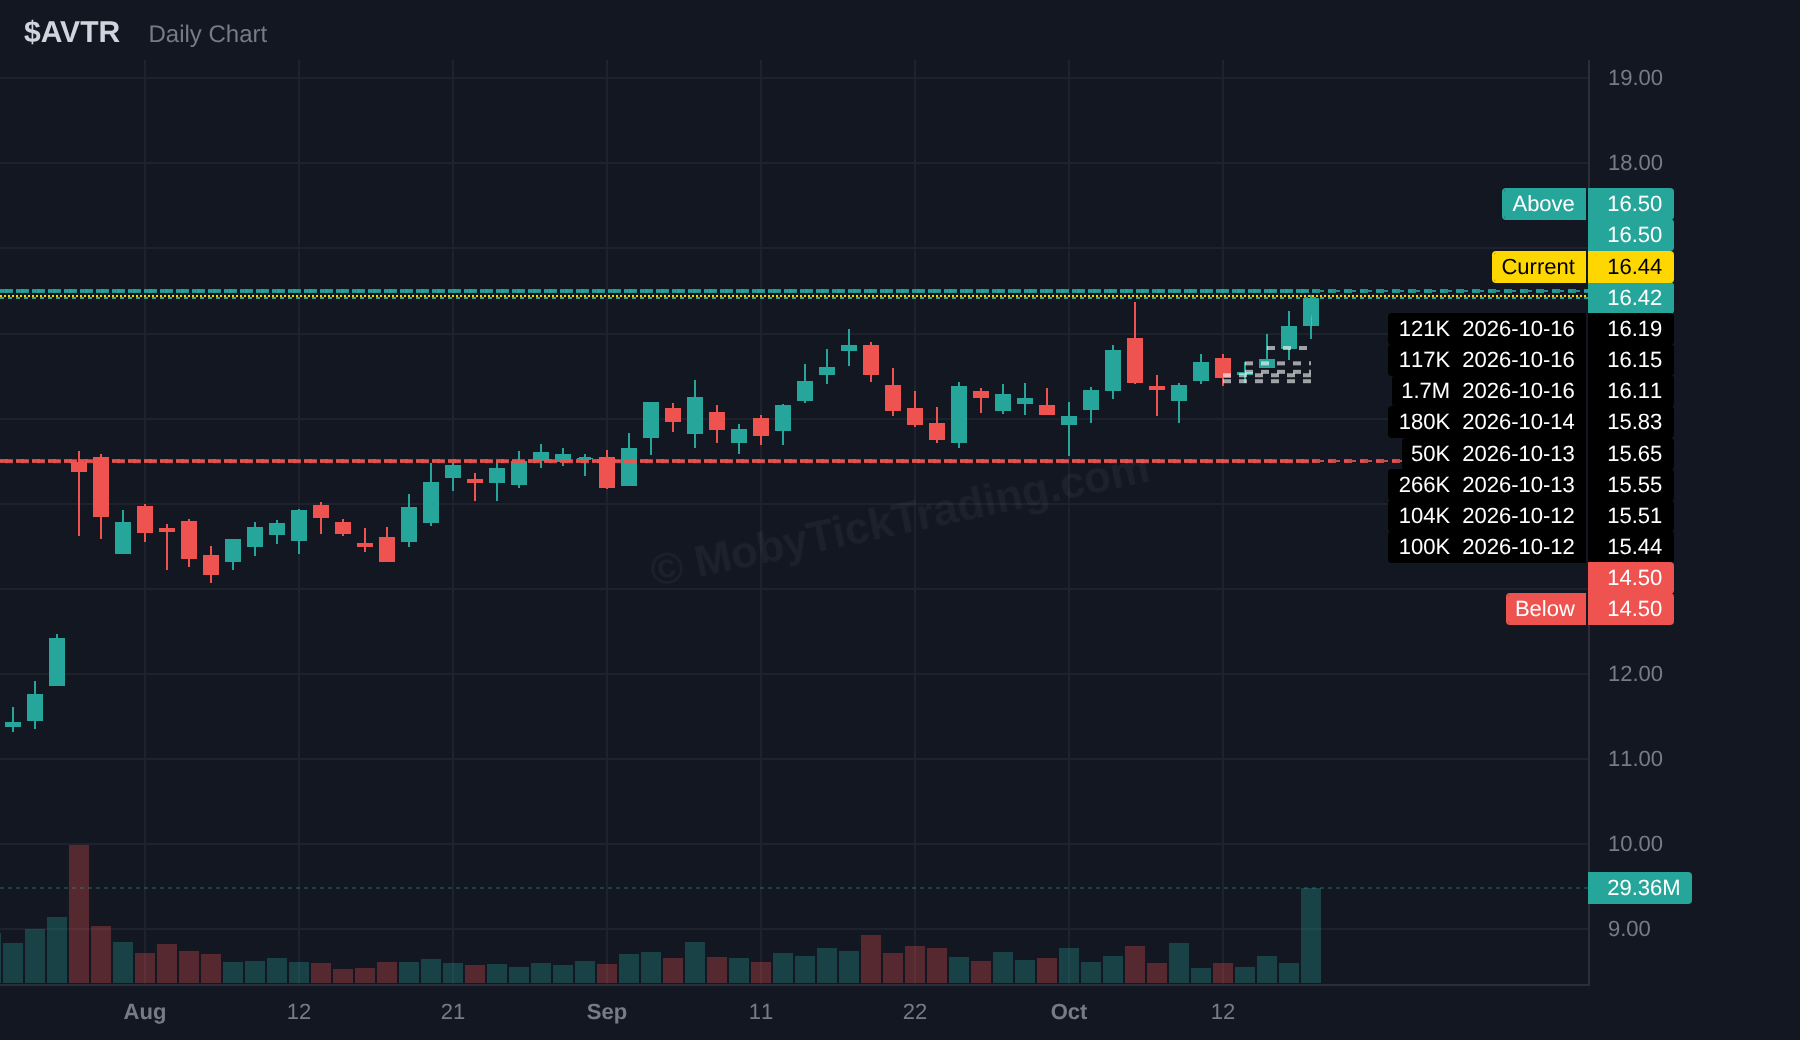
| AVTR | $16.5 | $17 → $17.5 → $18 → $18.5 → $19 → $20 | Wed Oct 28 · before open |
Lower Reference Levels
| Ticker | Lower Reference | Reference Levels | Earnings |
|---|---|---|---|
| SPY | $757 | $755 → $750 → $745 → $740 → $735 → $730 | — |
| QQQ | $700 | $695 → $690 → $685 → $680 → $675 → $670 | — |
| IWM | $270 | $267.5 → $265 → $262.5 → $260 → $257.5 → $255 | — |
| MDT | $93 | $92 → $90 → $88 → $87 | Not yet announced (est. Nov 18–27) |
| XLU | $41.25 | $40 → $39.62 → $39 → $38 → $37 | — |
| PBR | $25 | $24.5 → $24 → $23 → $22 → $21 | Tue Nov 10 · after close |
| TSLA | $350 | $345 → $340 → $330 → $325 → $320 | Wed Oct 21 · after close |
| MSFT | $524 | $520 → $513 → $510 → $501 | Wed Oct 28 · after close |
| WMT | $116 | $115 → $114 → $112 → $110 → $109 | Thu Nov 19 · before open |
| PG | $156 | $155 → $154 → $153 → $150 | Thu Oct 22 · before open |
| XLF | $53 | $52.5 → $52 → $51 → $50 | — |
| PLTR | $184 | $180 → $177.50 → $175 | Mon Nov 2 · after close |
| AVTR | $14.5 | $14 → $13.5 → $13 → $12.5 → $12 | Wed Oct 28 · before open |
This Week’s Reference Levels — Ticker Detail
Each card below shows dark pool flow data for the past week, along with reference levels for the upcoming week. Dark pool statistics are sourced from MobyTick’s proprietary analytics.
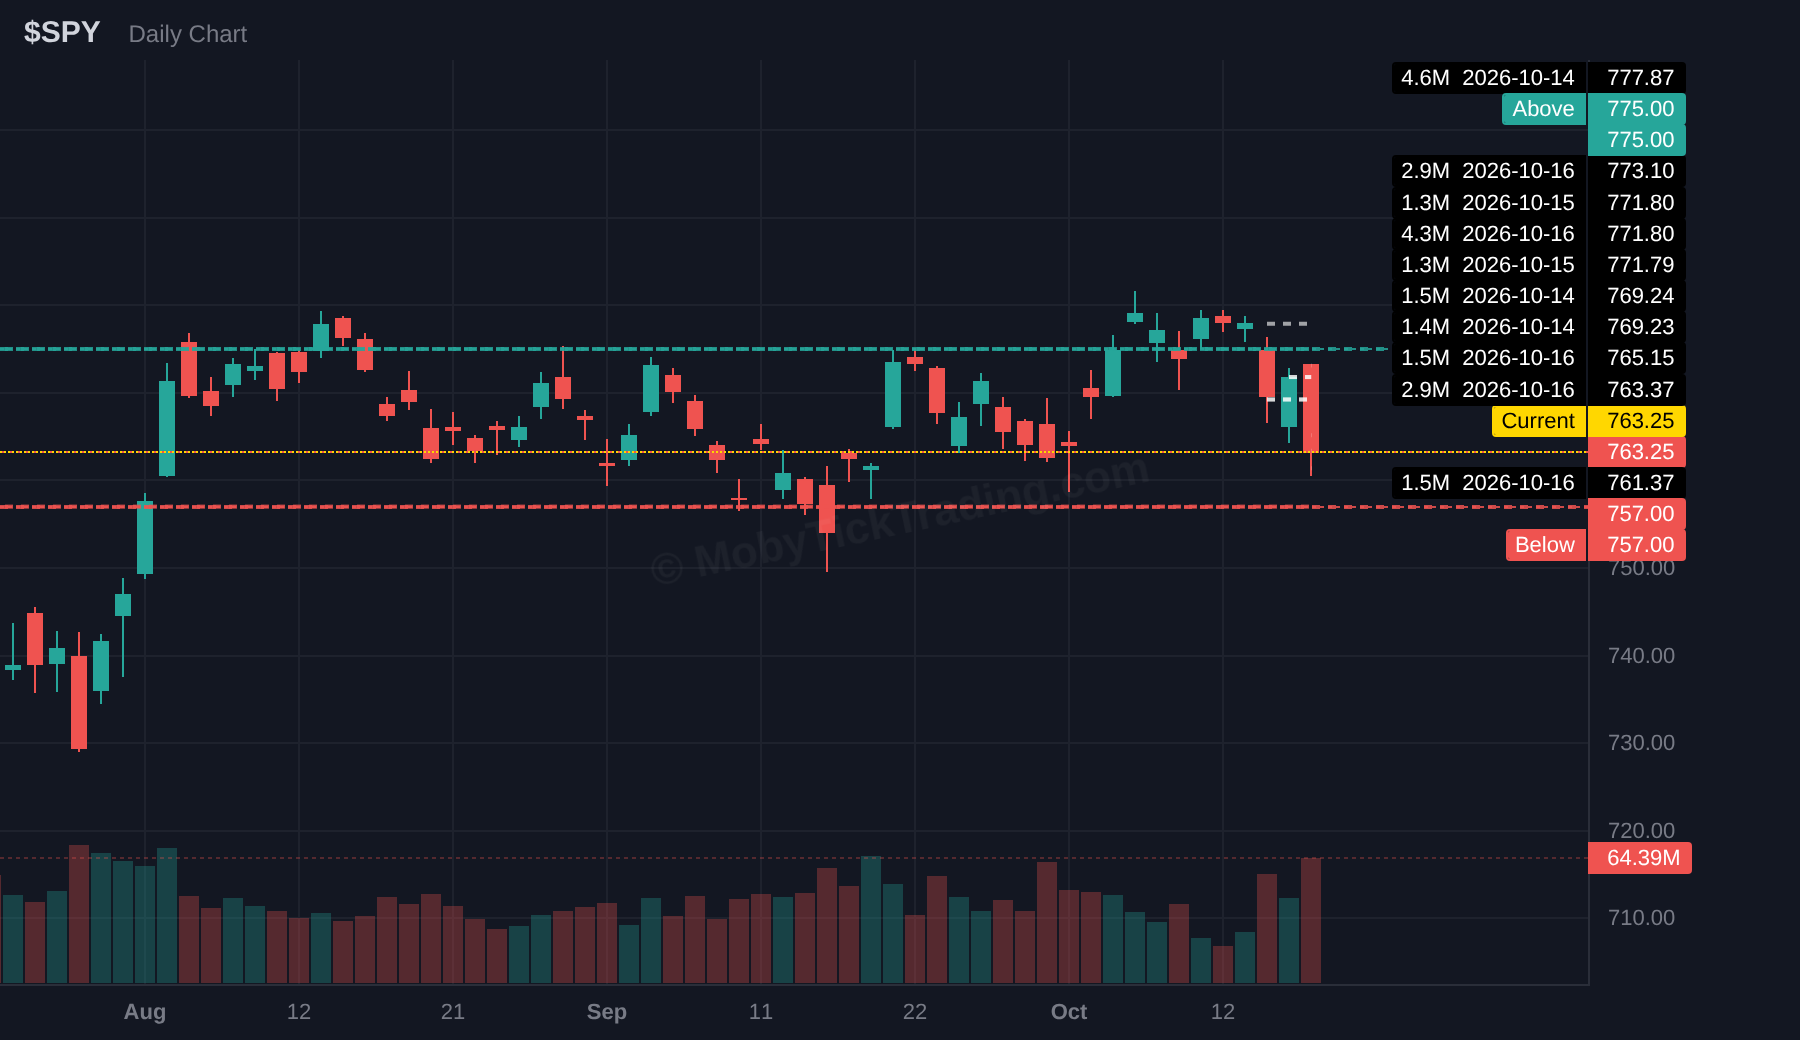
SPY
Upper reference $775 → $777.50 → $780 → $785 → $790 → $795 → $800
Lower reference $757 → $755 → $750 → $745 → $740 → $735 → $730
Earnings: —
QQQ
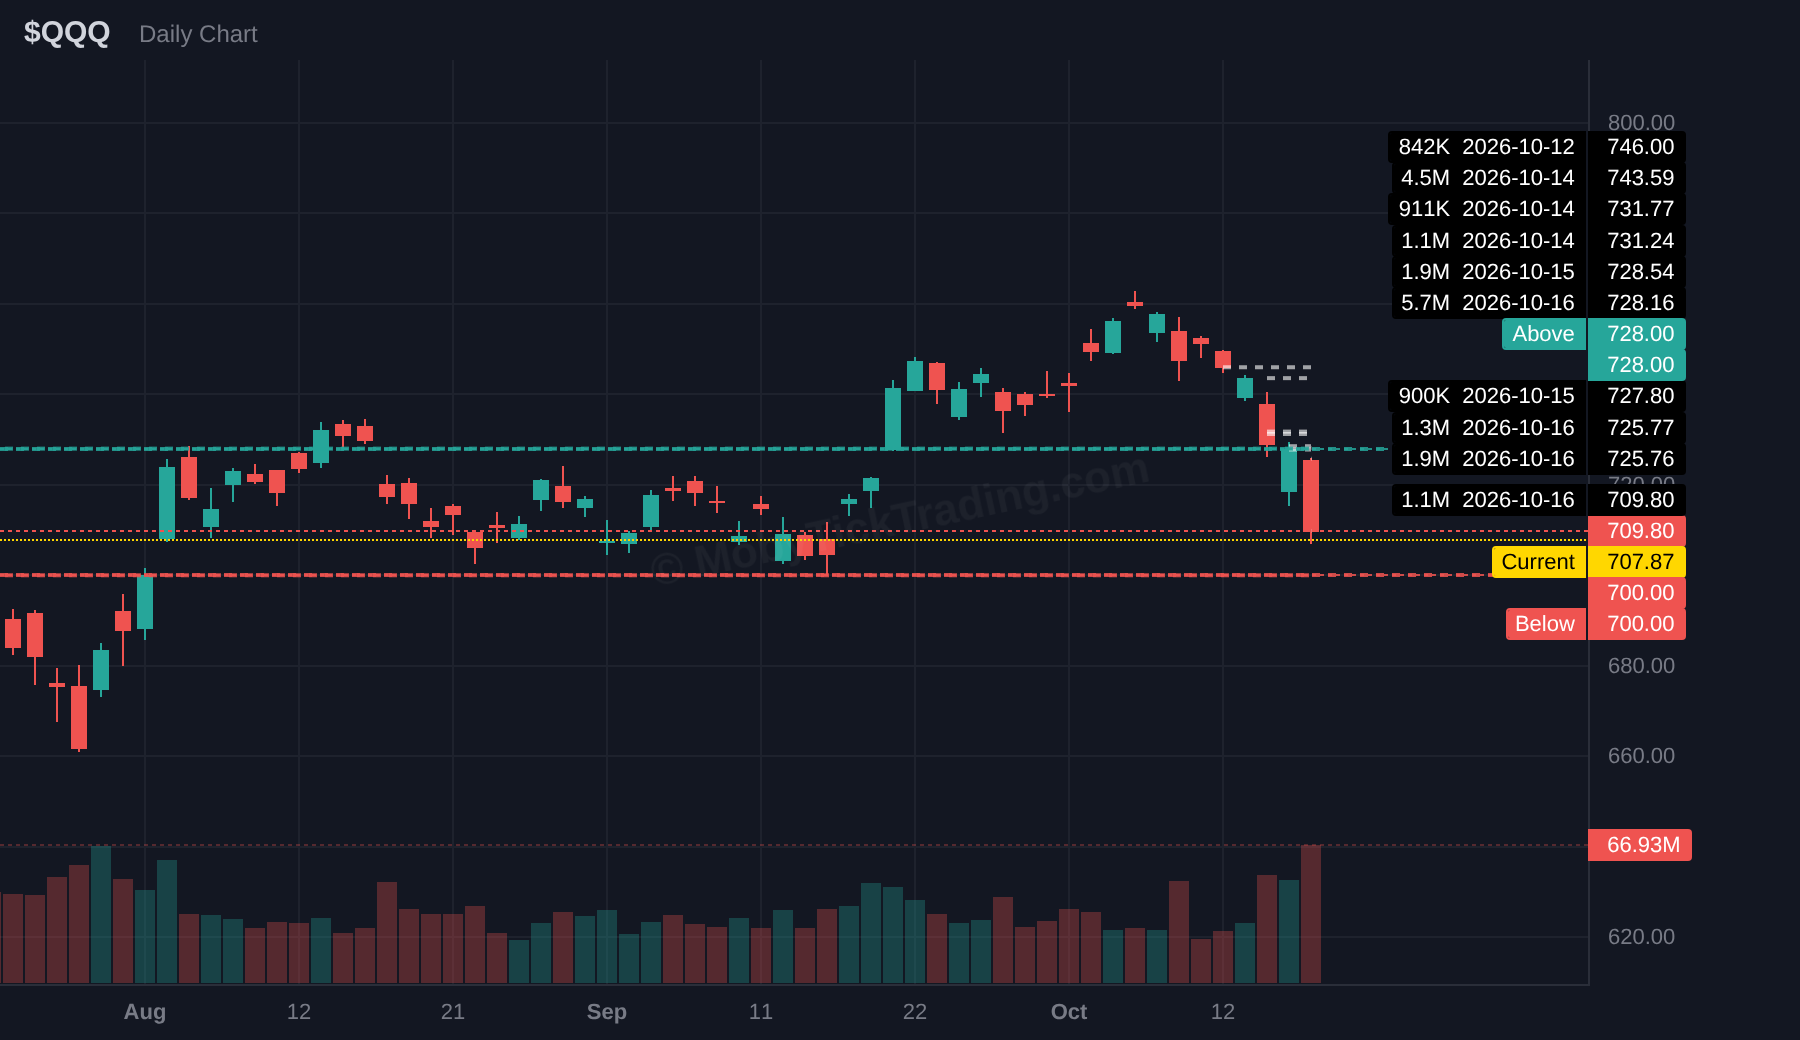
Upper reference $728 → $730 → $735 → $740 → $743.50 → $750 → $755
Lower reference $700 → $695 → $690 → $685 → $680 → $675 → $670
Earnings: —
IWM
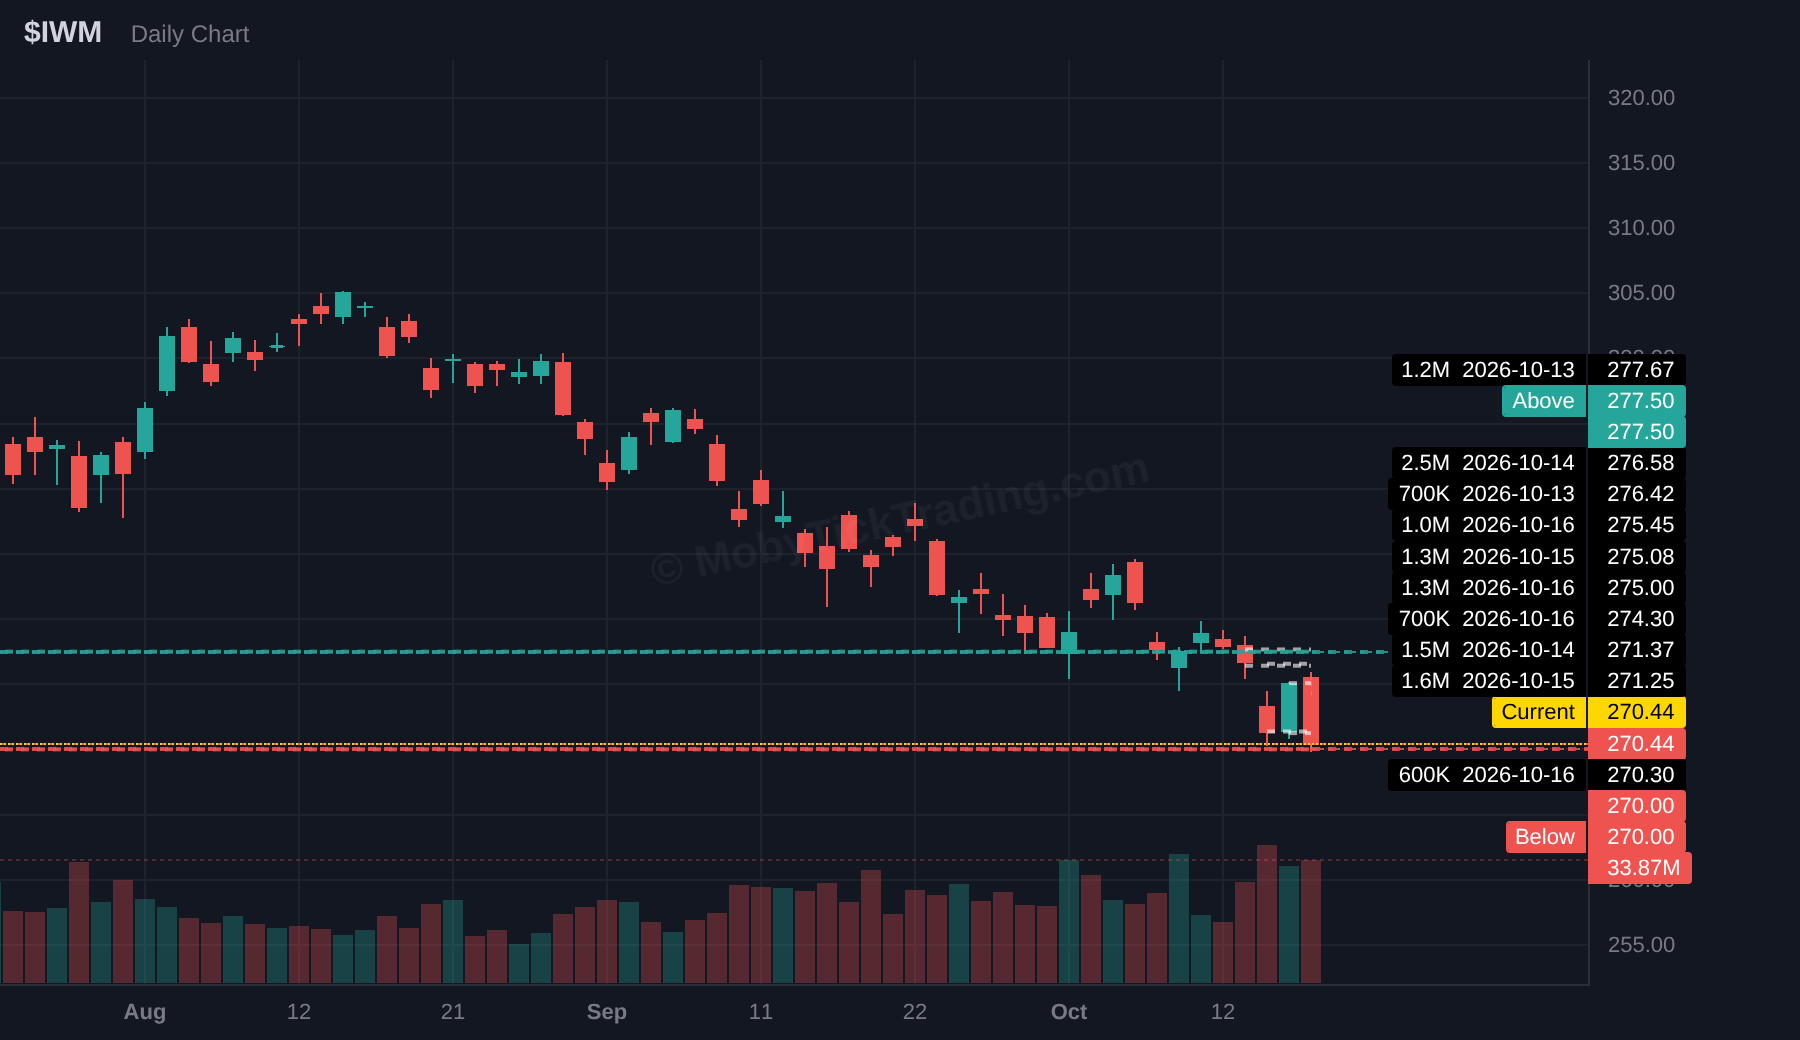
Upper reference $277.50 → $280 → $281.50 → $285 → $287.50 → $290
Lower reference $270 → $267.5 → $265 → $262.5 → $260 → $257.5 → $255
Earnings: —
MDT
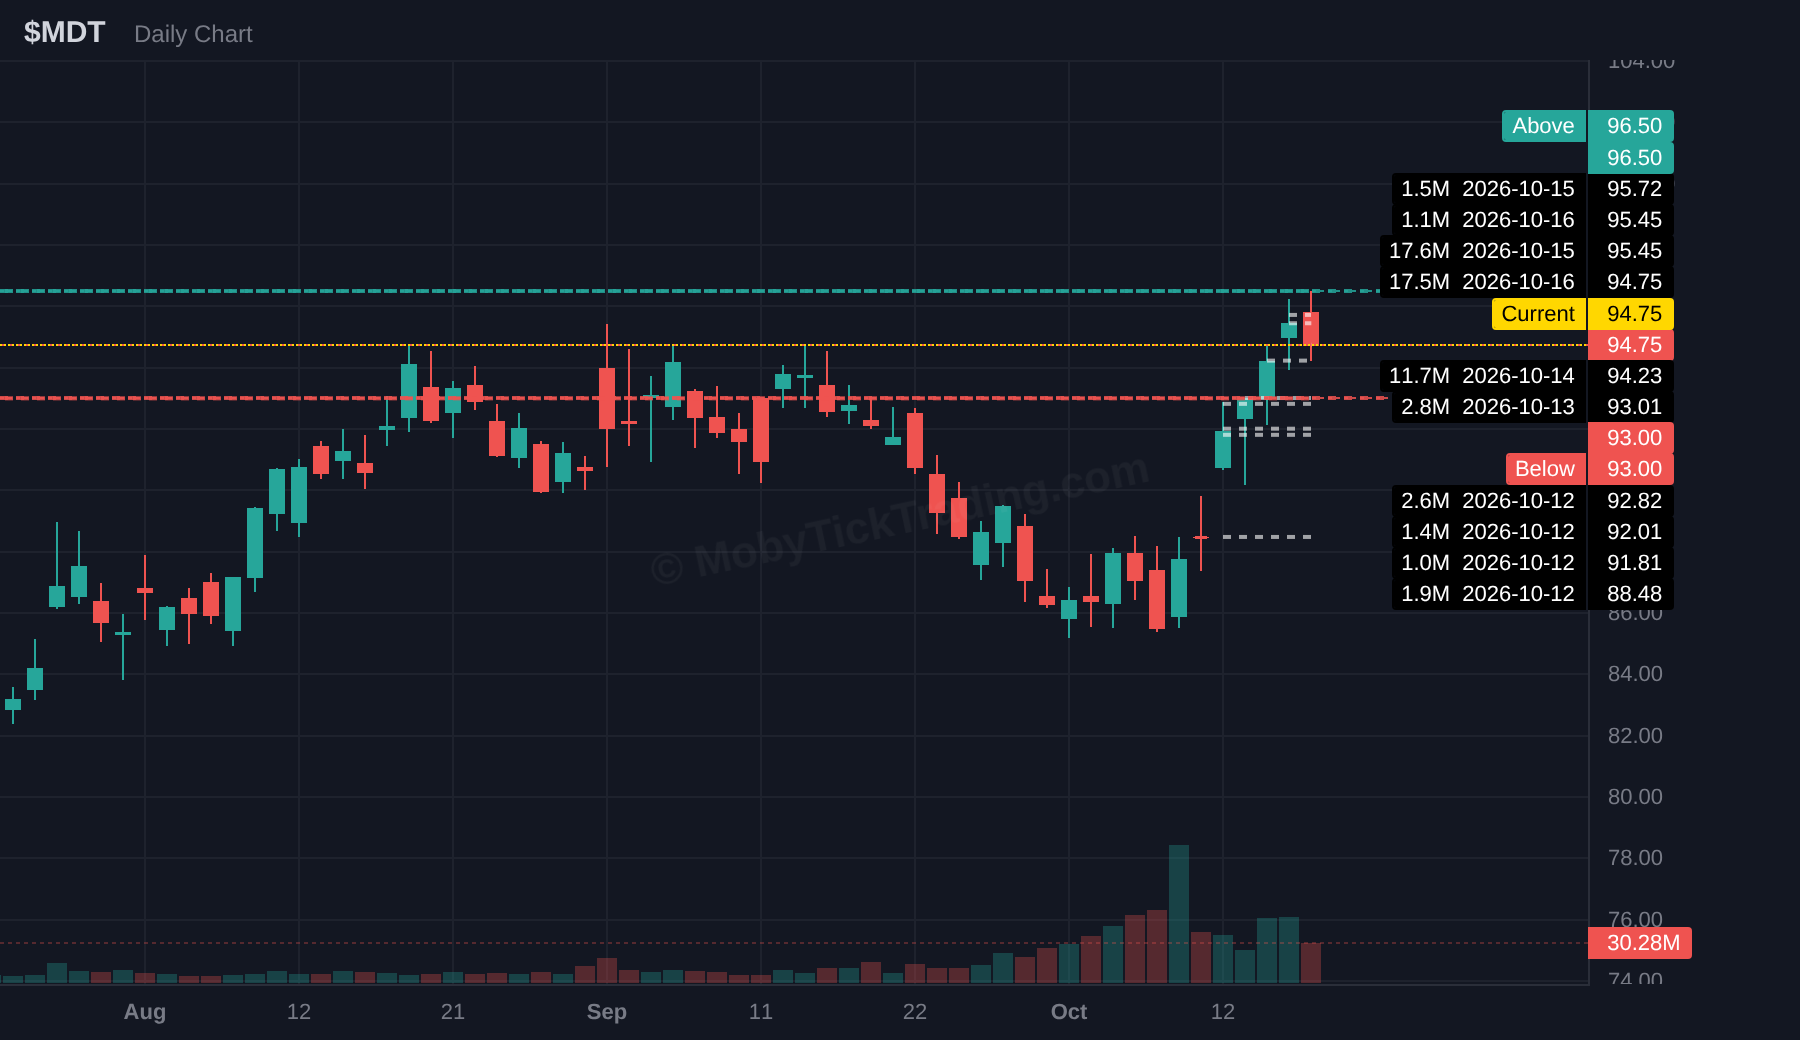
Upper reference $96.50 → $97.50 → $100 → $101.25 → $102.5 → $105 → $107.50
Lower reference $93 → $92 → $90 → $88 → $87
Earnings: Not yet announced (est. Nov 18–27)
XLU
Upper reference $42.50 → $43 → $43.5 → $44 → $44.5 → $45
Lower reference $41.25 → $40 → $39.62 → $39 → $38 → $37
Earnings: —
PBR
Upper reference $26.2 → $26.5 → $27 → $27.5 → $28 → $29 → $30
Lower reference $25 → $24.5 → $24 → $23 → $22 → $21
Earnings: Tue Nov 10 · after close
TSLA
Upper reference $371.25 → $375 → $380 → $390 → $400
Lower reference $350 → $345 → $340 → $330 → $325 → $320
Earnings: Wed Oct 21 · after close
MSFT
Upper reference $545 → $550 → $560 → $570 → $575 → $580
Lower reference $524 → $520 → $513 → $510 → $501
Earnings: Wed Oct 28 · after close
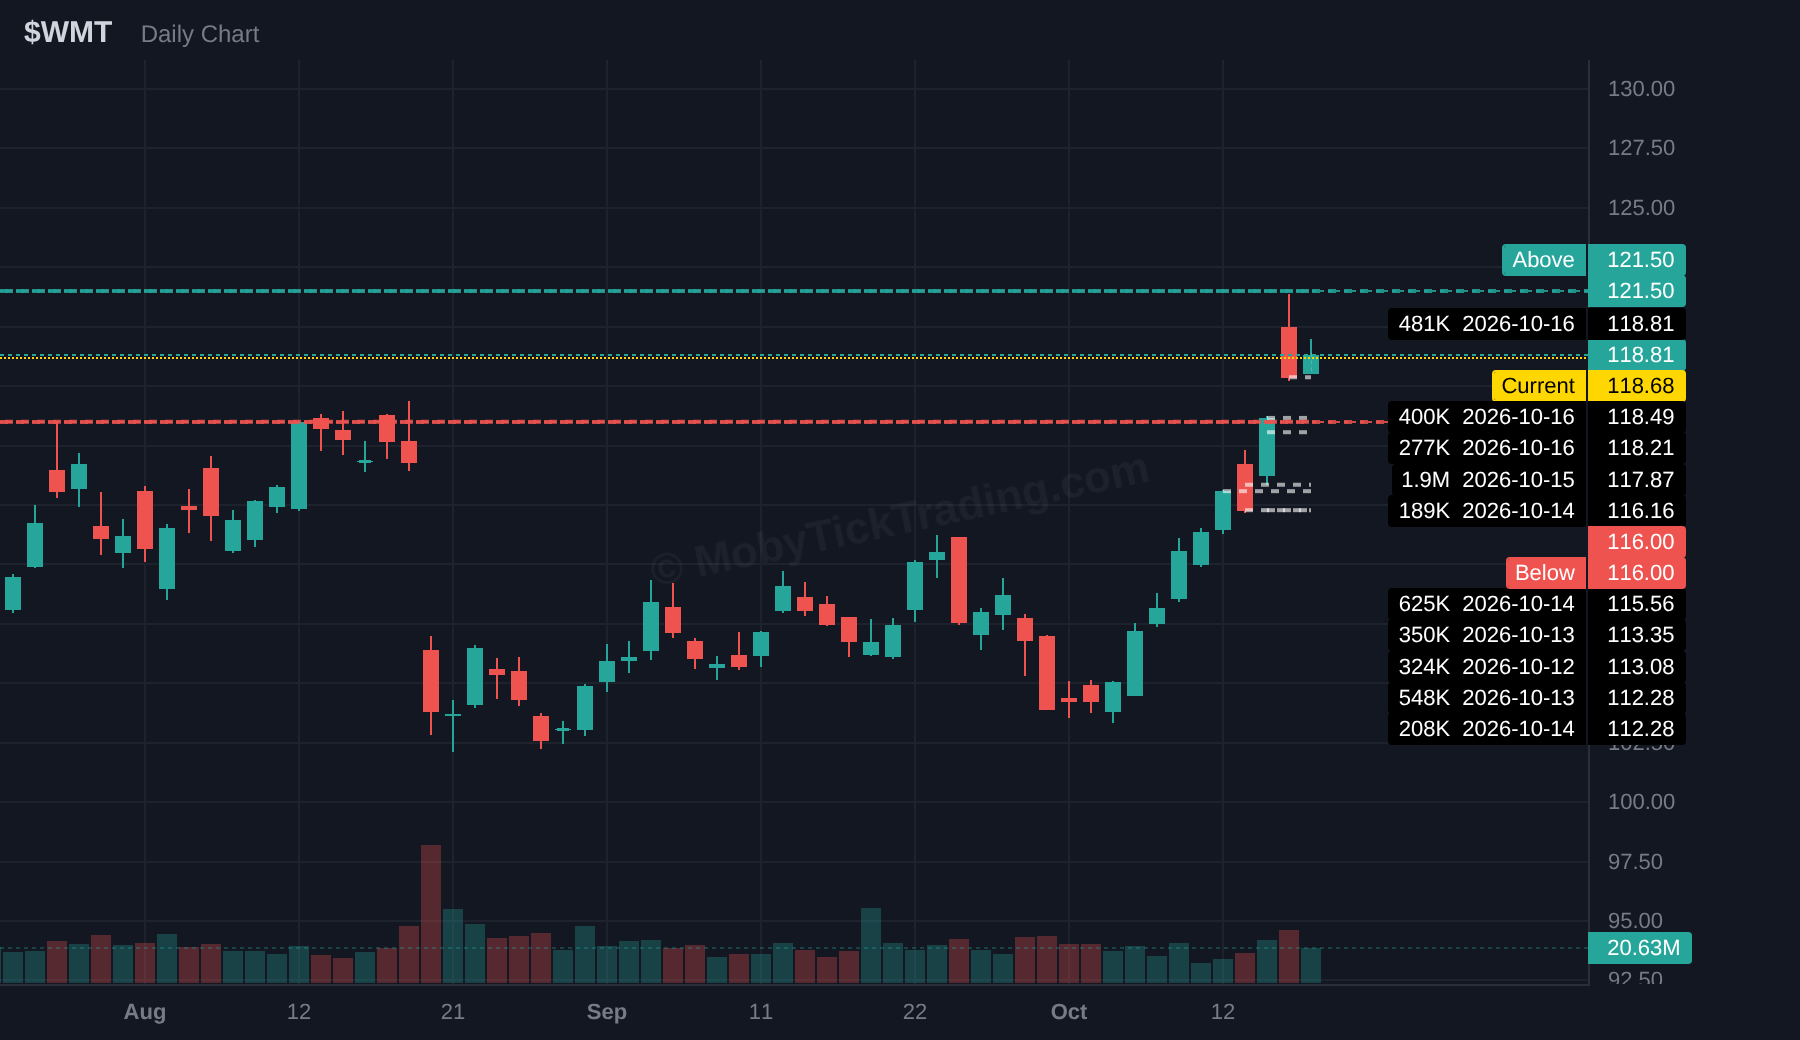
WMT
Upper reference $121.5 → $122.5 → $124 → $125 → $126.25 → $127.5 → $130
Lower reference $116 → $115 → $114 → $112 → $110 → $109
Earnings: Thu Nov 19 · before open
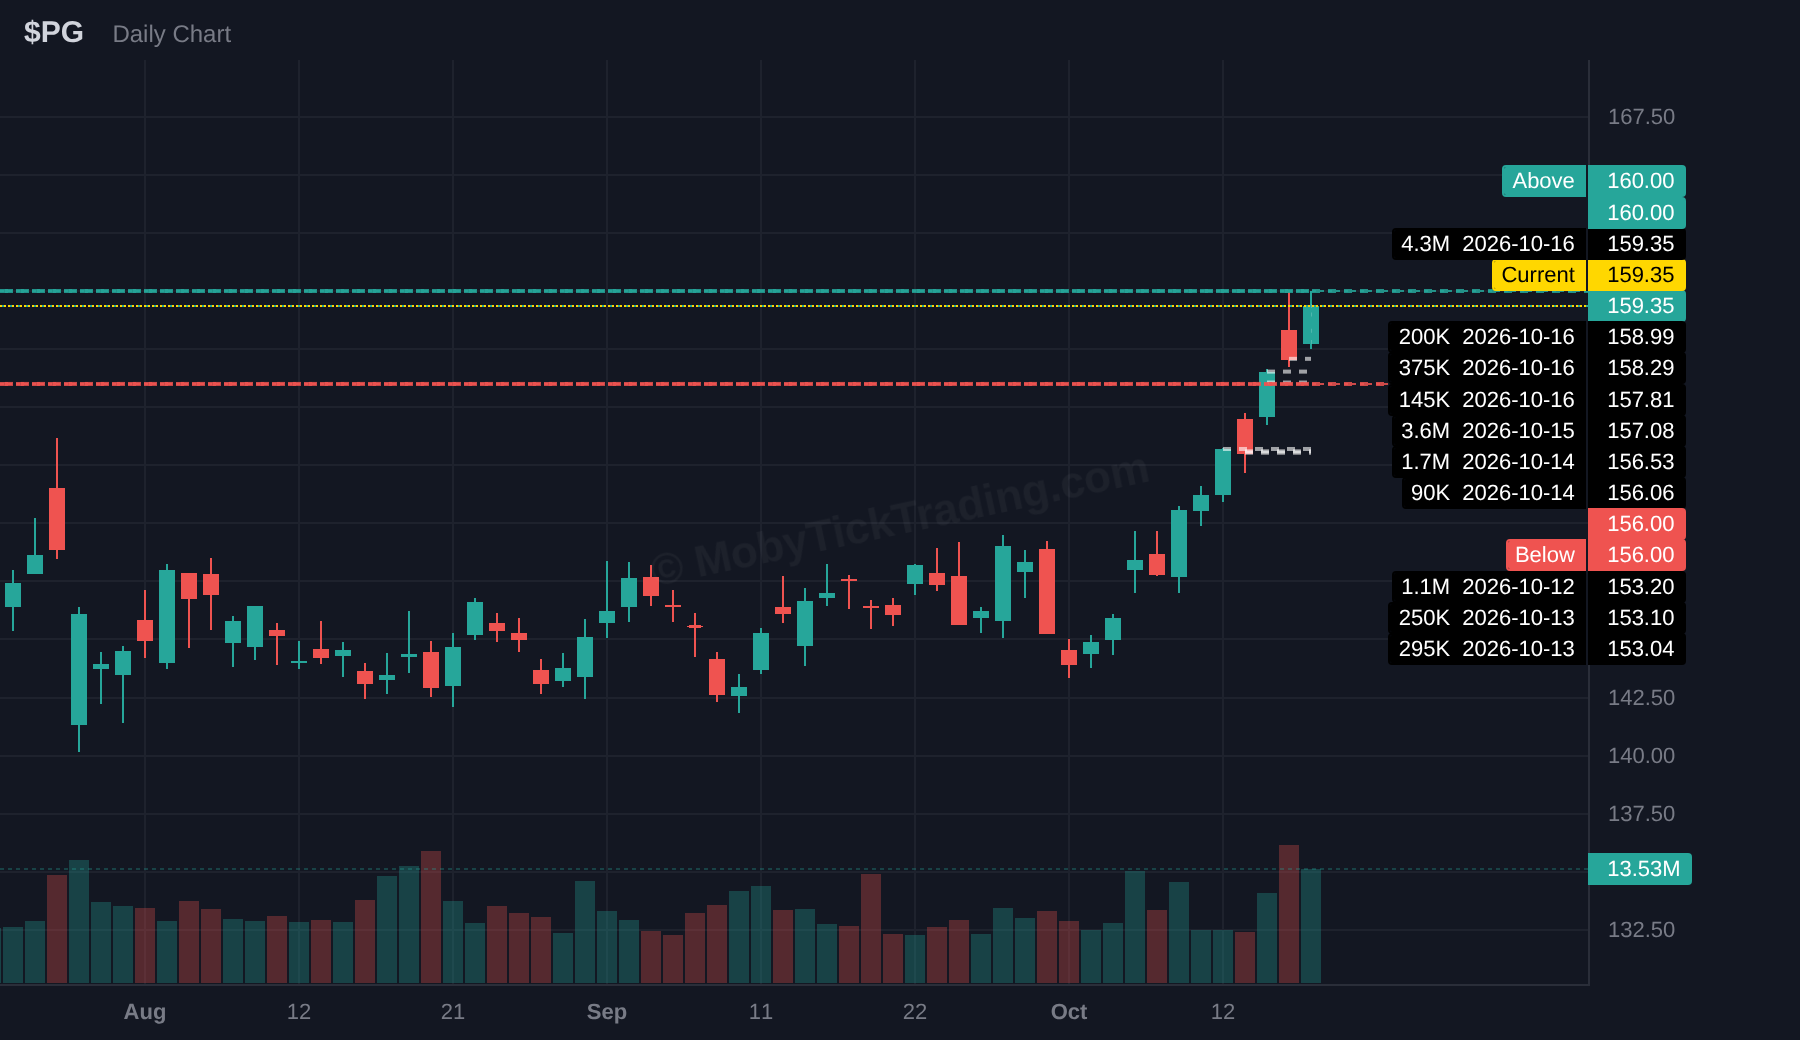
PG
Upper reference $160 → $161.25 → $162.5 → $164 → $165 → $167.50 → $170
Lower reference $156 → $155 → $154 → $153 → $150
Earnings: Thu Oct 22 · before open
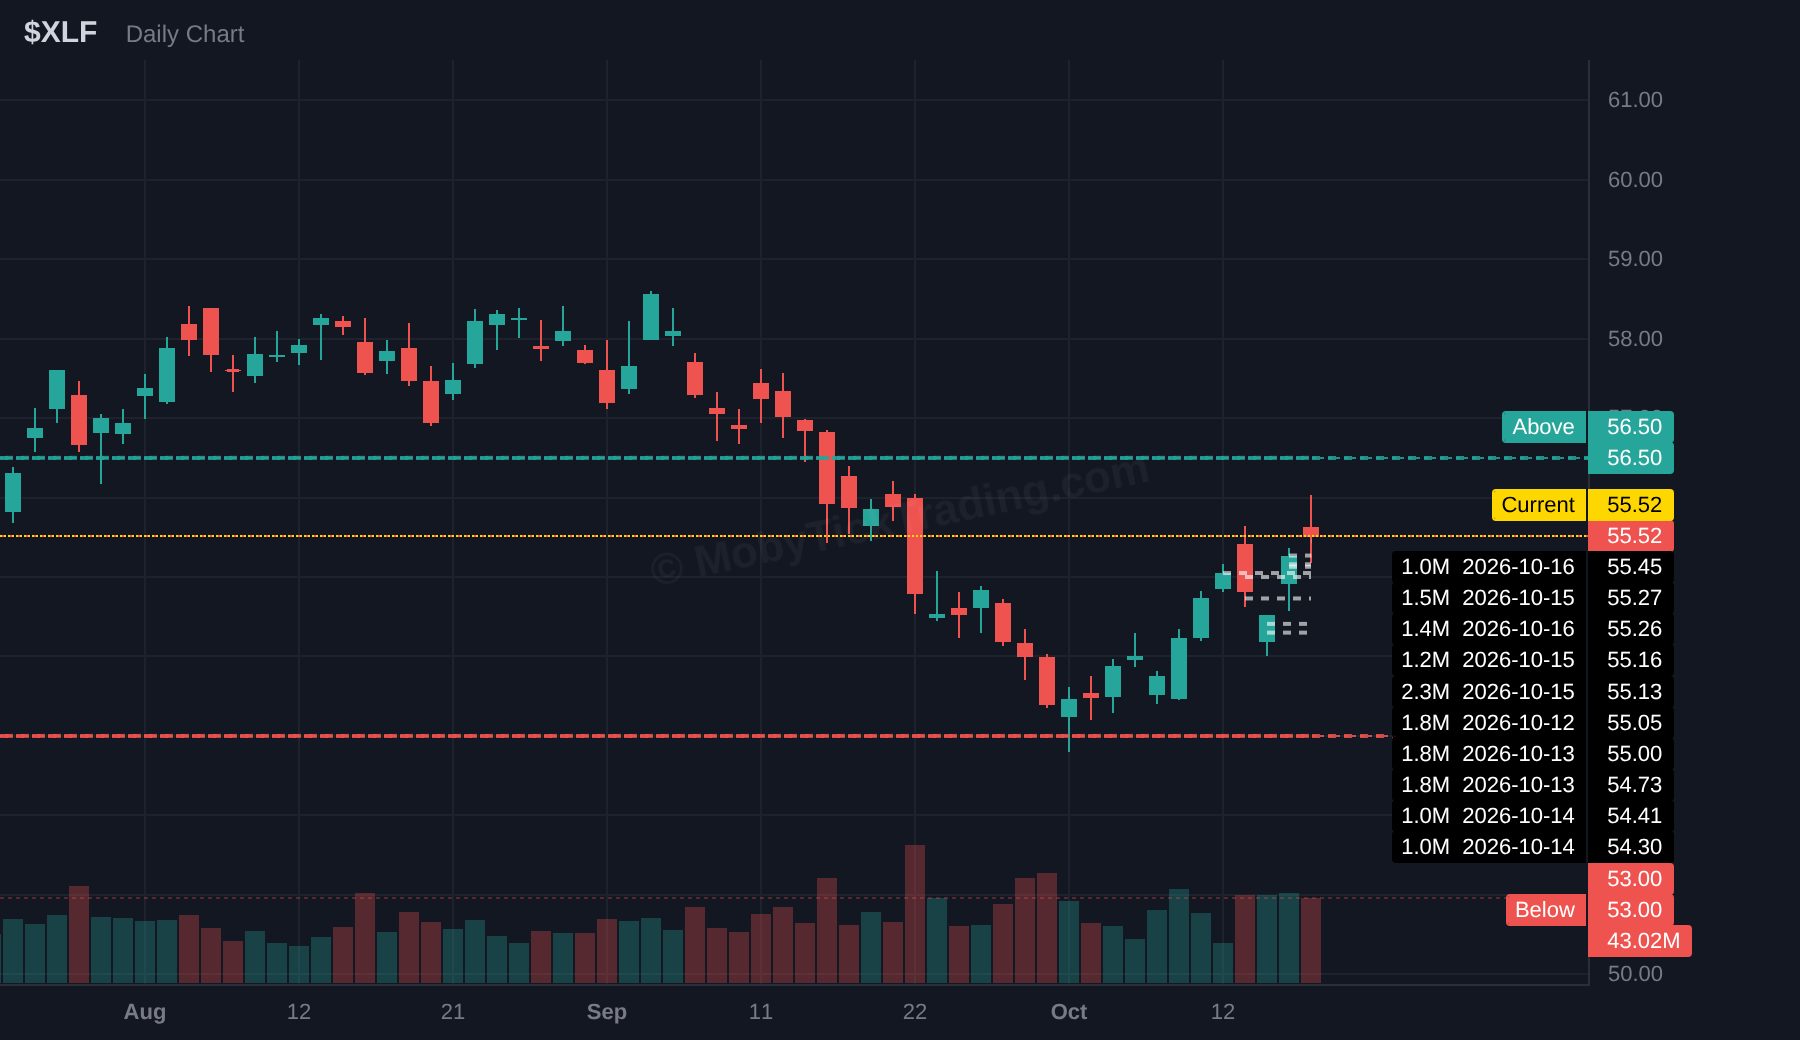
XLF
Upper reference $56.5 → $57 → $57.25 → $58 → $58.50
Lower reference $53 → $52.5 → $52 → $51 → $50
Earnings: —
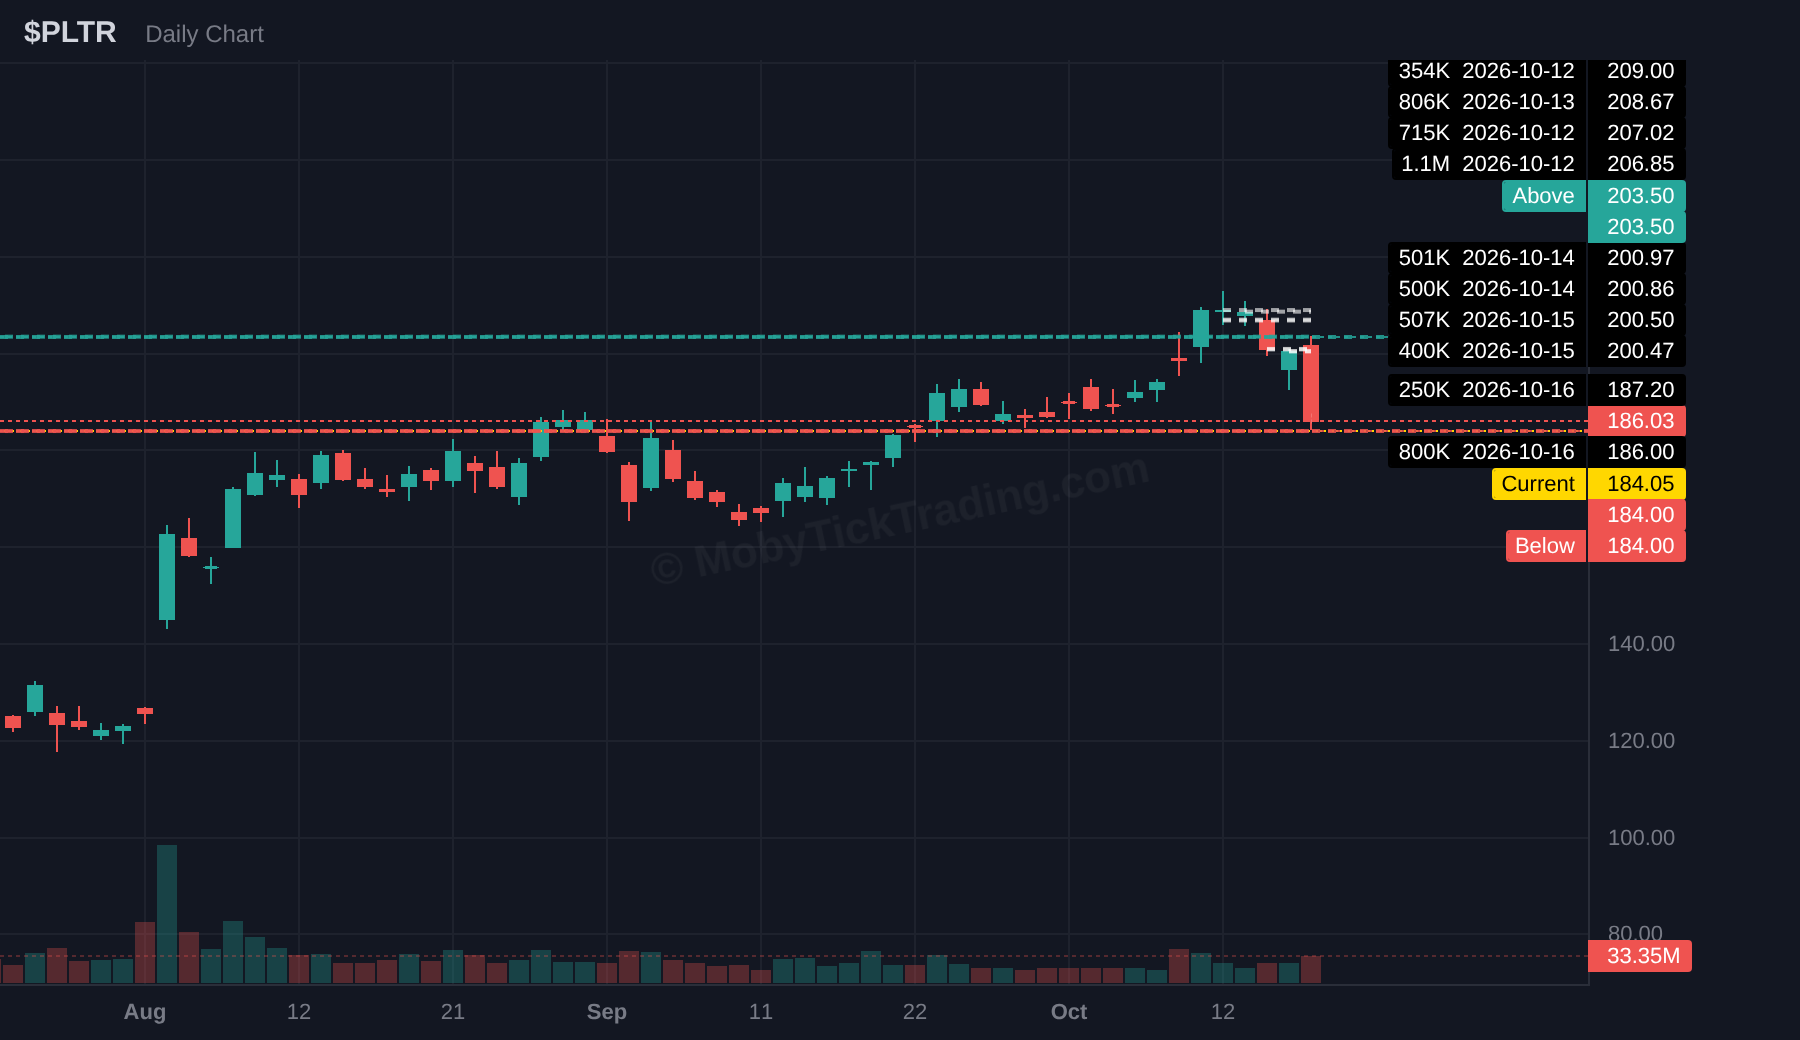
PLTR
Upper reference $203.5 → $205 → $207.5 → $210 → $212.5 → $215 → $220
Lower reference $184 → $180 → $177.50 → $175
Earnings: Mon Nov 2 · after close
AVTR
Upper reference $16.5 → $17 → $17.5 → $18 → $18.5 → $19 → $20
Lower reference $14.5 → $14 → $13.5 → $13 → $12.5 → $12
Earnings: Wed Oct 28 · before open
ETF Dark Pool Flow
For the week of Mon Oct 12 to Fri Oct 16, 2026, MobyTick dark pool data put $96.33B through the broad-market, sector and macro ETF basket. SPY and QQQ alone accounted for $64.94B, two thirds of the total.
Broad-Market ETFs
| ETF | Notional | Shares | Levels | Week % |
|---|---|---|---|---|
| SPY | $32.28B | 41.88M | 68 | -1.97% |
| QQQ | $32.66B | 44.78M | 133 | -5.52% |
| IWM | $7.15B | 26.09M | 99 | -3.05% |
| IVV | $5.17B | 6.67M | 17 | -1.96% |
| VOO | $3.70B | 5.21M | 15 | -1.95% |
| DIA | $1.12B | 2.16M | 10 | +0.58% |
QQQ carried the largest notional of any ETF at $32.66B on 44.78M shares across 133 levels, 1.37× its 30-day average volume. SPY was second at $32.28B on 41.88M shares and 68 levels, 0.98× ADV. IWM printed $7.15B on 26.09M shares and 99 levels, 1.10× ADV. The six broad-market ETFs together carried $82.08B, with SPY, QQQ and IWM accounting for $72.09B of that.
QQQ logged 133 price levels this week against 68 for SPY. SPY traded a 2.5% weekly range and QQQ 6.0%.
| Session | Notional | Shares |
|---|---|---|
| Mon Oct 12 | $6.81B | 21.36M |
| Tue Oct 13 | $11.63B | 29.97M |
| Wed Oct 14 | $22.20B | 55.00M |
| Thu Oct 15 | $16.16B | 46.35M |
| Fri Oct 16 | $39.53B | 91.70M |
Friday Oct 16, the monthly options expiration, carried $39.53B, or 41% of the week’s basket notional, on 91.70M shares. Monday Oct 12 was the lightest session at $6.81B. Notional rose every session after Monday.
Sector Rotation
| ETF | Sector | Notional | Shares | Levels | Week % |
|---|---|---|---|---|---|
| SMH | Semiconductors | $2.90B | 5.21M | 26 | -10.53% |
| XLF | Financials | $1.73B | 31.49M | 75 | +1.44% |
| XLY | Consumer Discretionary | $0.70B | 6.26M | 17 | -0.35% |
| XLI | Industrials | $0.59B | 3.50M | 13 | -0.88% |
| XLP | Consumer Staples | $0.54B | 6.25M | 29 | +5.02% |
| XLV | Health Care | $0.52B | 2.99M | 18 | +3.45% |
| XLC | Communication Services | $0.46B | 4.11M | 17 | -0.05% |
| XLE | Energy | $0.45B | 6.72M | 34 | +4.86% |
| XLU | Utilities | $0.33B | 7.89M | 37 | +1.93% |
| XLB | Materials | $0.18B | 3.59M | 15 | +3.01% |
| XLRE | Real Estate | $0.18B | 4.38M | 15 | +1.32% |
| XRT | Retail | $0.05B | 0.61M | 2 | +3.48% |
Semiconductors carried the largest sector notional at $2.90B and fell 10.53% on the week. Financials printed $1.73B across 75 levels, the most levels of any sector ETF, and gained 1.44%. Consumer staples, energy, health care, materials and utilities all finished higher, while technology-linked sectors were lower. The twelve sector ETFs together carried $8.64B.
Macro and Other ETFs
| ETF | Notional | Shares | Levels | Week % |
|---|---|---|---|---|
| EWY | $1.71B | 10.87M | 28 | -15.12% |
| GLD | $1.58B | 4.16M | 25 | -0.67% |
| RSP | $0.85B | 3.96M | 28 | +0.49% |
| IGV | $0.64B | 6.01M | 19 | -7.39% |
| XBI | $0.44B | 2.94M | 12 | -6.15% |
| IBIT | $0.30B | 6.53M | 36 | -0.86% |
| MDY | $0.10B | 0.15M | 2 | -1.49% |
EWY, the South Korea ETF, printed $1.71B and fell 15.12%, the largest decline in the basket. Software (IGV) fell 7.39% on $0.64B. Equal-weight S&P 500 (RSP) was positive at +0.49% while the cap-weighted SPY fell 1.97%.
Data sourced from MobyTick. Dark pool figures include prints of 50,000 shares or more with opening and closing auction activity excluded.
When the Market Changes Its Mind: Reading a Regime Shift Through Late Prints and Dealer Hedging
*Dark Pool Weekly Report — Education Section · Week ending October 16, 2026*
The week in one paragraph
QQQ closed last Friday (Oct 9) at $751.27. This Friday it closed at $709.80 — a $41.47 drop (−5.5%) in five sessions, and nearly 7% off the October 6 high. The selling was not evenly spread across the market, either:
| ETF | Oct 9 close | Oct 16 close | Week |
|---|---|---|---|
| QQQ (Nasdaq-100) | $751.27 | $709.80 | −5.5% |
| IWM (Russell 2000) | $278.94 | $270.44 | −3.0% |
| SPY (S&P 500) | $778.57 | $763.25 | −2.0% |
| DIA (Dow 30) | $516.11 | $519.10 | +0.6% |
Tech led the decline while the Dow actually finished green. At the same time, the VIX jumped from 14.84 to 19.99 (touching 22.31 intraday Friday), and QQQ’s late prints came in heavy on Wednesday and Friday.
When a market that has been calmly grinding higher suddenly starts swinging $14–$19 a day, the question isn’t just “is this a pullback?” It’s “have the rules of the game changed?” That’s what traders mean by a *market regime*.
What is a market regime?
A regime is the market’s current *personality* — the set of conditions that decides which strategies work and which ones bleed. The simplest way to map it uses two dials:
- Direction — trending up, trending down, or ranging
- Volatility — calm (small daily ranges) or volatile (wide daily ranges)
| **Calm** | **Volatile** | |
|---|---|---|
| Trending up | Buy-the-dip works; tight stops survive; breakouts follow through | Big up days, big down days; strong but sloppy |
| Ranging | Fade the edges; mean reversion; options premium decays nicely | Whipsaw; stops get run both ways |
| Trending down | Slow bleed; rallies get sold | Momentum selling; dips keep dipping; ranges expand |
From April to early October, QQQ lived in the top-left box — a calm uptrend that carried it from roughly $584 to $760. In that environment, dips were bought, ranges stayed tight, and support levels held.
This is the core idea from our options video *”Why the Same Setup Wins Monday and Fails Tuesday”*: a setup doesn’t fail because the pattern was wrong — it fails because the regime changed underneath it.
The hidden engine: dealer gamma
Why do regimes feel so different? A big part of the answer is how options dealers hedge.
Dealers (market makers) take the other side of customer options trades, then hedge with shares so they stay delta-neutral — they don’t want to bet on direction. How they hedge depends on whether they’re net *long* or net *short* options:
When dealers are net long options (positive gamma):
- Price falls → their position gets shorter → they buy to rebalance
- Price rises → their position gets longer → they sell to rebalance
- Result: dealers lean *against* the move. Ranges compress. Dips get absorbed. This is the calm-uptrend environment.
When dealers are net short options (negative gamma):
- Price falls → their position gets longer → they sell to rebalance
- Price rises → their position gets shorter → they buy to rebalance
- Result: dealers trade *with* the move. Ranges expand. Selling begets selling.
The flip point between those two states is the gamma flip — the level you can see on Moby Tick’s GEX window and on-chart options levels.
Right now, QQQ’s gamma flip sits at $728.46 — and QQQ closed Friday at $709.80, more than $18 below it. That puts QQQ firmly in negative-gamma territory, which lines up with exactly what we saw this week: wider ranges, heavier volume and selling that fed on itself.
A real example from Friday
At 3:47 p.m. ET Friday, Moby Tick’s options flow caught a buyer taking 110,647 QQQ $700 puts expiring October 30 — $111 million in premium, filled above the ask. A few minutes earlier another trade bought 40,000 of the $690 puts for the same date ($27.6M).
When a customer *buys* puts aggressively like that, the dealer on the other side is typically *short* those puts. Here’s the rough hedging math (illustrative only — real dealer books are netted across many positions):
- 110,647 contracts × 100 shares = about 11.1 million shares of exposure
- With QQQ at $709.80 and two weeks to expiry, a $700 put has a delta of roughly −0.37
- The short-put dealer is effectively *long* ~4 million shares of delta, so they hedge by shorting ~4 million QQQ shares
- If QQQ slides to $700, that put’s delta moves toward −0.50 — and the dealer must sell roughly another 1.4 million shares to stay neutral
That’s the negative-gamma mechanism in action: the further price falls toward the strike, the more the hedge forces dealers to sell. Nobody has to have an opinion — the math does the selling.
Friday’s flow wasn’t one-sided (there was put selling too, including some sizable trades), but the biggest premium of the day was clearly defensive put buying.
What the late prints told us
Late prints are institutional trades that are reported late — sometimes hours after they were actually executed. They can hit the tape during the trading day and continue through the post-market session, which is why a late print’s price often doesn’t match where the stock is trading when it appears. Here’s what QQQ printed this week:
| Date | Late print price | # Trades | Shares | Value | QQQ close that day |
|---|---|---|---|---|---|
| Mon Oct 12 | $751.22 | 5 | 519K | $390M | $746.04 |
| Tue Oct 13 | $743.48 | 1 | 129K | $96M | $743.57 |
| Wed Oct 14 | $743.59 | 42 | 4.50M | $3.35B | $728.95 |
| Thu Oct 15 | $728.54 | 18 | 1.87M | $1.36B | $728.00 |
| Fri Oct 16 | $728.16 | 52 | 5.71M | $4.15B | $709.80 |
Three things stand out:
1. Size. Friday’s $4.15B was the largest QQQ late print of the past two months, and Wednesday’s $3.35B wasn’t far behind. Combined, the week printed about $9.3B versus $7.6B the week before.
2. Price — look where they sit. Because late prints are reported after the fact, their prices reflect where the trade was actually done — not where QQQ was when the print showed up. This week, each one landed almost exactly at the *previous* session’s close (Wednesday’s $743.59 vs. Tuesday’s $743.57 close; Friday’s $728.16 vs. Thursday’s $728.00 close). These are institutional trades anchored to where the market *was*, not where it ended up. The practical takeaway: billions of dollars changed hands at $743 and $728, and price is now trading below both. Those levels become overhead — where anyone who bought is underwater and may be happy to get out at even.
3. Divergence. QQQ’s late prints were heavy while DIA was quiet and the Dow finished green. That looks more like *rotation out of tech* than a market-wide panic — an important distinction for deciding how defensive to get.
Important caveat: size isn’t direction
Friday was monthly options expiration, and OpEx days and quarter-end windows routinely carry oversized prints from rebalancing and hedge adjustments. (SPY’s 15.3 million-share, $11.65B late print on September 18 — quarterly OpEx — is a good example.) A big print tells you *where* institutions transacted, not *which way* they’re leaning.
Also remember the “splash”: after a large print, price often moves in the *opposite* direction for a few days before the real move shows itself. Big prints are levels to watch, not signals to chase.
The regime scorecard: where are we now?
Rather than guessing, score the evidence. Here’s how QQQ looks heading into next week:
| Signal | Calm uptrend reading | This week | Leaning |
|---|---|---|---|
| Price vs. moving averages | Above 20- and 50-day | Closed $709.80, below the 20-day ($742.52) and 50-day ($726.77) | ⚠️ Shift |
| Daily range | Near average | $14.14, $14.00, then $18.73 — about 2× the ~$8 average, largest of the past 30 sessions | ⚠️ Shift |
| Volume | Near average | 66.9M Friday vs. 36.0M 20-day average (~1.9×) | ⚠️ Shift |
| VIX | Mid-teens | 14.84 → 19.99 (22.31 intraday) | ⚠️ Shift |
| Options flow | Balanced / call-heavy | Largest premium = aggressive put buying | ⚠️ Shift |
| Late prints | Supportive, below price | Large prints at $743 and $728, above price | ⚠️ Shift |
| Gamma flip | Price above the flip | Flip at $728.46; QQQ closed $18 below it | ⚠️ Shift |
Seven for seven leaning toward a regime change. But note the word *leaning*. One week of evidence says the calm uptrend is over; it does not yet prove a new downtrend. Right now QQQ is best described as transitioning into a volatile regime.
What would confirm a downtrend: a bounce that fails below the $728–$730 zone, followed by a lower low.
What would invalidate it: a reclaim of $728–$730 on increasing volume, putting price back above the gamma flip, the 50-day and the heaviest recent prints.
Map both sides — no bias
As always, we map a bullish level above and a bearish level below:
🟢 Bullish above: $728–$730
- Friday’s $4.0B late-print level at $728.16
- August 18’s $3.8B level at $729.78
- The gamma flip at $728.46 sits right inside this band. About $7.8B of institutional volume, the gamma flip and the 50-day average ($726.77) are all stacked in one zone. That’s the confluence we look for: when dark pool levels and options levels agree, the level matters more. A reclaim here would put dealers back on the stabilizing side.
🔴 Bearish below: $700
- August 4’s $5.4B level at $700.05 (the second-largest QQQ level since July)
- A major round number on the price grid
- The same strike as Friday’s $111M put buy — dealer hedging pressure is likely to intensify as price approaches it
Below that: a cluster at $682–$688 (roughly $9.5B across three levels from late July and early August), then $661.48 — the single largest QQQ level since July at $6.8B.
How to adjust your playbook in a volatile regime
- Size down, automatically. If you size positions from your risk budget ÷ stop distance, wider ranges mean wider stops — which means fewer shares for the same dollar risk. The math protects you if you let it.
- Stop fading big moves. In a negative-gamma environment, “it’s down a lot, it has to bounce” is how accounts get hurt. Wait for a *test of a print* that holds.
- Respect overhead prints. Rallies into $728–$730 may meet supply from institutions who transacted there this week.
- Options get more expensive. With implied volatility up, outright long options cost more. Spreads help: aim to pay no more than one-third of the strike width on debit spreads, and collect at least one-third on credit spreads.
- Watch the post-OpEx reset. Friday’s expiration cleared a lot of short-dated options. Expiring put hedges can unwind and spark a relief bounce early in the week — but Friday’s fresh $700 and $690 put buying for October 30 rebuilds that pressure lower down.
- Check the gamma flip before you trade. QQQ’s flip is at $728.46 on the Moby Tick chart. While price stays below it, expect wider swings and momentum; if QQQ gets back above it, expect the calmer, mean-reverting behaviour to return. The flip moves during the day as time decay and implied volatility change, so check it fresh each session.
The bottom line
Regimes don’t announce themselves — they show up as a pile of small changes: ranges widen, volume rises, VIX wakes up, institutions print at levels price can’t hold, and options flow turns defensive. This week delivered all of them at once in QQQ.
The traders who struggle in regime shifts are the ones still running last month’s playbook. The ones who do well notice the rules changed, shrink their size, map the levels on both sides, and let the market prove the next direction.
*Dealer positioning is inferred from trade data and models, not directly observable, and gamma levels are estimates. Nothing here is a recommendation to buy or sell any security. Anything can happen in the market — only risk what you’re comfortable losing.*
Data sources: Moby Tick late prints, dark pool key levels, options flow and GEX gamma flip; QQQ/SPY daily price data and VIX via Massive. All figures as of the October 16, 2026 close.
Ready to Trade with Whale-Level Insight?
Get institutional-grade dark pool intelligence delivered to your inbox every week.
Disclaimer: This newsletter is for informational and educational purposes only. It does not constitute financial advice, investment recommendations, or solicitation to buy or sell securities. Trading stocks, ETFs, and options involves substantial risk of loss. Past performance is not indicative of future results.