
Market Overview
Small caps and the Dow finished the week higher while the S&P 500 and Nasdaq slipped. SPY closed at 759.97, down 0.43% for the week, and QQQ fell 0.76% to 704.40. IWM gained 1.96% to 275.75 and DIA added 0.44% to 521.37. The S&P 500 ended at 7,623.68, down 0.47%, after touching 7,770.40 on Wednesday, October 21.
| ETF | Open | High | Low | Close | Week % |
|---|---|---|---|---|---|
| SPY | 767.23 | 774.44 | 758.68 | 759.97 | -0.43% |
| QQQ | 719.61 | 727.95 | 701.16 | 704.40 | -0.76% |
| IWM | 271.82 | 277.70 | 270.71 | 275.75 | +1.96% |
| DIA | 518.40 | 528.45 | 517.75 | 521.37 | +0.44% |
What Led and What Lagged
Eight of the twelve sector funds finished the week higher. XLE led at 1.60%, followed by XLV at 1.45%, XLRE at 0.97% and XLU at 0.83%. XLB, XLP, XLF and XLY each gained between 0.57% and 0.77%. XLK slipped 0.13%, XLI fell 1.87% and SMH lost 2.33%. XLC was the weakest, down 4.36%.
NFLX reported after the close on October 20 and closed October 21 at 65.04, down 6.89%, on 101.4M shares. META reported after the close on October 21 and closed October 22 at 648.85, down 6.98%, on 40.6M shares, compared with 29.2M the day before. For the week, META fell 9.40%, NFLX 6.64% and GOOGL 5.98%, and CRWV dropped 11.65%. TSLA, which reported October 21, gained 4.93%, and PG, which reported October 22, rose 1.05%.
All four index ETFs closed lower on Friday. DIA fell 1.24%, SPY 0.52% and IWM 0.33%, while QQQ was down 0.01%. XLE rose 2.60%, and SMH, XLK and XLRE were the only other sector funds higher on the day. XLP fell 1.92% and XLC 1.78%.
Rates and Crude
Treasury yields fell across the curve on Thursday, October 22. The 10-year yield moved from 5.15% on October 19 to 5.13% on October 21, then ended at 4.96% on October 22. The 2-year went from 4.77% to 4.81% before dropping to 4.65%, and the 30-year from 5.48% to 5.42% before falling to 5.29%. From October 21 to October 22, the 10-year fell 17 basis points, the 2-year 16 and the 30-year 13. The dataset has no October 23 yield print.
Among the commodity and dollar ETFs, the USO oil fund rose 4.80% and the GLD gold fund fell 4.03%. The UUP dollar fund added 0.14%, and the IBIT bitcoin fund slipped 0.41%.
Dark Pool Flow
MobyTick counts prints of 50,000 shares or more and excludes the opening and closing auctions. QQQ printed $25.92B across 36.24M shares at 123 levels, ahead of SPY at $22.91B, 29.92M shares and 48 levels. IWM printed $4.07B across 14.83M shares at 62 levels, and DIA $0.54B at 8 levels.
AAPL led the single names at $8.68B on 25.20M shares, averaging $344.52. NVDA printed $5.53B at an average of $215.27, META $3.76B at $686.88 and MSFT $3.58B at $530.82. MDT printed $2.20B on 23.59M shares across only 7 levels, averaging $93.23. TSLA and PLTR each printed $2.06B. In energy, CVX printed $1.61B and XOM $1.17B.
The eleven sector SPDRs plus SMH printed a combined $7.16B, with SMH at $2.00B and XLF at $0.95B.
Last Week’s Scorecard
Of the reference levels issued October 19 for the week of October 19 to 23, upper-side observations were recorded for 9 tickers and lower-side observations for 2, and three tickers recorded no crossing. Four of 13 tickers reached at least one reference level, for 8 reference levels in total. TSLA reached 2 of 4 upper-side reference levels on a 4.74% range from the reference, and PG reached 4 of 6 upper-side reference levels on a 4.28% range. MSFT reached 1 of 4 lower-side reference levels on a 1.58% range, and AVTR reached 1 of 6 upper-side reference levels on a 5.76% range. QQQ’s high of 727.95 stopped 0.05 short of its 728.00 upper level, and SPY’s high of 774.44 stopped 0.56 short of 775.00. MDT recorded observations on both sides without reaching a reference level on either.
On the Calendar
The FOMC meets on October 27 and 28. Among the tickers covered here, KO reports before the open on Tuesday, October 27, and HOOD after the close that day. GOOGL and MSFT report after the close on Wednesday, October 28, and AMZN after the close on Thursday, October 29. XOM and CVX report before the open on Friday, October 30. AAPL and PLTR follow after the close on Monday, November 2. SPY, QQQ and IWM are ETFs and do not report.
| Date | Event |
|---|---|
| Tue Oct 27 | KO earnings, before open |
| Tue Oct 27 | HOOD earnings, after close |
| Oct 27–28 | FOMC meeting |
| Wed Oct 28 | GOOGL earnings, after close |
| Wed Oct 28 | MSFT earnings, after close |
| Thu Oct 29 | AMZN earnings, after close |
| Fri Oct 30 | XOM earnings, before open |
| Fri Oct 30 | CVX earnings, before open |
| Mon Nov 2 | AAPL earnings, after close |
| Mon Nov 2 | PLTR earnings, after close |
IWM gained 1.96% on the week while SPY fell 0.43%.
Last Week’s Callout Performance
| Ticker | Upper Level | Lower Level | High | Low | Close | Observed Side | Reference Levels Reached | Range From Reference |
|---|---|---|---|---|---|---|---|---|
| SPY | $775.00 | $757.00 | $774.44 | $758.68 | $759.97 | None | 0 of 0 | — |
| QQQ | $728.00 | $700.00 | $727.95 | $701.16 | $704.40 | None | 0 of 0 | — |
| IWM | $277.50 | $270.00 | $277.70 | $270.71 | $275.75 | Upper | Upper: 0 of 5 | $277.50 → $277.70 (+0.07%) |
| MDT | $96.50 | $93.00 | $96.89 | $92.67 | $95.41 | Upper and lower | Upper: 0 of 6 · Lower: 0 of 4 | $96.50 → $96.89 (+0.40%) · $93.00 → $92.67 (-0.35%) |
| XLU | $42.50 | $41.25 | $42.88 | $41.28 | $42.56 | Upper | Upper: 0 of 5 | $42.50 → $42.88 (+0.89%) |
| PBR | $26.20 | $25.00 | $26.39 | $25.09 | $26.16 | Upper | Upper: 0 of 6 | $26.20 → $26.39 (+0.73%) |
| TSLA | $371.25 | $350.00 | $388.86 | $354.47 | $372.22 | Upper | Upper: 2 of 4 → R2 ($380.00) | $371.25 → $388.86 (+4.74%) |
| MSFT | $545.00 | $524.00 | $535.57 | $515.70 | $524.51 | Lower | Lower: 1 of 4 → R1 ($520.00) | $524.00 → $515.70 (-1.58%) |
| WMT | $121.50 | $116.00 | $122.40 | $116.63 | $119.89 | Upper | Upper: 0 of 6 | $121.50 → $122.40 (+0.74%) |
| PG | $160.00 | $156.00 | $166.85 | $156.80 | $161.02 | Upper | Upper: 4 of 6 → R4 ($165.00) | $160.00 → $166.85 (+4.28%) |
| XLF | $56.50 | $53.00 | $56.67 | $55.03 | $55.90 | Upper | Upper: 0 of 4 | $56.50 → $56.67 (+0.30%) |
| PLTR | $203.50 | $184.00 | $202.63 | $186.16 | $196.75 | None | 0 of 0 | — |
| AVTR | $16.50 | $14.50 | $17.45 | $16.19 | $17.29 | Upper | Upper: 1 of 6 → R1 ($17.00) | $16.50 → $17.45 (+5.76%) |
Upper-side observations: 9 · Lower-side observations: 2 · No crossing recorded: 3
Tickers reaching ≥1 reference level: 4 · Total reference levels reached: 8
Upper Reference Levels
| Ticker | Upper Reference | Reference Levels | Earnings |
|---|---|---|---|
| SPY | $770.00 | $772.50 → $775.00 → $777.50 → $780.00 → $785.00 → $790.00 | — |
| QQQ | $712.50 | $715.00 → $720.00 → $725.00 → $730.00 → $735.00 → $740.00 | — |
| IWM | $282.50 | $285.00 → $287.50 → $290.00 → $292.50 → $295.00 | — |
| MDT | $96.75 | $98.00 → $100.00 → $102.50 → $105.00 | Not yet announced |
| AAPL | $352.50 | $355.00 → $357.50 → $360.00 → $362.50 → $365.00 | Mon Nov 2 · after close |
| XOM | $184.00 | $186.25 → $187.50 → $190.00 → $192.50 → $195.00 | Fri Oct 30 · before open |
| CVX | $235.00 | $237.50 → $240.00 → $245.00 → $250.00 → $255.00 | Fri Oct 30 · before open |
| META | $667.5 | $670 → $675 → $680 → $685 → $690 → $700 | Reported Oct 21 |
| GOOGL | $335 | $340 → $344 → $347.5 → $350 → $355 → $360 | Wed Oct 28 · after close |
| PG | $167 | $168 → $170 → $172.5 → $175 → $177.5 | Reported Oct 22 |
| HOOD | $100 | $102.5 → $105 → $107.5 → $110 → $115 → $120 | Tue Oct 27 · after close |
| KO | $95.5 | $96.25 → $97.5 → $100 → $101.25 → $102.5 | Tue Oct 27 · before open |
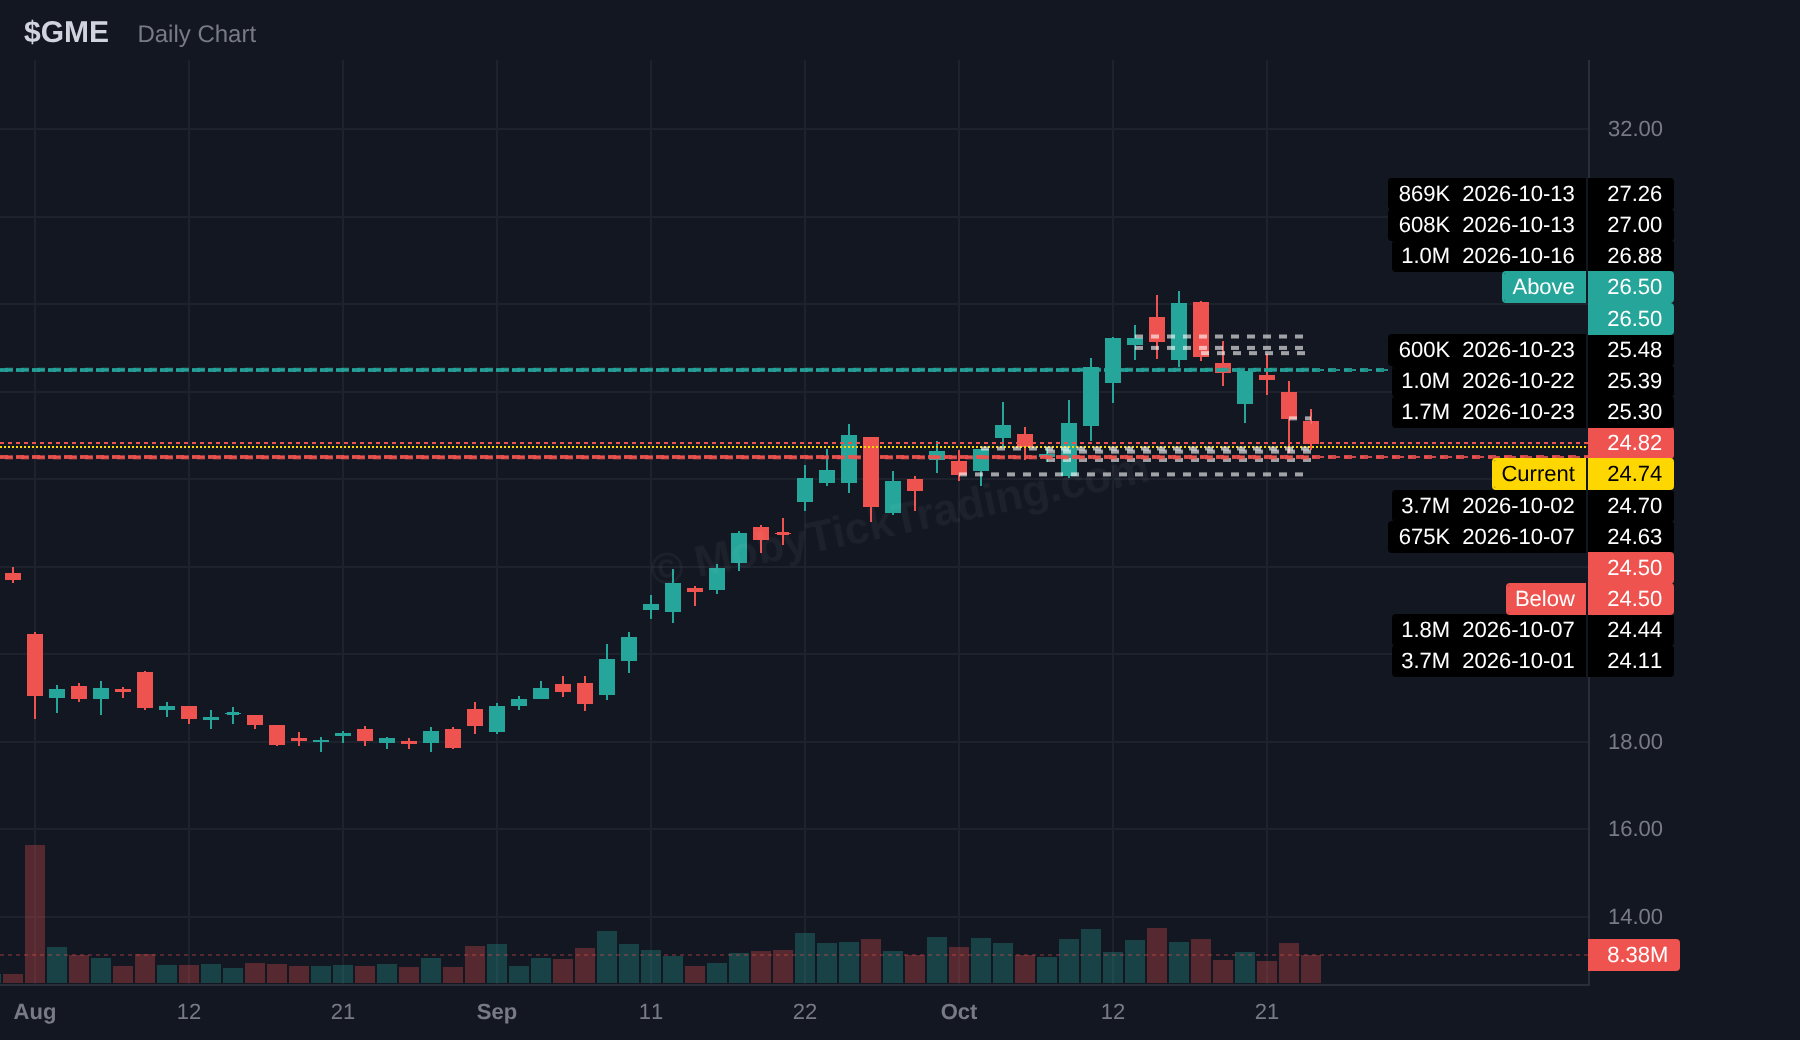
| GME | $26.5 | $27.50 → $28.25 → $30 → $31.25 → $32.5 | — |
Lower Reference Levels
| Ticker | Lower Reference | Reference Levels | Earnings |
|---|---|---|---|
| SPY | $757.50 | $755.00 → $752.50 → $750.00 → $745.00 → $740.00 | — |
| QQQ | $700.00 | $697.50 → $695.00 → $692.50 → $690.00 → $680.00 | — |
| IWM | $270.00 | $265.00 → $262.50 → $260.00 → $257.50 → $255.00 | — |
| MDT | $93.00 | $92.00 → $91.00 → $90.00 → $88.00 | Not yet announced |
| AAPL | $340.00 | $337.50 → $335.00 → $332.50 → $330.00 → $325.00 | Mon Nov 2 · after close |
| XOM | $176.50 | $175.00 → $172.50 → $170.00 → $165.00 | Fri Oct 30 · before open |
| CVX | $219.50 | $217.50 → $215.00 → $210.00 → $207.00 | Fri Oct 30 · before open |
| META | $630 | $625 → $620 → $610 → $600 → $590 → $580 | Reported Oct 21 |
| GOOGL | $320 | $317.5 → $315 → $310 → $300 → $290 → $280 | Wed Oct 28 · after close |
| PG | $157 | $155 → $152.5 → $150 → $147.5 → $145 | Reported Oct 22 |
| HOOD | $93 | $90 → $87.5 → $85 → $82.5 → $80 | Tue Oct 27 · after close |
| KO | $92.5 | $91 → $90 → $87.5 → $85 → $82.50 → $80 | Tue Oct 27 · before open |
| GME | $24.50 | $22.5 → $21.25 → $20 → $19 | — |
This Week’s Reference Levels — Ticker Detail
Each card below shows dark pool flow data for the past week, along with reference levels for the upcoming week. Dark pool statistics are sourced from MobyTick’s proprietary analytics.
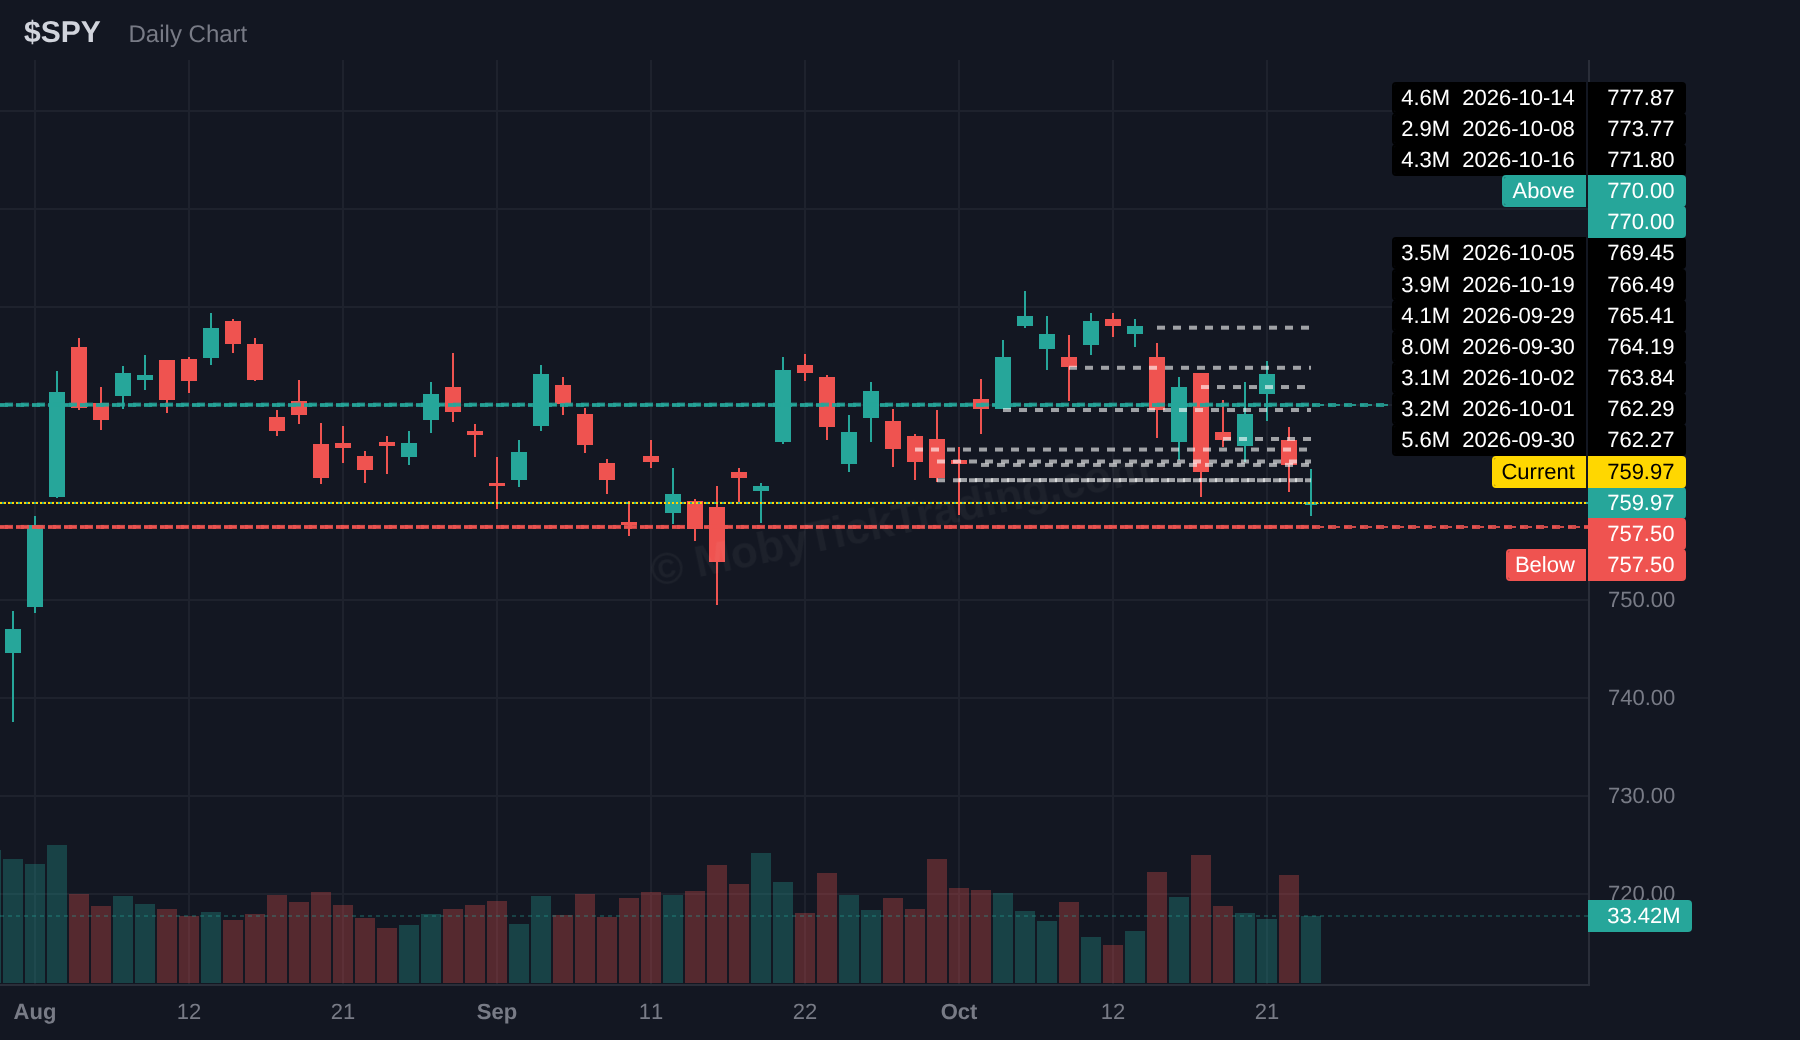
SPY
Upper reference $770.00 → $772.50 → $775.00 → $777.50 → $780.00 → $785.00 → $790.00
Lower reference $757.50 → $755.00 → $752.50 → $750.00 → $745.00 → $740.00
Earnings: —
QQQ
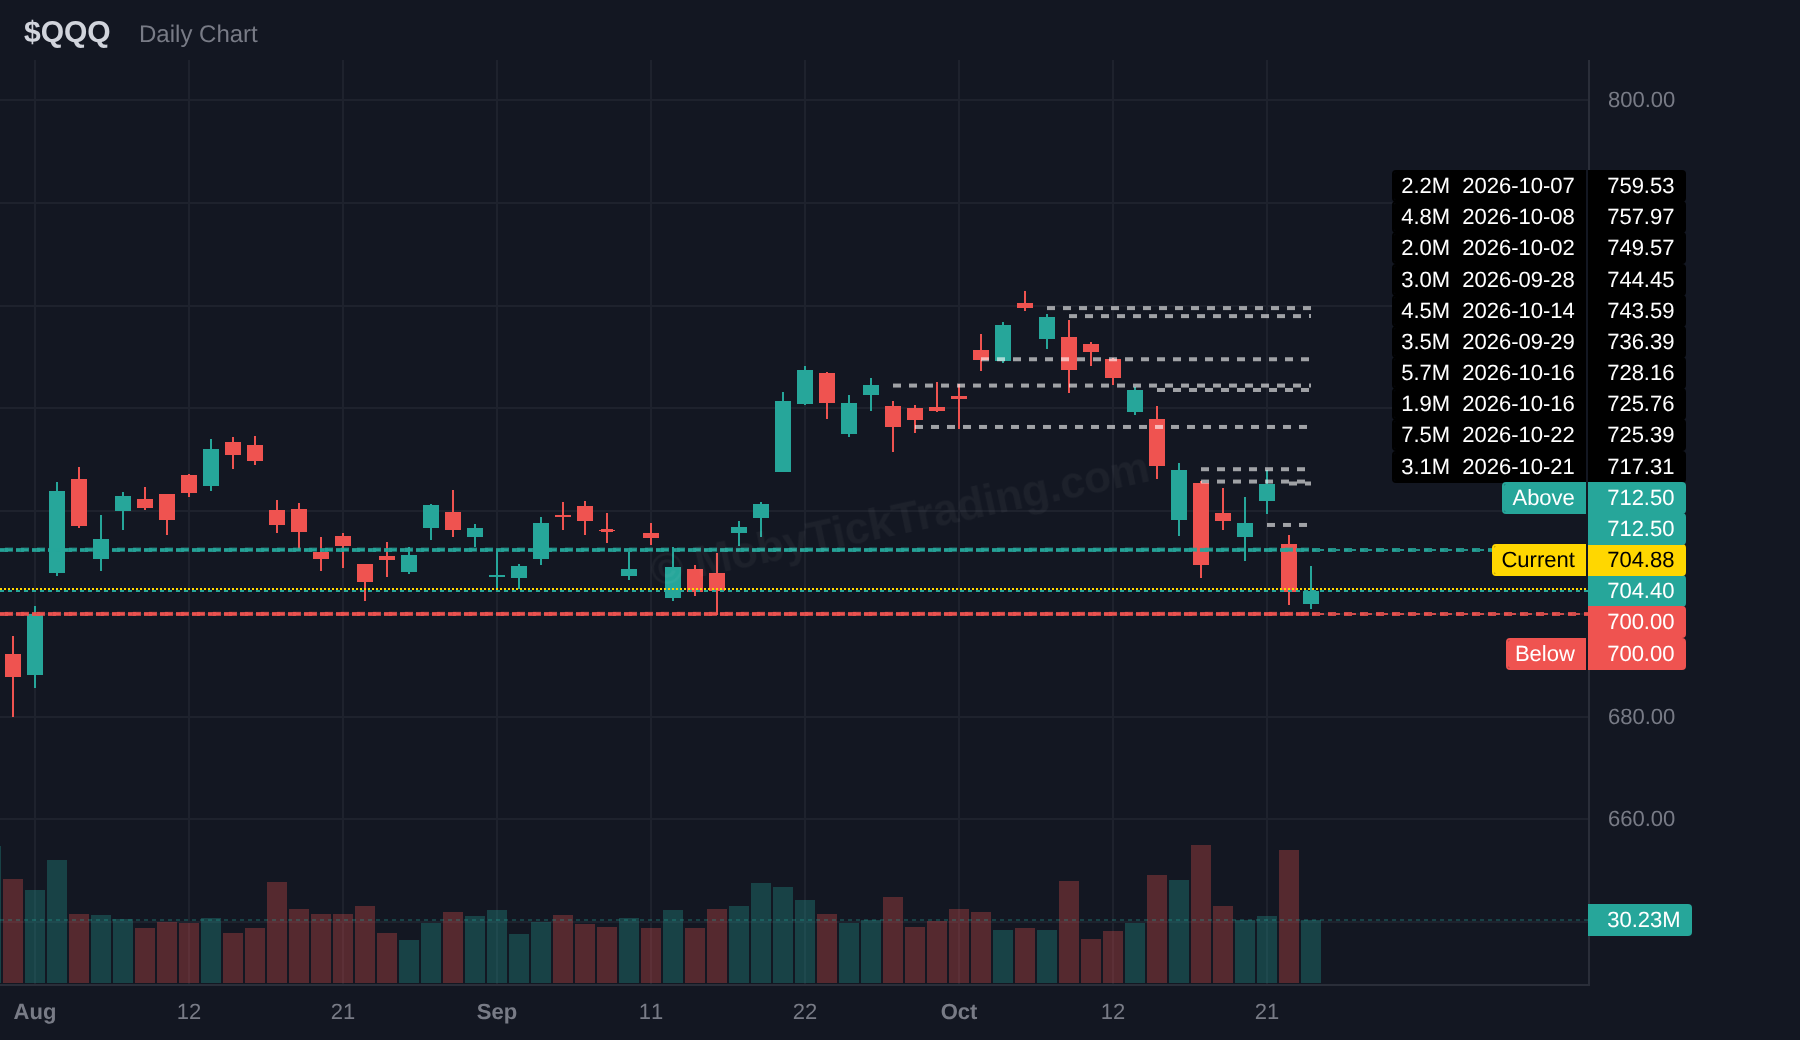
Upper reference $712.50 → $715.00 → $720.00 → $725.00 → $730.00 → $735.00 → $740.00
Lower reference $700.00 → $697.50 → $695.00 → $692.50 → $690.00 → $680.00
Earnings: —
IWM
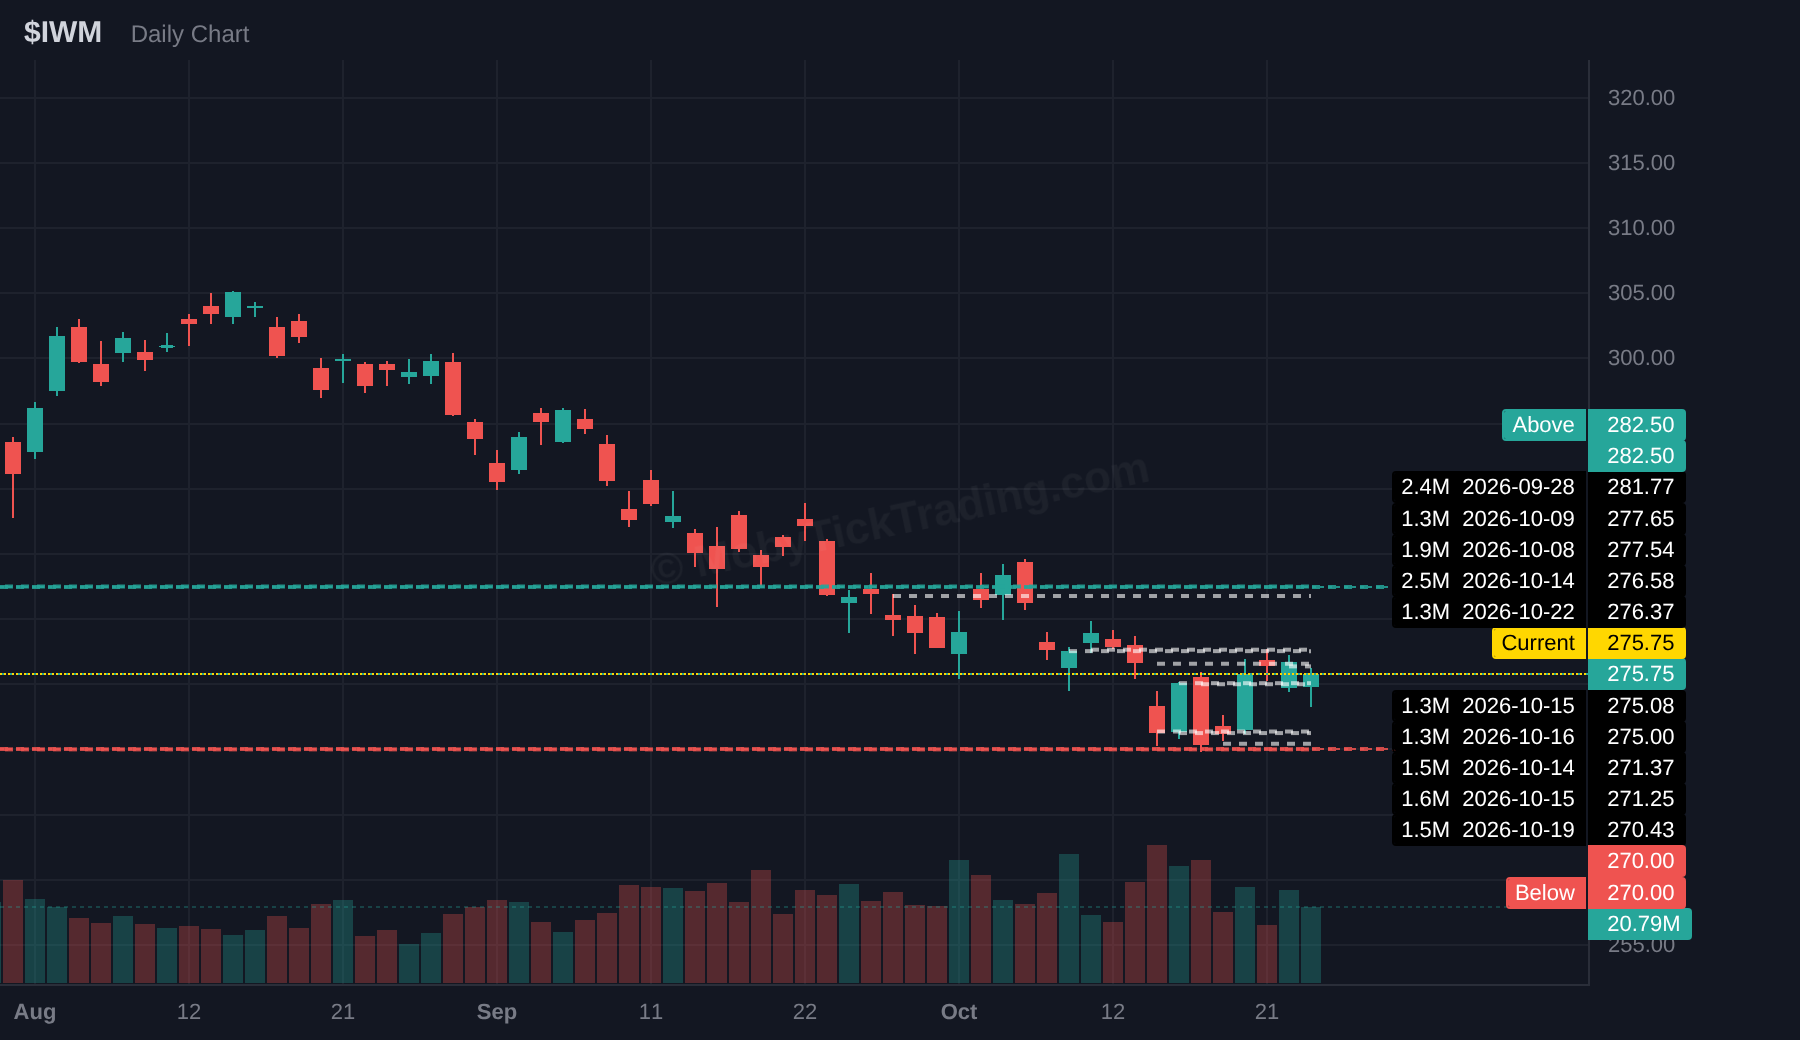
Upper reference $282.50 → $285.00 → $287.50 → $290.00 → $292.50 → $295.00
Lower reference $270.00 → $265.00 → $262.50 → $260.00 → $257.50 → $255.00
Earnings: —
MDT
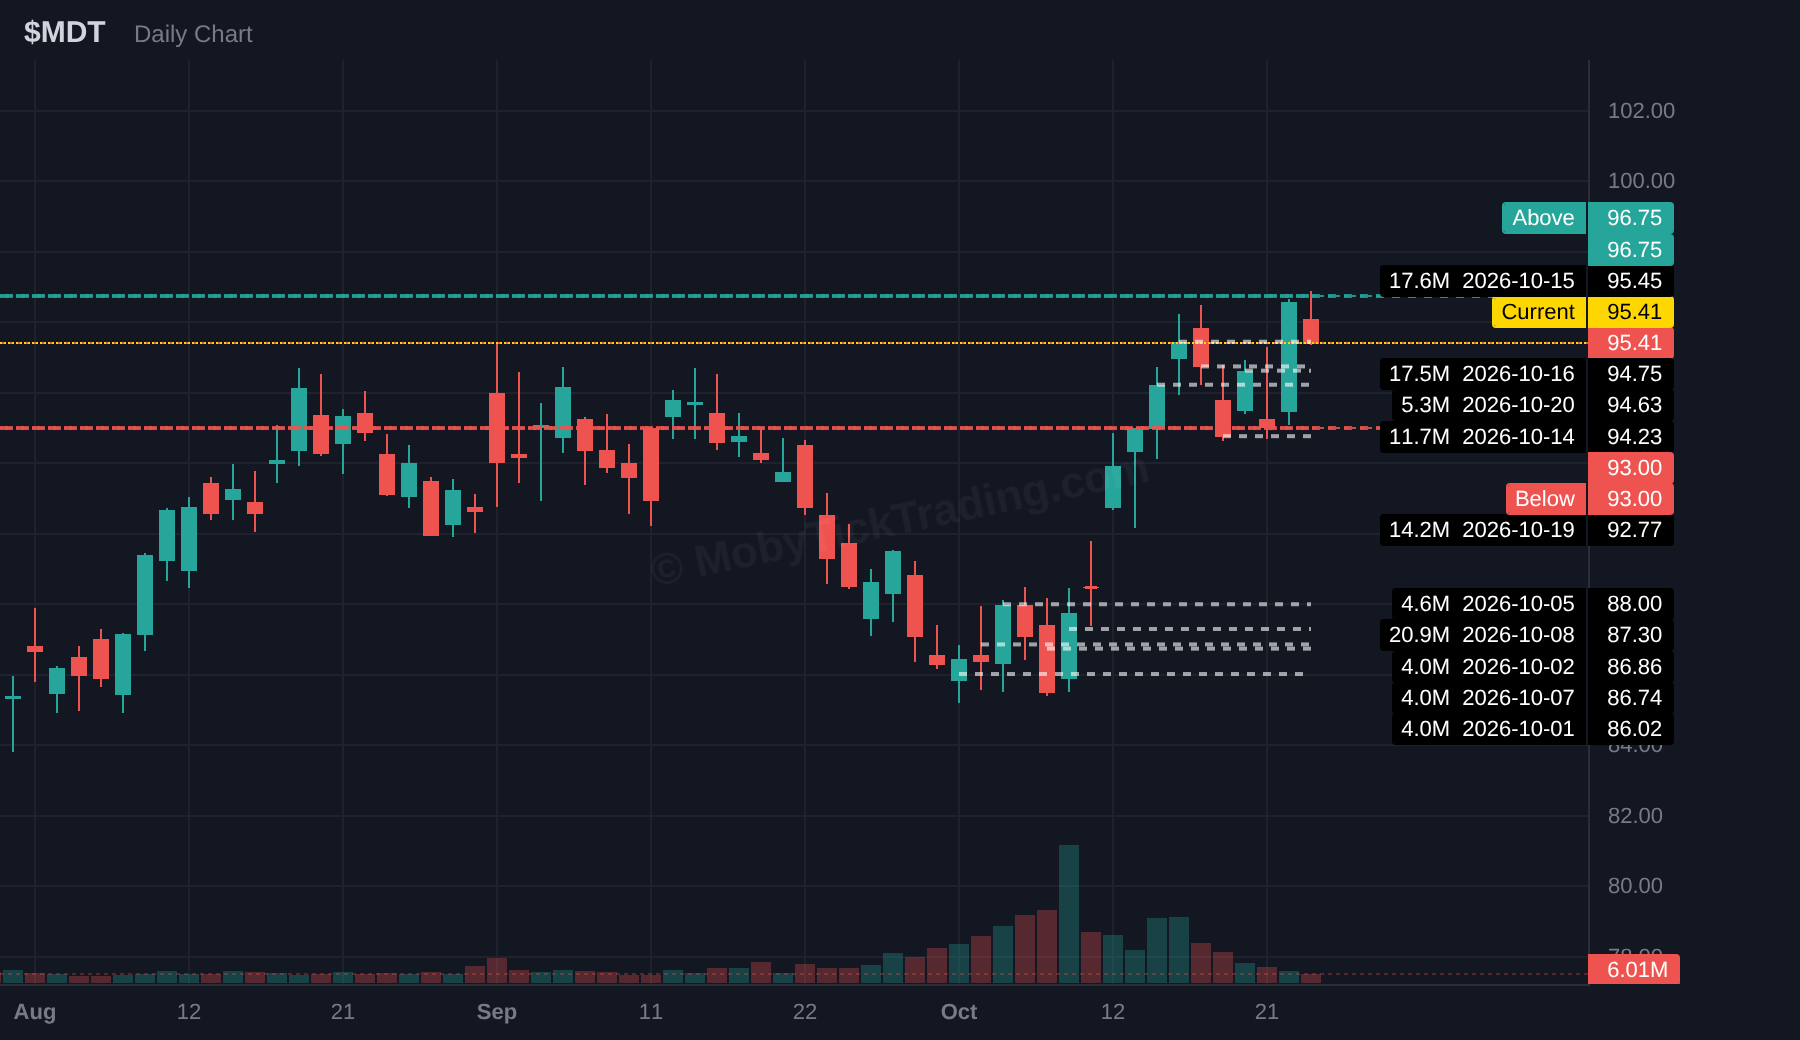
Upper reference $96.75 → $98.00 → $100.00 → $102.50 → $105.00
Lower reference $93.00 → $92.00 → $91.00 → $90.00 → $88.00
Earnings: Not yet announced
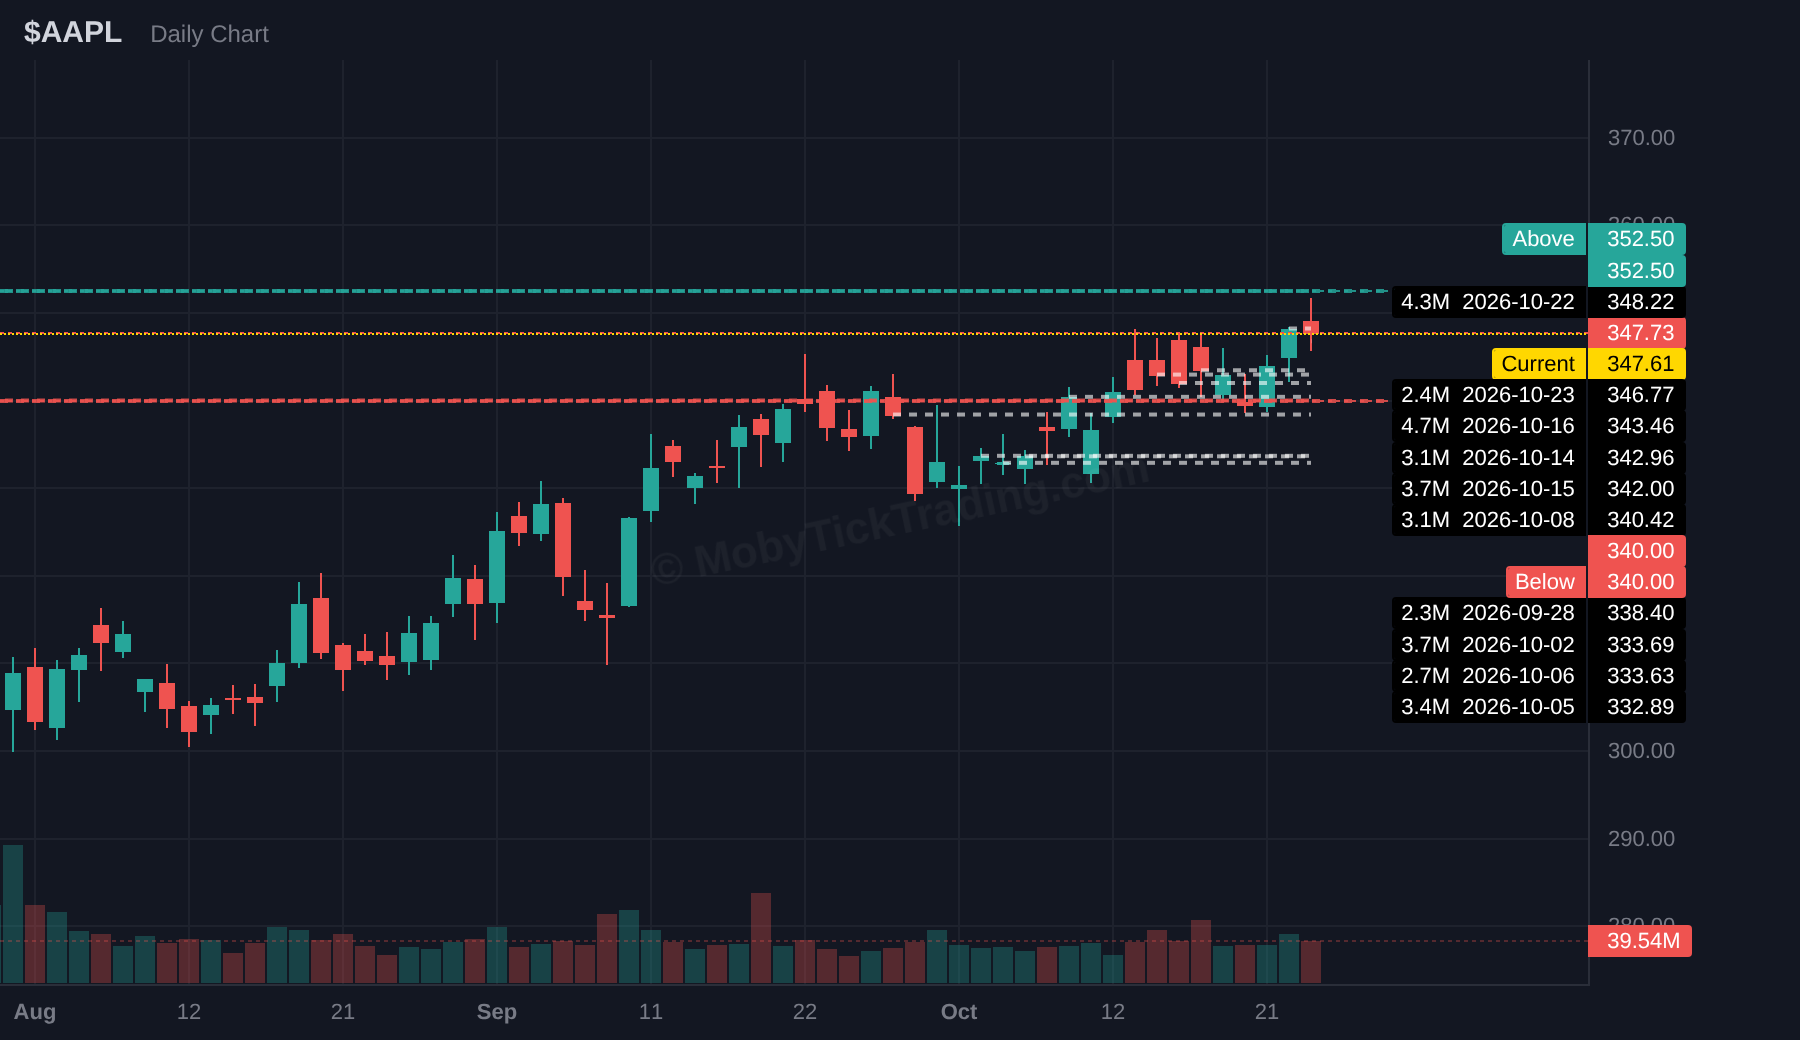
AAPL
Upper reference $352.50 → $355.00 → $357.50 → $360.00 → $362.50 → $365.00
Lower reference $340.00 → $337.50 → $335.00 → $332.50 → $330.00 → $325.00
Earnings: Mon Nov 2 · after close
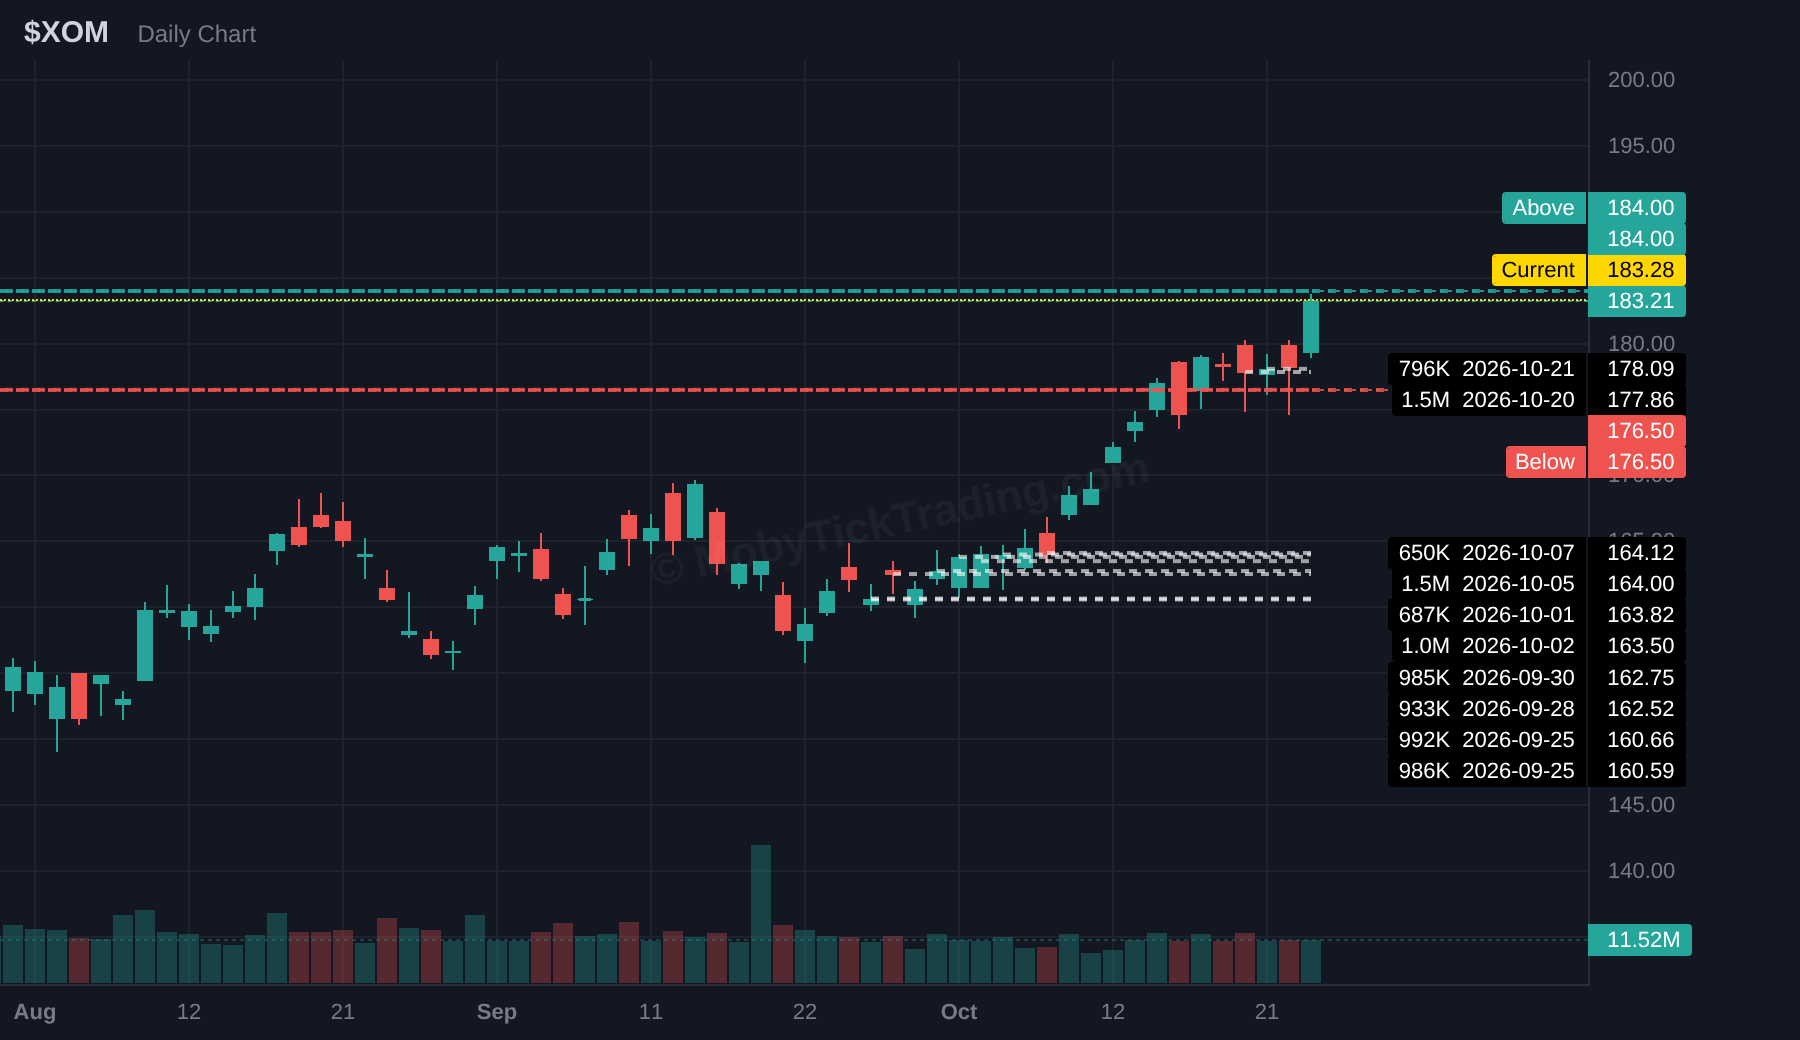
XOM
Upper reference $184.00 → $186.25 → $187.50 → $190.00 → $192.50 → $195.00
Lower reference $176.50 → $175.00 → $172.50 → $170.00 → $165.00
Earnings: Fri Oct 30 · before open
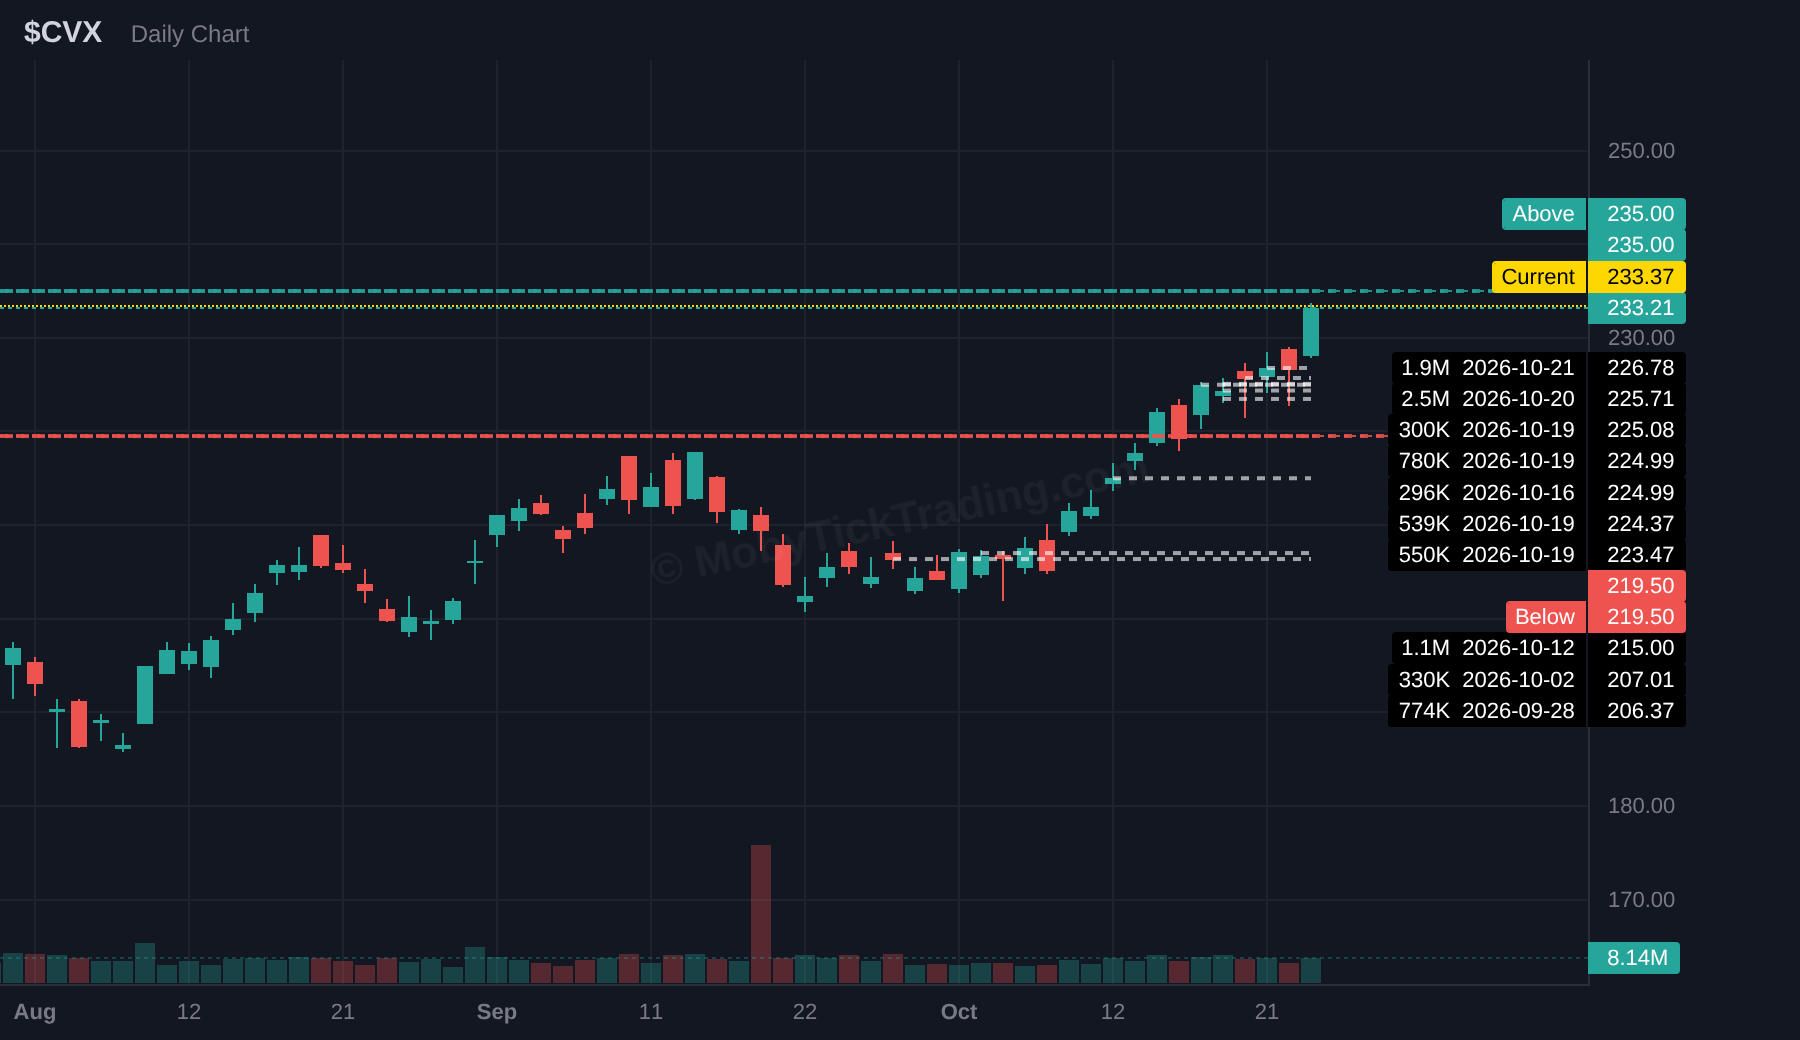
CVX
Upper reference $235.00 → $237.50 → $240.00 → $245.00 → $250.00 → $255.00
Lower reference $219.50 → $217.50 → $215.00 → $210.00 → $207.00
Earnings: Fri Oct 30 · before open
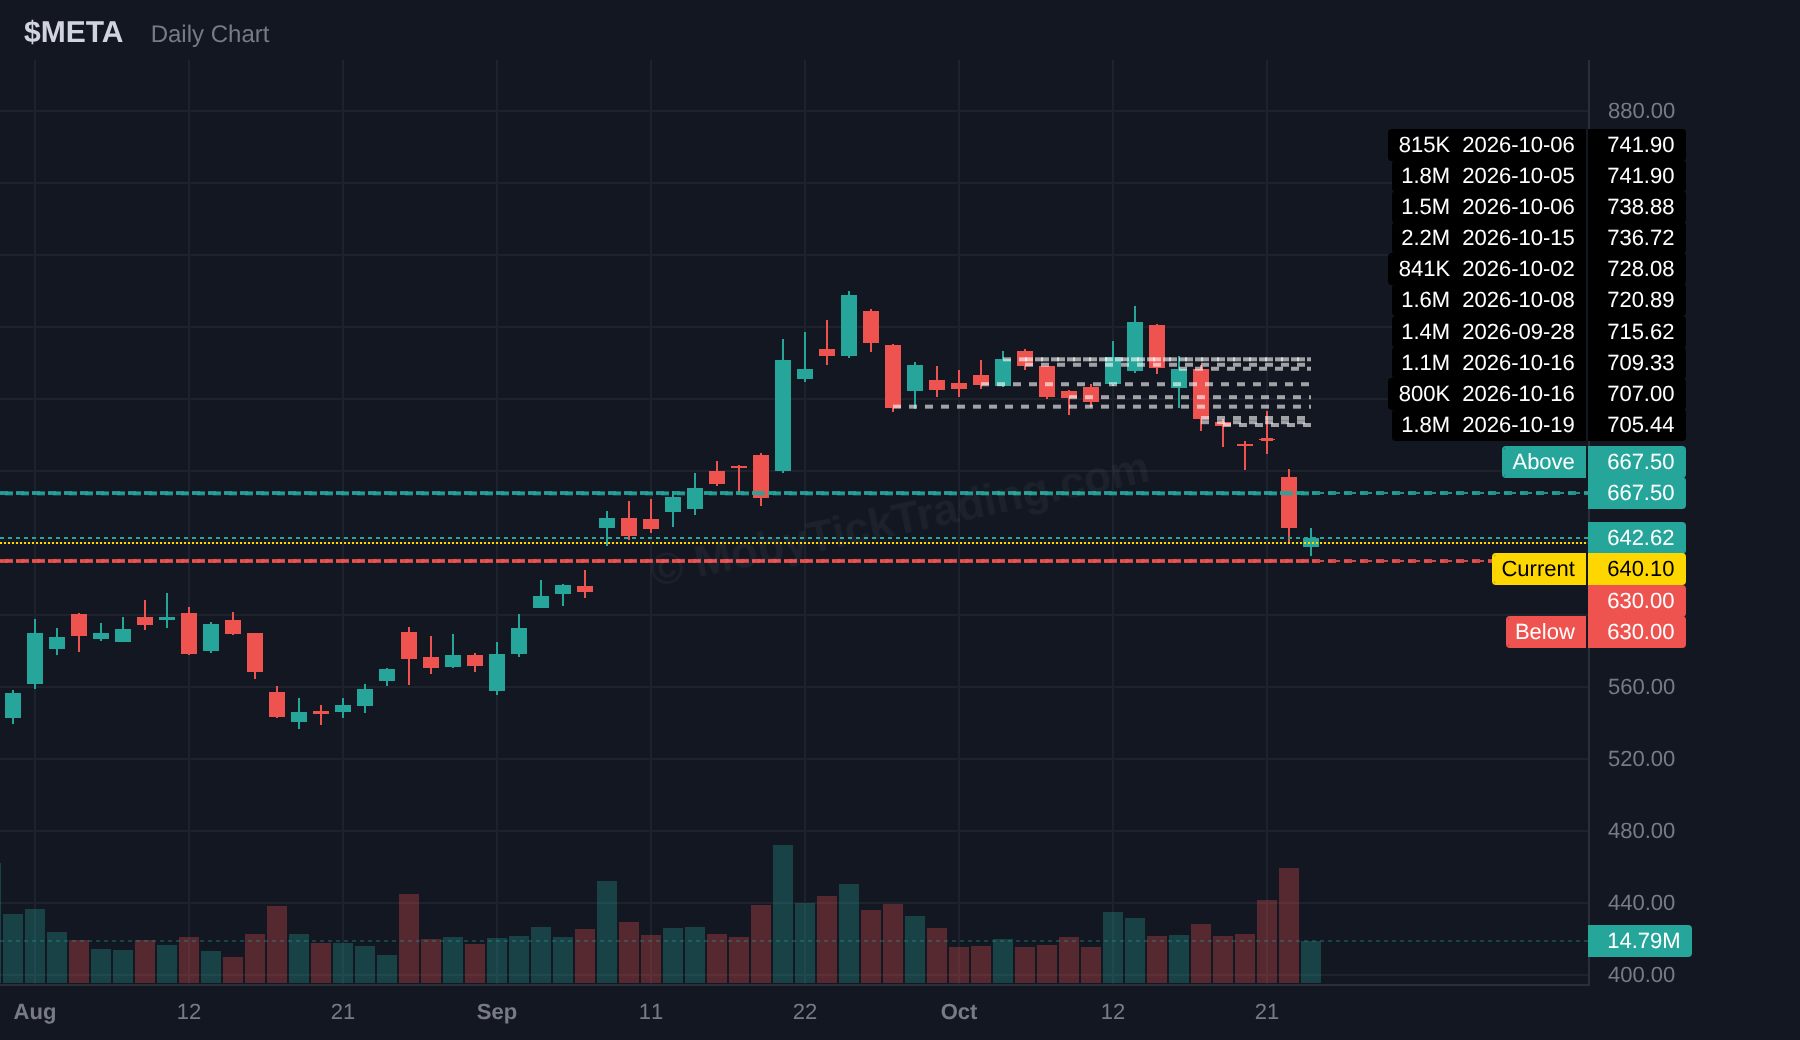
META
Upper reference $667.5 → $670 → $675 → $680 → $685 → $690 → $700
Lower reference $630 → $625 → $620 → $610 → $600 → $590 → $580
Earnings: Reported Oct 21
GOOGL
Upper reference $335 → $340 → $344 → $347.5 → $350 → $355 → $360
Lower reference $320 → $317.5 → $315 → $310 → $300 → $290 → $280
Earnings: Wed Oct 28 · after close
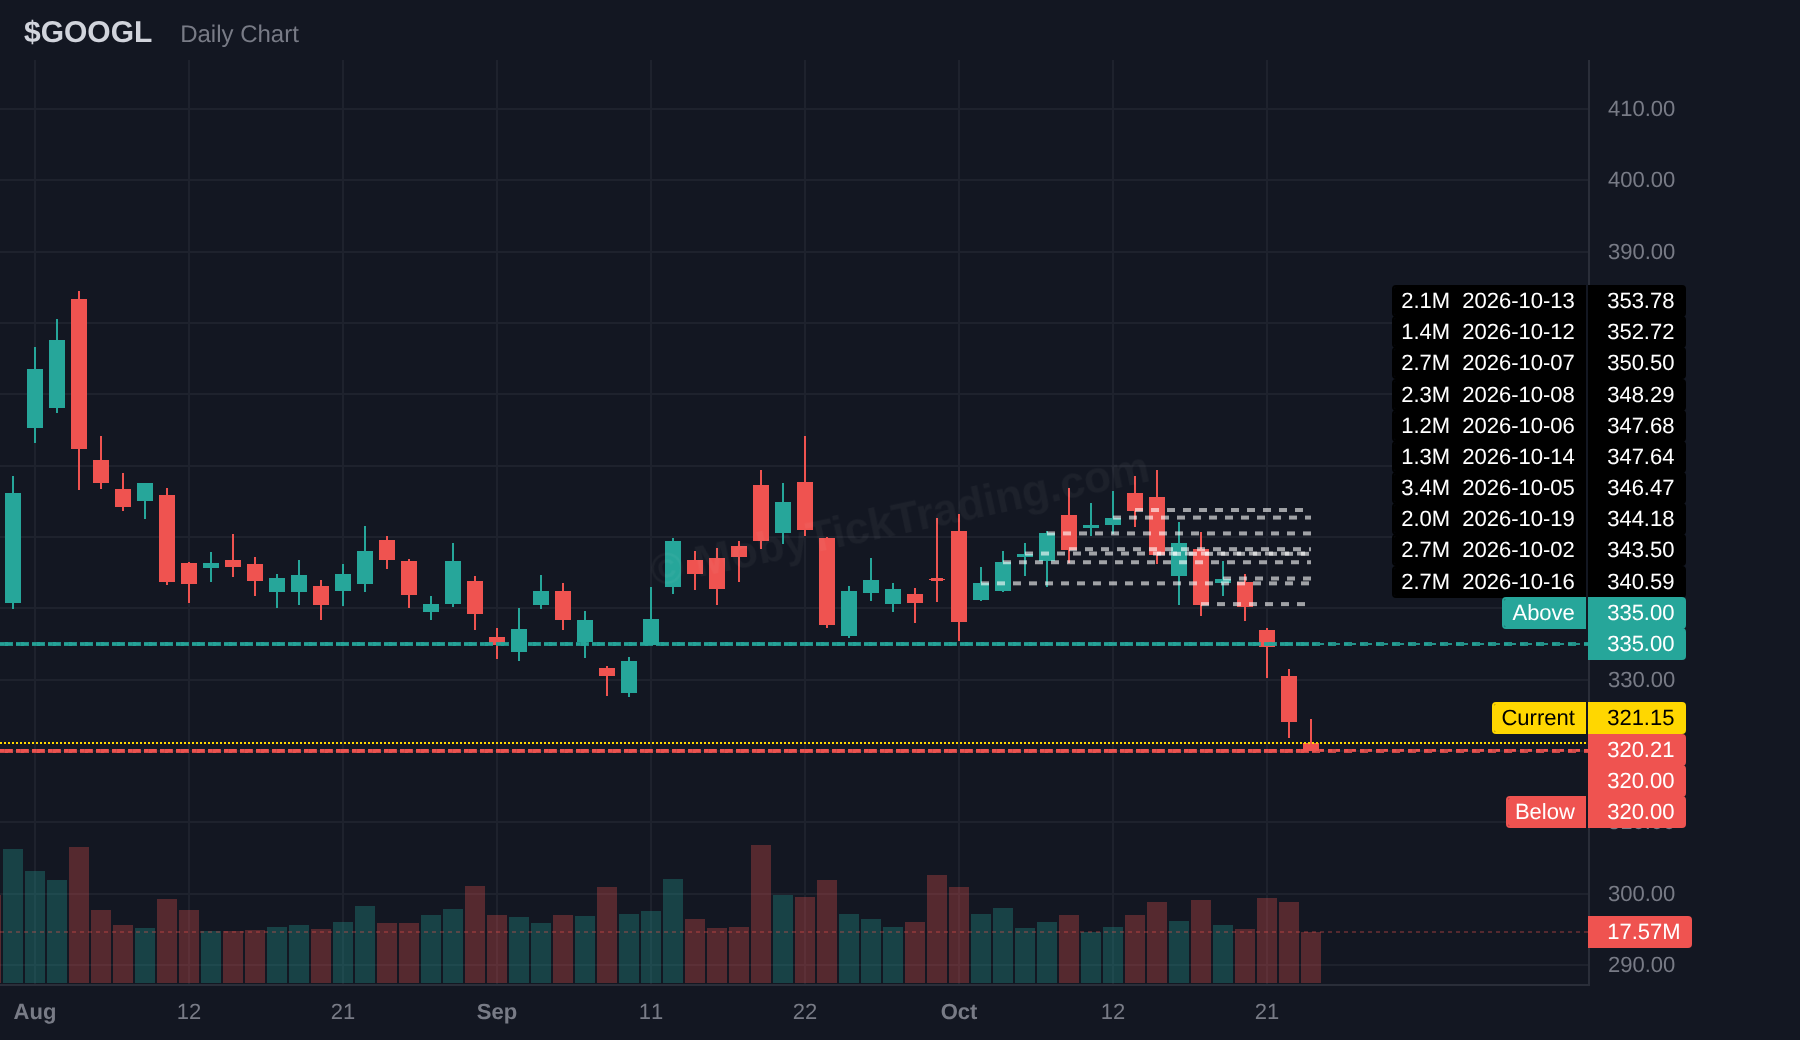
PG
Upper reference $167 → $168 → $170 → $172.5 → $175 → $177.5
Lower reference $157 → $155 → $152.5 → $150 → $147.5 → $145
Earnings: Reported Oct 22
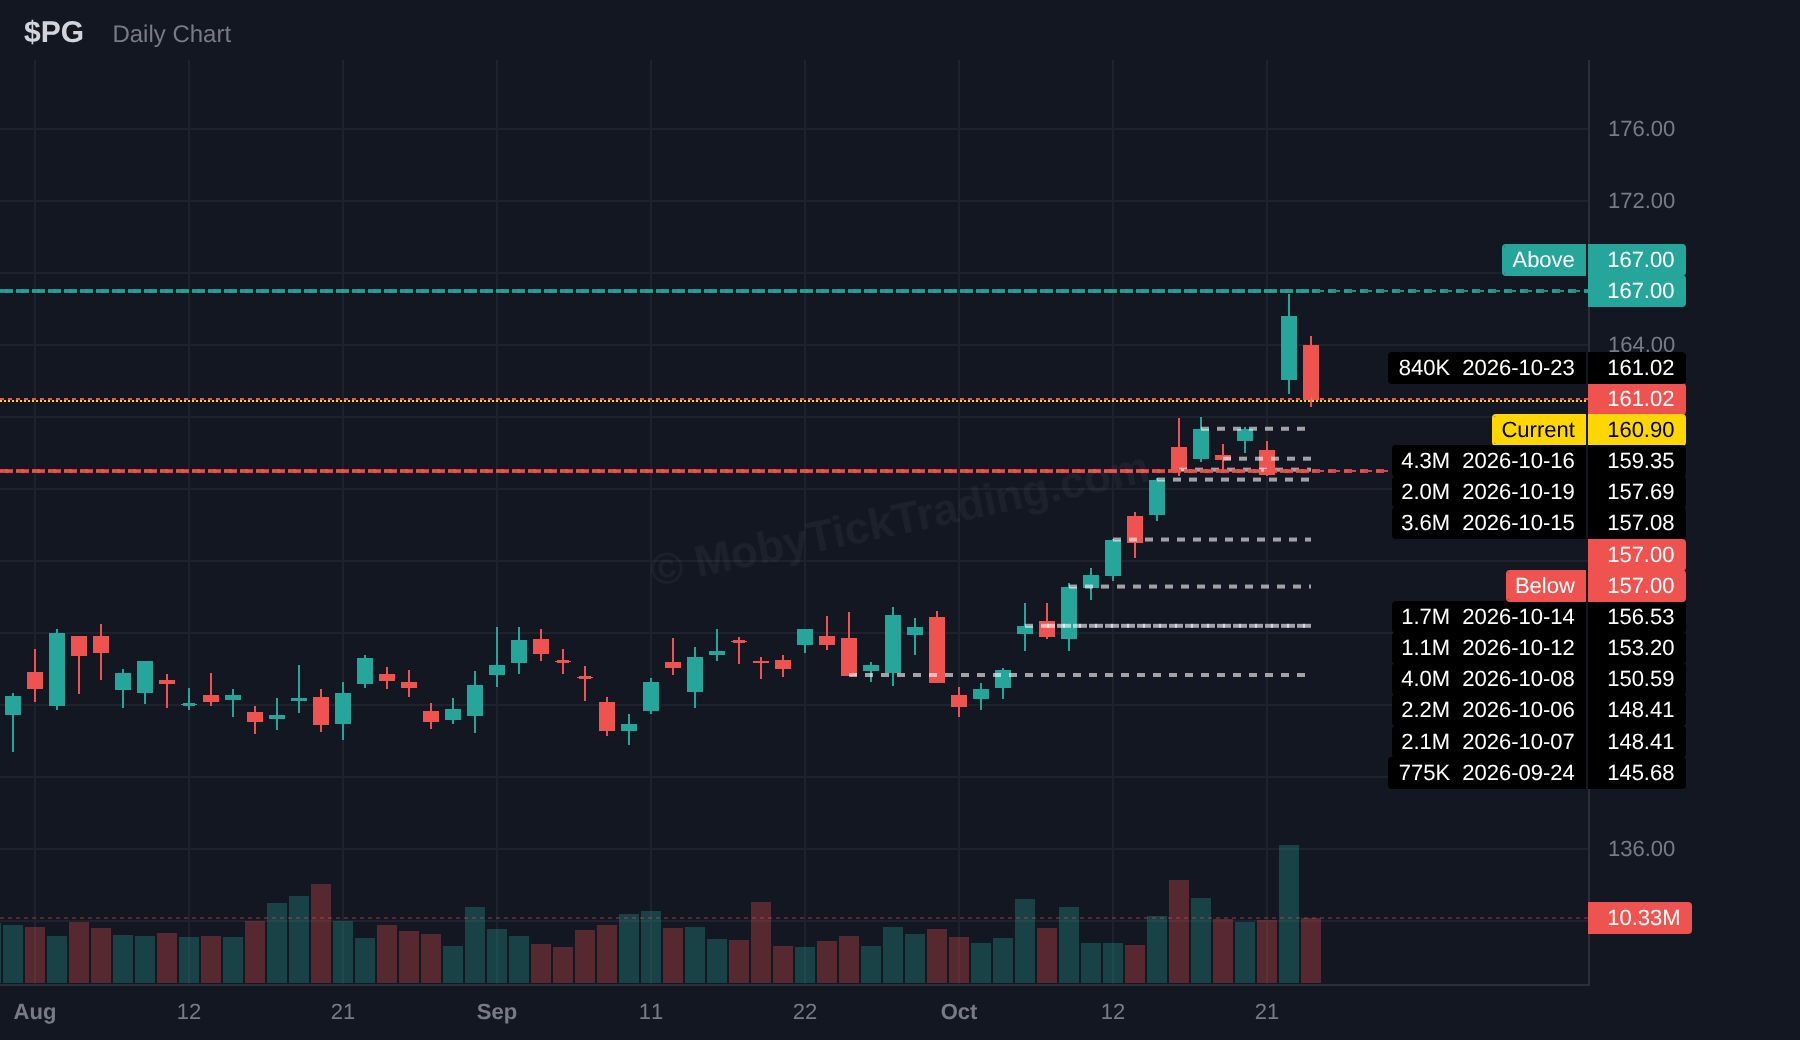
HOOD
Upper reference $100 → $102.5 → $105 → $107.5 → $110 → $115 → $120
Lower reference $93 → $90 → $87.5 → $85 → $82.5 → $80
Earnings: Tue Oct 27 · after close
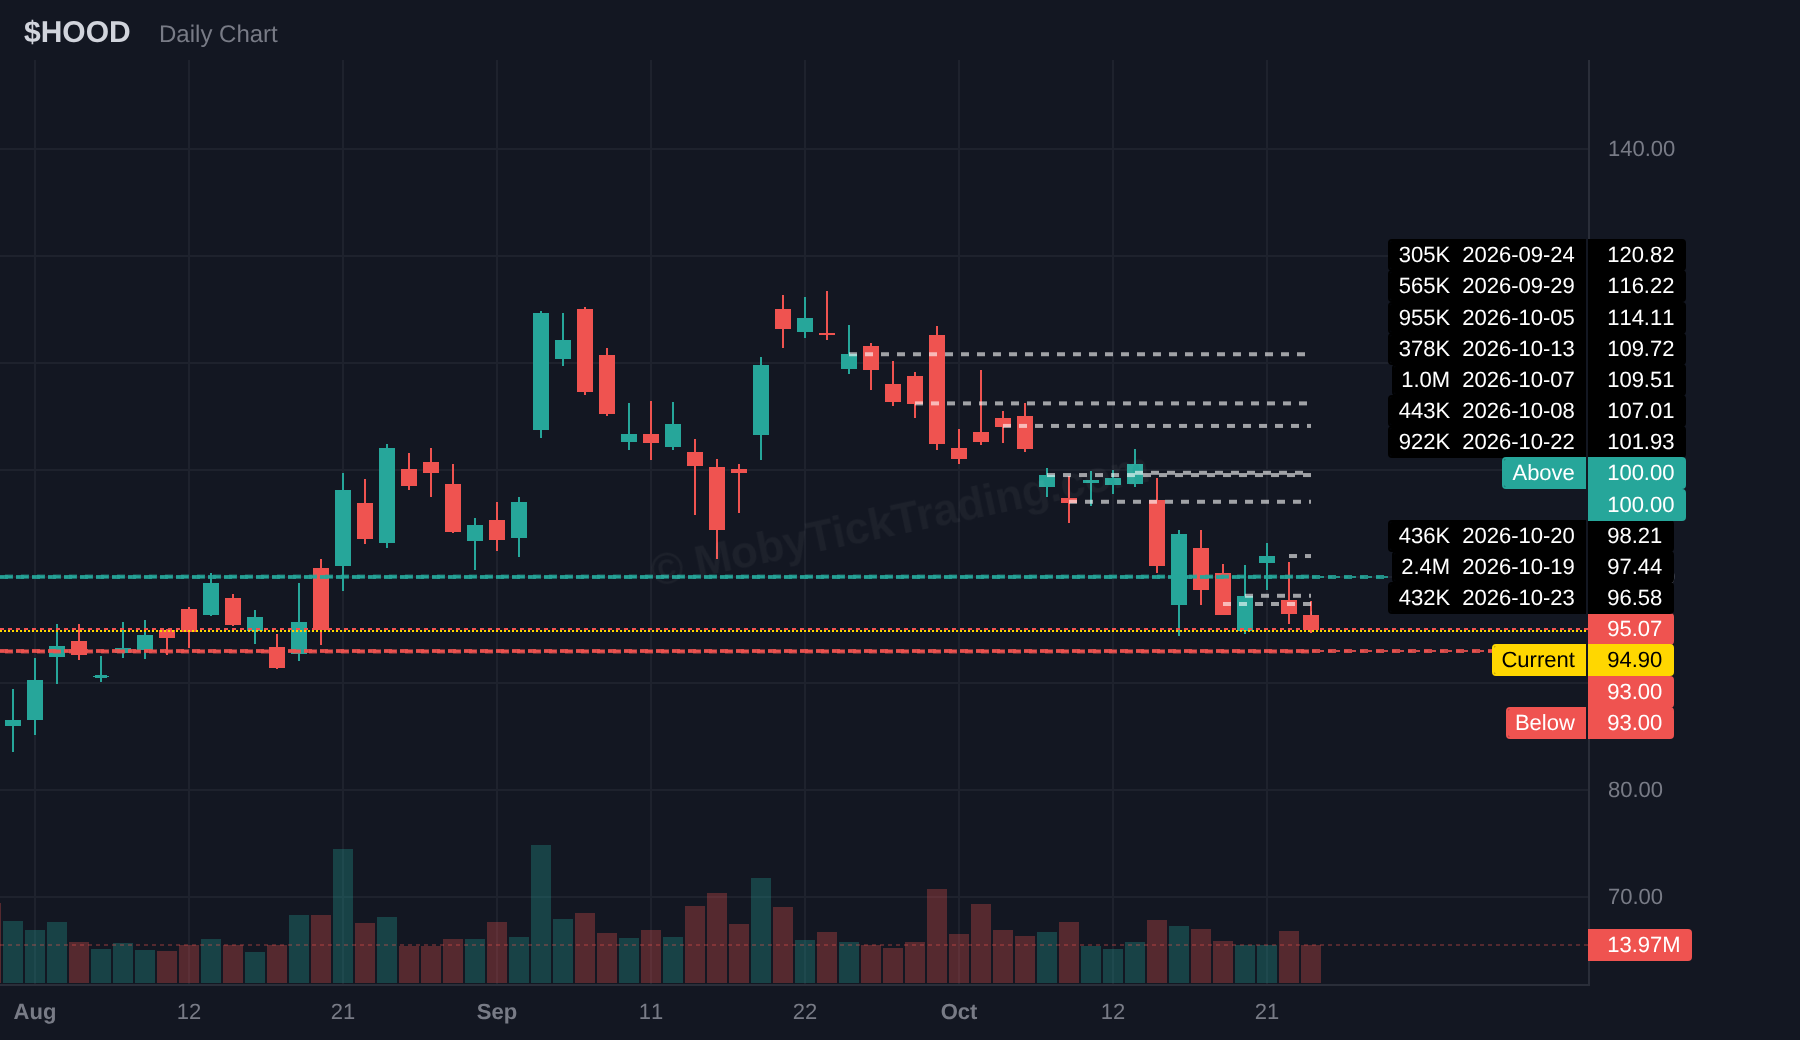
KO
Upper reference $95.5 → $96.25 → $97.5 → $100 → $101.25 → $102.5
Lower reference $92.5 → $91 → $90 → $87.5 → $85 → $82.50 → $80
Earnings: Tue Oct 27 · before open
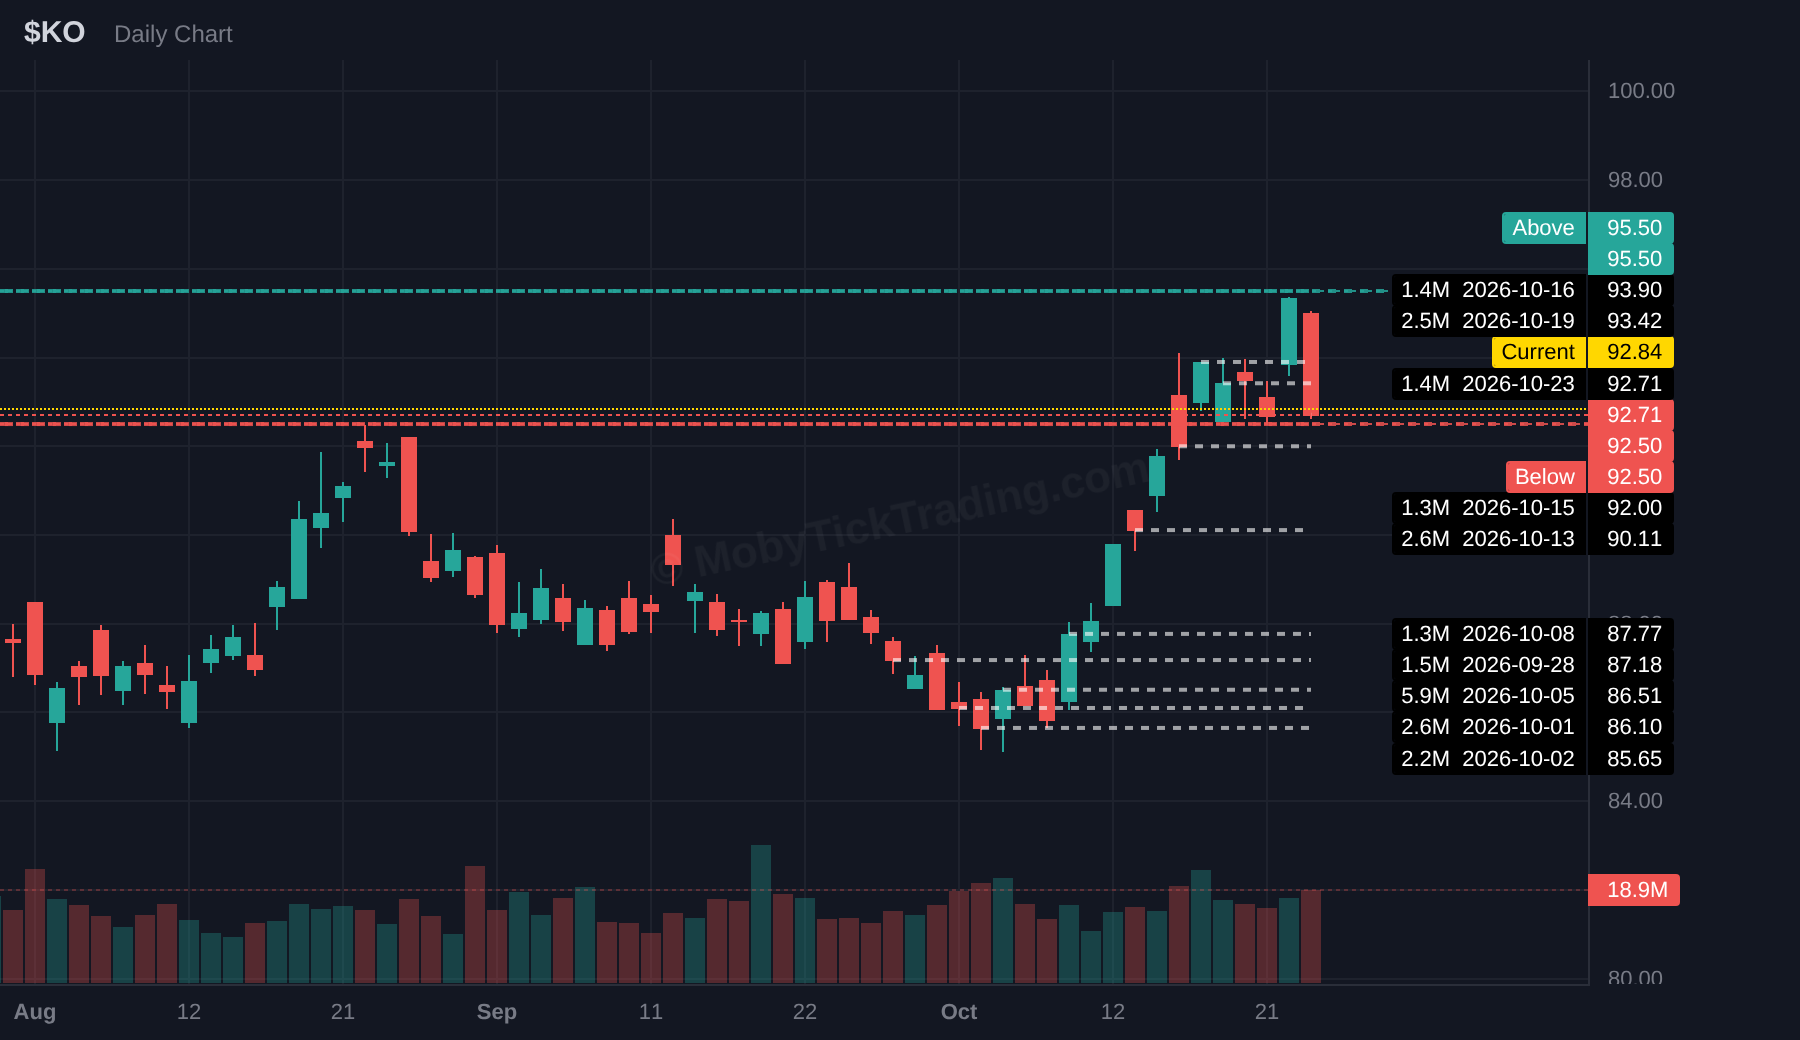
GME
Upper reference $26.5 → $27.50 → $28.25 → $30 → $31.25 → $32.5
Lower reference $24.50 → $22.5 → $21.25 → $20 → $19
Earnings: —
ETF Dark Pool Flow
MobyTick dark pool data put $69.85B through the broad-market, sector and semiconductor ETF basket tracked here for the week of Mon Oct 19 to Fri Oct 23, 2026. SPY and QQQ alone accounted for $48.83B, or 70% of the total. Screens count prints of 50,000 shares or more and exclude the opening and closing auctions.
Broad-Market ETFs
| ETF | Notional | Shares | Levels | Week % | vs 30d ADV |
|---|---|---|---|---|---|
| SPY | $22.91B | 29.92M | 48 | -0.43% | 0.69x |
| QQQ | $25.92B | 36.24M | 123 | -0.76% | 0.99x |
| IWM | $4.07B | 14.83M | 62 | +1.96% | 0.58x |
| IVV | $6.06B | 7.87M | 14 | -0.45% | 1.18x |
| VOO | $3.73B | 5.27M | 9 | -0.43% | 0.69x |
| DIA | $0.54B | 1.03M | 8 | +0.44% | 0.30x |
| Total | $63.23B | 95.16M |
QQQ carried the largest notional of any ETF at $25.92B on 36.24M shares across 123 levels, 0.99x its 30-day average volume. SPY followed at $22.91B on 29.92M shares and 48 levels, 0.69x ADV. QQQ logged 123 price levels against 48 for SPY on comparable notional, which is the week’s clearest sign of how differently the two indices were worked.
IVV was the outlier on a relative basis: $6.06B on 7.87M shares across just 14 levels, 1.18x ADV — the highest multiple in the basket. DIA printed $0.54B at 0.30x ADV, the lightest in the group.
Sector and Semiconductor ETFs
| ETF | Notional | Shares | Levels | Week % | vs 30d ADV |
|---|---|---|---|---|---|
| XLK | $0.62B | 3.35M | 17 | -0.13% | 0.40x |
| XLF | $0.95B | 17.03M | 48 | +0.68% | 0.46x |
| XLE | $0.74B | 10.82M | 38 | +1.60% | 0.32x |
| XLV | $0.16B | 0.90M | 6 | +1.45% | 0.11x |
| XLI | $0.48B | 2.89M | 18 | -1.87% | 0.38x |
| XLC | $0.23B | 2.09M | 8 | -4.36% | 0.33x |
| XLP | $0.72B | 8.21M | 31 | +0.73% | 0.64x |
| XLB | $0.18B | 3.47M | 8 | +0.77% | 0.31x |
| XLU | $0.32B | 7.58M | 32 | +0.83% | 0.24x |
| XLRE | $0.02B | 0.42M | 4 | +0.97% | 0.06x |
| XLY | $0.20B | 1.76M | 10 | +0.57% | 0.25x |
| SMH | $2.00B | 3.67M | 23 | -2.33% | 0.47x |
| Total | $6.62B | 62.17M |
SMH carried $2.00B across 23 levels while the fund fell 2.33% on the week — the largest sector notional in the basket, more than twice XLF’s $0.95B. XLE drew $0.74B across 38 levels into a +1.60% week and a +2.60% Friday, both the strongest of any sector fund tracked here.
The weakest performer drew the least attention. XLC fell 4.36%, the worst sector return of the week, on $0.23B across 8 levels. XLRE was the thinnest book in the basket at $0.02B and 4 levels. XLV drew $0.16B across 6 levels against a +1.45% week.
XLF printed the most levels of any sector fund at 48 on $0.95B, and XLP the second most at 31 on $0.72B. Both are the kind of distribution that shows size being worked in small pieces rather than in single blocks.
Data sourced from MobyTick.
What the Tape Did After the Number: NFLX and META
*Dark Pool Weekly Report — Education Section · Week ending October 23, 2026*
NFLX reported after the close on Tuesday, October 20. META reported after the close on Wednesday,
October 21. Both gaps were negative and both names finished the week well below where they started it.
What diverged was the dark pool tape underneath them, and the divergence is the more useful signal.
Two reactions, same direction
| Metric | NFLX | META |
|---|---|---|
| Close before the report | $69.85 (Oct 20) | $697.52 (Oct 21) |
| Next open | $64.15 | $676.35 |
| Opening gap | -8.16% | -3.04% |
| Close on the reaction day | $65.04 (-6.89%) | $648.85 (-6.98%) |
| Volume on the reaction day | 101.4M | 40.6M |
| Volume two sessions earlier | 34.0M | 17.0M |
| Week close | $65.85 (-6.64%) | $642.62 (-9.40%) |
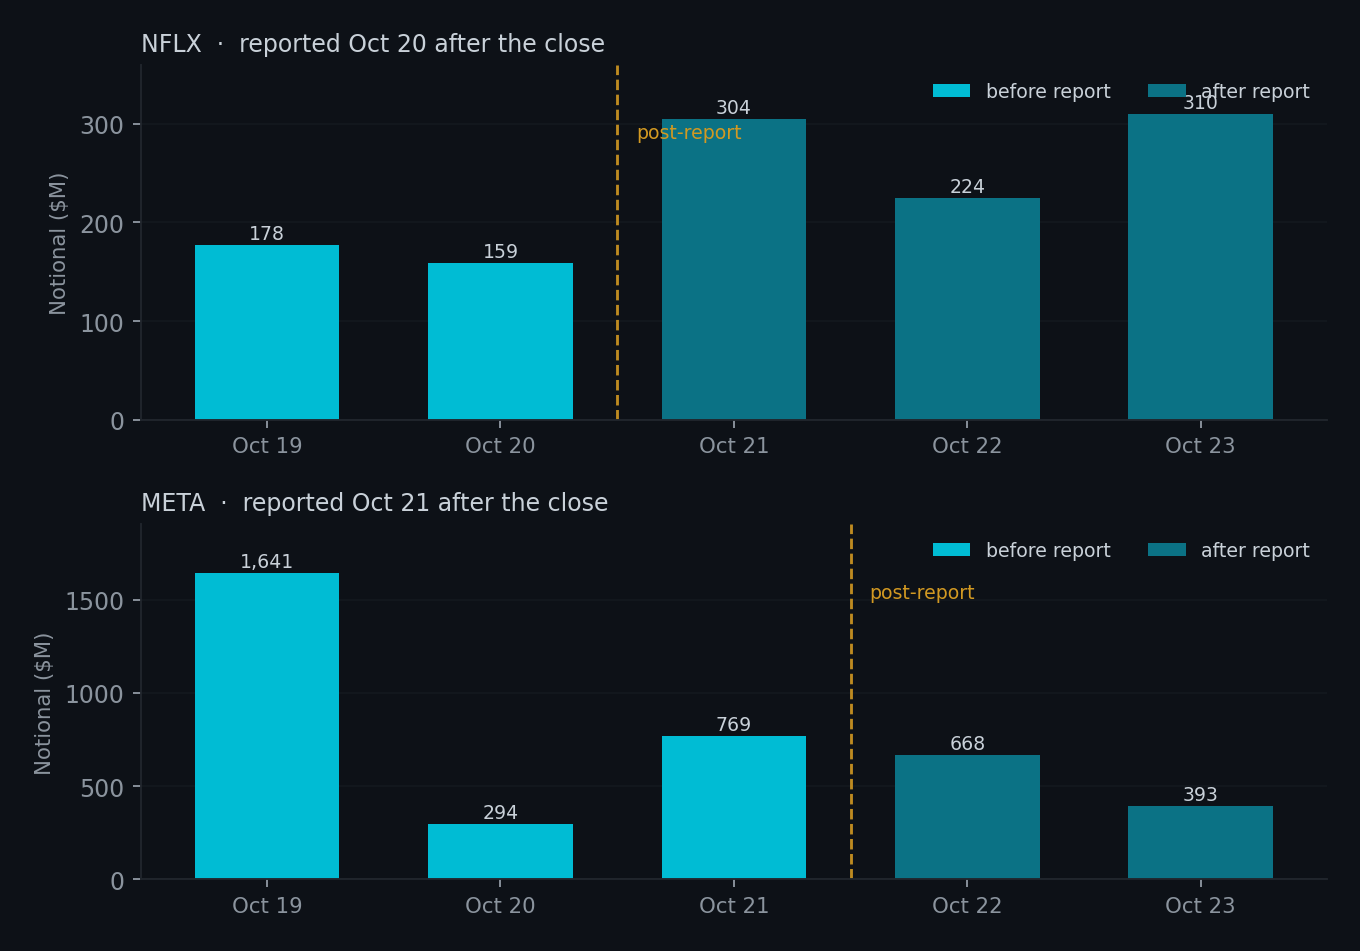
NFLX gapped 2.7 times as far and still closed the week with the smaller drawdown. META added a second
down session after its gap, closing the week 1.5% above its weekly low.
NFLX: the tape got heavier after the drop
Dark pool prints of 50,000 shares or more, opening and closing auctions excluded:
| Session | Shares | Notional | Levels | Avg print |
|---|---|---|---|---|
| Oct 19 | 2,550,131 | $177.5M | 5 | $69.61 |
| Oct 20 | 2,316,717 | $159.3M | 18 | $68.75 |
| Oct 21 | 4,666,130 | $304.5M | 25 | $65.26 |
| Oct 22 | 3,346,803 | $224.3M | 8 | $67.02 |
| Oct 23 | 4,683,769 | $310.0M | 3 | $66.19 |
Split at the report: $336.8M across 4.87M shares and 23 levels before the print (Oct 19–20, average
price $69.20), against $838.8M across 12.70M shares and 36 levels after it (Oct 21–23, average price
$66.06). The week’s notional landed 2.5 times heavier in the two-and-a-half sessions after the report
than in the two before it, and the average print price stepped down $3.14 — which is what an
institution paying up for size looks like when it is working a lower range.
The three largest sessions of the week all followed the report: Oct 21 at 4.67M shares, Oct 23 at
4.68M shares, and Oct 22 at 3.35M. Before the report the biggest session was 2.55M shares.
META: the tape thinned out
| Session | Shares | Notional | Levels | Avg print |
|---|---|---|---|---|
| Oct 19 | 2,328,122 | $1,640.9M | 4 | $704.81 |
| Oct 20 | 424,820 | $294.1M | 3 | $692.20 |
| Oct 21 | 1,090,216 | $769.0M | 5 | $705.37 |
| Oct 22 | 1,027,108 | $668.0M | 8 | $650.38 |
| Oct 23 | 610,688 | $392.8M | 2 | $643.18 |
META ran the opposite way: $2,703.9M across 3.84M shares and 12 levels before the print (Oct
19–21, average $703.57), against $1,060.8M across 1.64M shares and 10 levels after it (Oct 22–23,
average $647.69). Notional fell 61% once the number was out while the average print price dropped
$55.88. The pre-report tape was concentrated: the Oct 19 session alone carried $1.64B.
Two possible readings, and the data does not pick between them. Either the institutional interest
that had been building before the number was satisfied or withdrawn, or the desks simply had no
further size to work at the lower range. What is observable is the shape: heavy pre-event
accumulation, light post-event follow-through, and a pre-report print average of $703.57 left $60.95
above the week’s close.
That gap matters for how you read a dark pool average. META’s weekly average print of $686.88 is not
a level the stock traded at on Friday. It is a record of where size changed hands across five
sessions, most of it before the news. When the news reprices a stock, the average print price becomes
a description of the past, not a support level for the future.
What the option market was doing before the report
Aggregate change in open interest, every strike and expiry combined:
| Date | NFLX call ΔOI | NFLX put ΔOI | META call ΔOI | META put ΔOI |
|---|---|---|---|---|
| Oct 16 | +28,691 | +15,030 | +27,199 | +20,411 |
| Oct 19 | +38,809 | +38,804 | +45,304 | +40,026 |
| Oct 20 | +48,407 | +77,720 | +37,349 | +27,077 |
| Oct 21 | +166,226 | +171,039 | +43,903 | +27,619 |
| Oct 22 | +291,750 | -29,797 | +70,540 | +84,405 |
| Oct 23 | +19,316 | +7,443 | +124,023 | +7,761 |
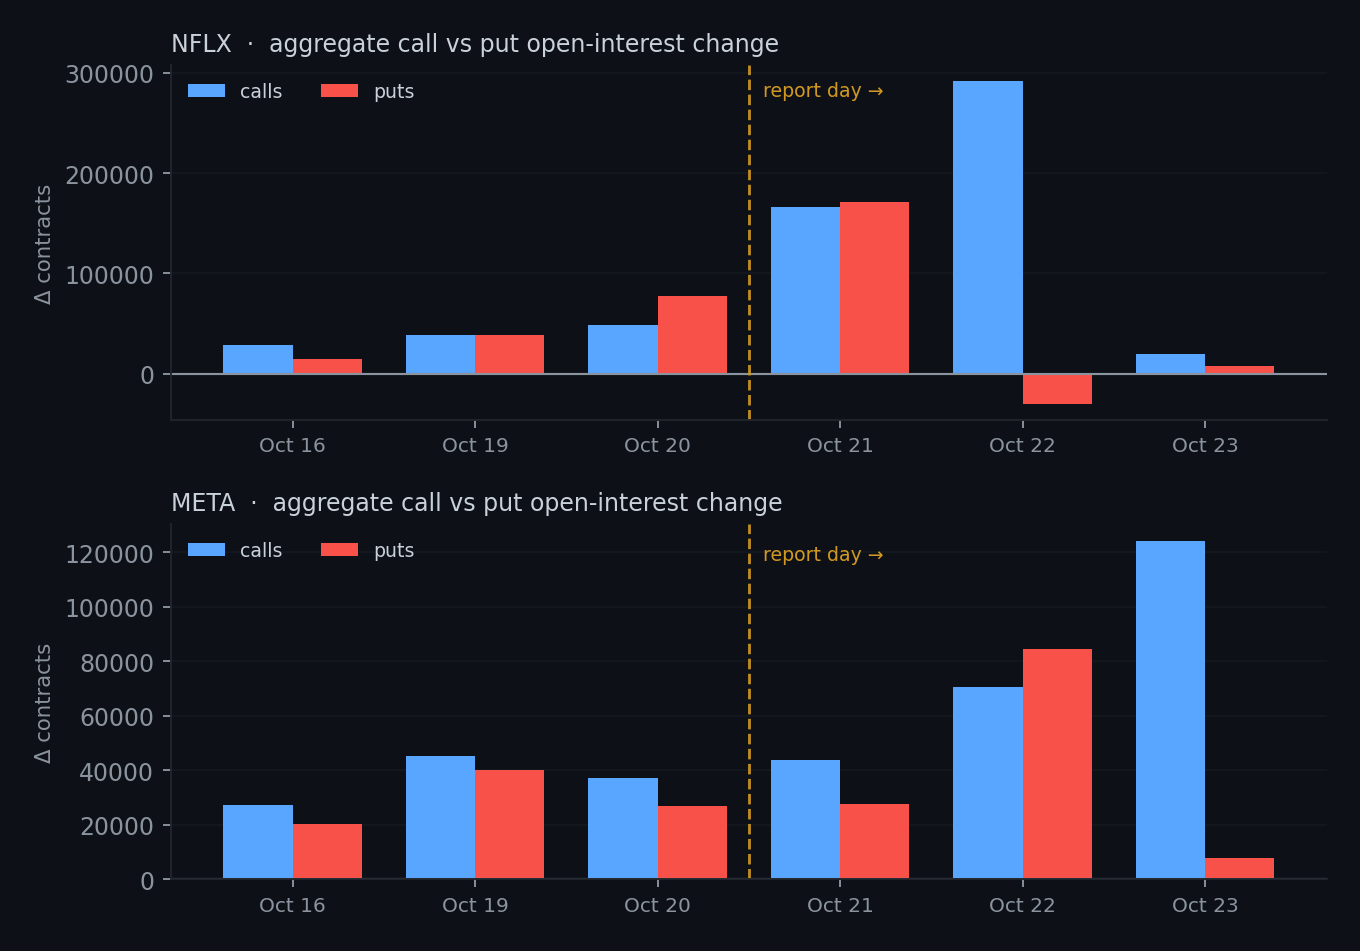
Read the two columns before the event. On NFLX’s report day, put open interest grew by 77,720
contracts against 48,407 for calls — a put-to-call ratio of 1.6 in the day’s new positioning. The
single largest line was the November 13 $58 put, which added 20,625 contracts to 20,915. The same
session added 5,813 to the October 23 $60 put and 5,039 to the October 23 $35 put. Downside
structure was being built on the day of the report, at strikes well below spot.
META’s pre-report sessions leaned the other way. Through Oct 19, Oct 20 and Oct 21 call open
interest rose 45,304, 37,349 and 43,903 while puts added 40,026, 27,077 and 27,619. Calls led on all
three days, and the November 20 $700 call added 3,329 on Oct 19.
One caution that belongs next to any open-interest table: a rising OI figure proves a contract was
created, not who was long it. Buying a call and writing a call both increase call open interest. The
direction lives in trade-level data — premium paid and aggressor side — not in the OI change alone.
The post-event sessions are where the two names separate again. NFLX added 291,750 call contracts on
Oct 22 while put open interest actually fell by 29,797. The additions clustered at one strike: the
January 2027 $100 call added 64,092, the March 2027 $100 call added 47,304, the December 2026 $100
call added 24,843, and the January 2027 $99 call added 14,508. With the stock near $66, a $100
strike sits about 52% above spot. Whether that was bought or written decides whether it is an
upside position or an overwrite, and the OI number alone will not tell you.
Where the open interest sits now
NFLX, spot $65.85, open interest by strike for expiries from October 30 onward:
| Strike | Call OI | Put OI |
|---|---|---|
| $80 | 115,508 | 61,743 |
| $75 | 81,328 | 44,722 |
| $70 | 61,142 | 107,611 |
| $65 | 16,616 | 140,058 |
| $60 | 6,744 | 126,616 |
| $58 | 1,363 | 53,903 |
META, spot $642.62:
| Strike | Call OI | Put OI |
|---|---|---|
| $900 | 52,070 | 216 |
| $830 | 53,369 | 854 |
| $800 | 165,603 | 12,168 |
| $750 | 285,277 | 10,831 |
| $700 | 160,011 | 22,354 |
| $650 | 29,392 | 20,114 |
| $600 | 17,385 | 26,352 |
| $550 | 5,256 | 25,429 |
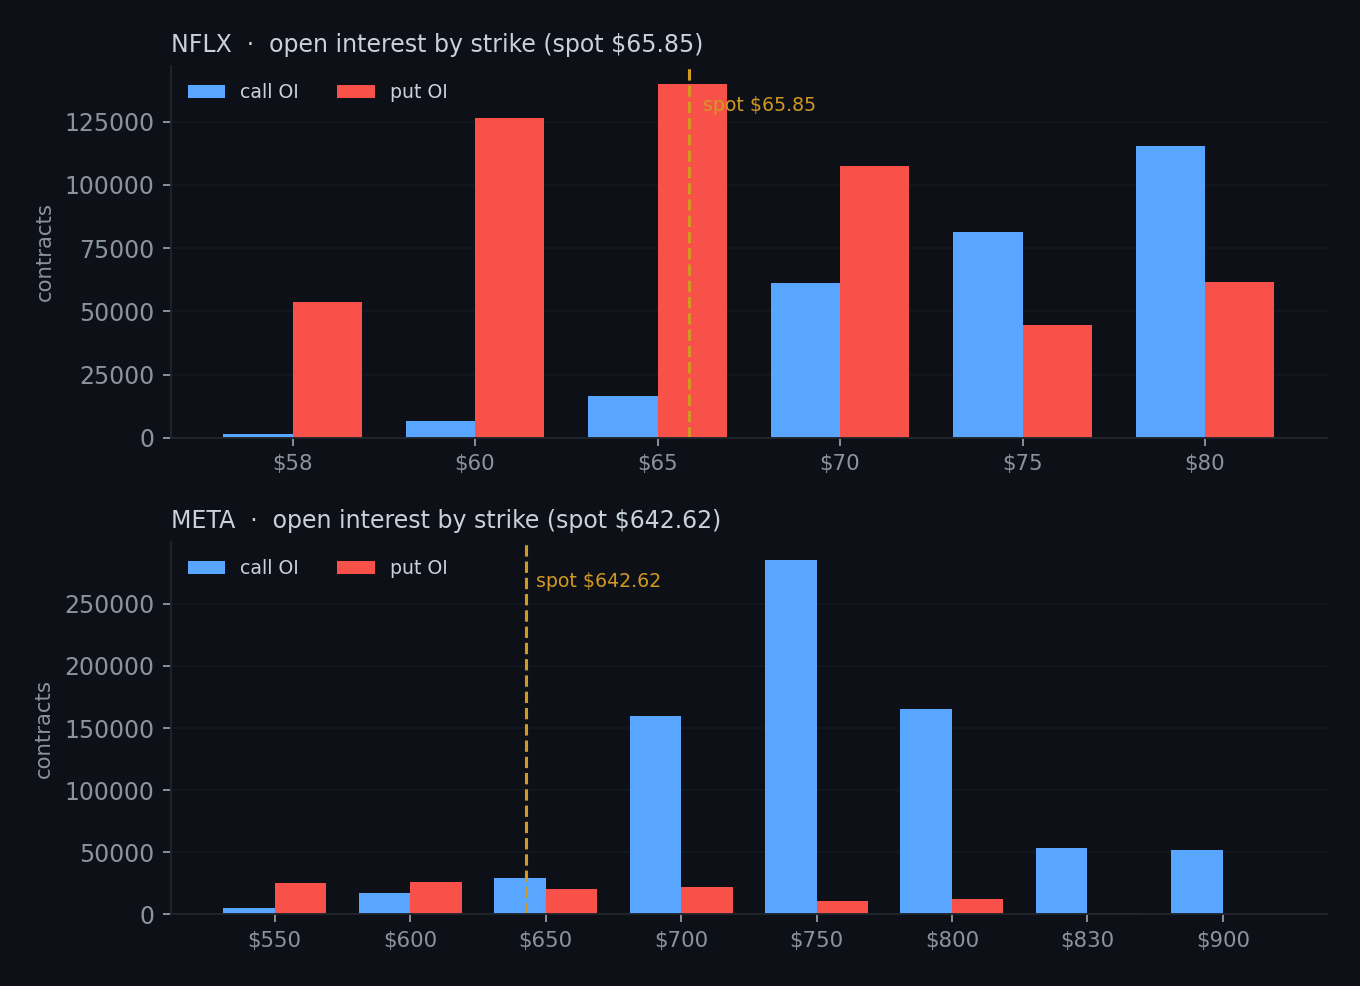
The shapes are nearly mirror images. NFLX sits in a stack: 140,058 puts at $65 and 126,616 at $60
below it, with 115,508 calls at $80 and 81,328 at $75 above. META’s entire concentration is over the
trading range, mostly above spot: $750 holds 285,277 call contracts and $700 another 160,011, with
165,603 at $800. Between $700 and $800 there are 610,891 call contracts. Below spot the put
footprint is thin by comparison.
Strikes carrying that much open interest concentrate hedging flow. They behave as reference points
for the market makers who have to trade around them, which is a different claim from saying they will
hold. The level is where the flow is; it is not a forecast.
Dealer positioning: who is hedging with the move
| Instrument | Net gamma exposure | Stance |
|---|---|---|
| QQQ | -$498.6M | Dealers short gamma |
| NFLX | +$3.2M | Dealers long gamma |
| META | +$28.0M | Dealers long gamma |
This is the part worth carrying into next week. The index book was short gamma while both
post-earnings single names were long gamma. Those are opposite hedging regimes. A dealer who is long
gamma sells into strength and buys into weakness, which dampens the move and pulls price back toward
the strikes where the position sits. A dealer who is short gamma does the reverse: buys as price
rises and sells as it falls, which extends the move.
QQQ’s October 22 session is the illustration. The index ETF fell 2.86%, from $725.20 to $704.47, on
64.6M shares against 30.2M to 37.2M on the days around it. That is a short-gamma book being hedged
into a decline.
A related lesson: what a print price is
The late-print aggregate for QQQ on October 22 reads 72 prints, 7,465,098 shares and an average price
of $725.39, for $5.42B. QQQ’s entire range that session was $701.90 to $715.43 and it closed at
$704.47, so that average sits above the day’s high.
All 72 records carry the identical price of $725.3917: 57 at 103,684 shares and 15 at 103,674,
spread from 10:19 ET to 16:12 ET, all reported through one off-exchange venue. Sixty-six carry
Qualified Contingent Trade and Contingent Trade; six carry Form T and Average Price Trade. Measured
against the prevailing bid at each timestamp, the reported price sits $13.04 to $23.04 above it, an
average of $20.46.
So $725.3917 is a reference price attached to a contingent program, not a price at which 7.4M shares
changed hands in that session. Three checks catch this class of print before it reaches a conclusion:
is the price inside the day’s range; how far is the print from the prevailing bid; and which
condition codes are attached. An average or contingent price will fail the first test every time.
Key takeaway
Dark pool flow tells you where size changed hands, and open interest tells you where contracts were
created. Neither tells you direction on its own. What connected the two this week was regime: NFLX
and META both sat under long-gamma dealer books after their reports, which dampens hedging flow, and
both carried their heaviest open interest above spot. The index book was short gamma, and the index
had its heaviest session of the week on a 2.86% decline. Read the gamma stance first, then the wall,
then the print — and check whether the print price is inside the day’s range before you assign it
meaning.
Data sourced from MobyTick.
Ready to Trade with Whale-Level Insight?
Get institutional-grade dark pool intelligence delivered to your inbox every week.
Disclaimer: This newsletter is for informational and educational purposes only. It does not constitute financial advice, investment recommendations, or solicitation to buy or sell securities. Trading stocks, ETFs, and options involves substantial risk of loss. Past performance is not indicative of future results.