Market Overview
Small caps finished the week higher while the S&P 500, Dow and Nasdaq slipped. SPY closed at 755.72, down 0.56% for the week, and QQQ fell 1.97% to 690.49. IWM gained 1.30% to 279.33 and DIA lost 0.81% to 517.13. The S&P 500 ended at 7,580.07, down 0.6%, and the Nasdaq Composite at 25,437.00, down 2.0%. On Friday the S&P 500 fell 1.82% and the Nasdaq 2.86%, the worst day for each since June.
| ETF | Open | High | Low | Close | Week % |
|---|---|---|---|---|---|
| SPY | 762.25 | 773.36 | 750.36 | 755.72 | -0.56% |
| QQQ | 707.06 | 726.14 | 683.45 | 690.49 | -1.97% |
| IWM | 276.17 | 285.26 | 276.00 | 279.33 | +1.30% |
| DIA | 523.89 | 525.77 | 515.01 | 517.13 | -0.81% |
Nine of the eleven sector funds finished the week higher. XLK and XLC were the only two that fell.
| Sector ETF | Sector | Week % |
|---|---|---|
| XLV | Health Care | +3.12% |
| XLB | Materials | +2.79% |
| XLU | Utilities | +2.04% |
| XLY | Consumer Discretionary | +2.02% |
| XLI | Industrials | +1.69% |
| XLRE | Real Estate | +1.41% |
| XLP | Consumer Staples | +1.31% |
| XLF | Financials | +1.09% |
| XLE | Energy | +1.00% |
| XLK | Technology | -2.03% |
| XLC | Communication Services | -5.32% |
What Led and What Lagged
XLV led at 3.12%, followed by XLB at 2.79%, XLU at 2.04% and XLY at 2.02%. XLI, XLRE, XLP, XLF and XLE each gained between 1.00% and 1.69%. XLK fell 2.03% and XLC 5.32%.
Alphabet reported after the close on October 28. EPS was $2.67 against a $3.02 consensus, and revenue was $127.58B against $128.22B. Free cash flow was -$9.07B, Q3 capex was $51.36B and Cloud revenue was $30.7B, up 103%. The company held its 2026 capex guidance at $195–205B. GOOGL fell 12.64% on Thursday and 12.61% for the week. Microsoft beat the same evening, with EPS of $4.89 against $4.73 and Azure up 48%. Its capex of $45.2B came in under the $50.67B consensus, and it trimmed its capex forecast to about $170B from about $175B. MSFT slipped 0.16% on Thursday and 0.50% for the week.
Amazon missed on revenue and EPS after Thursday’s close. AWS revenue was $45.98B, up 39%, and Q3 capex was $77.3B against a $58.7B consensus. Trailing twelve-month free cash flow was -$42.4B. AMZN fell 4.25% Thursday and 1.41% Friday, for a 3.08% weekly loss. Intel’s Q4 guidance came in below consensus. INTC fell 28.58% Friday and 24.38% for the week. Reddit beat on Q3 but guided Q4 below consensus, and RDDT dropped 29.22% Friday and 36.4% for the week. META, which reported October 21, fell 4.30% this week, NFLX 5.73% and PLTR 6.42%. TSLA gained 7.41%. FactSet counted 60% of the S&P 500 reported, with 82% beating on EPS by an average of 1.9%.
All four index ETFs closed lower on Friday. QQQ fell 3.47%, SPY 1.77%, IWM 1.65% and DIA 1.07%. QCOM lost 11.12%, AMD 10.88% and NVDA 4.22%, while XOM gained 2.16% and CVX 1.75%.
Rates and Crude
The FOMC held rates at 3.75%–4.00% on October 28. Lisa Cook and Beth Hammack dissented in favor of a 25 basis point hike. The 10-year yield ended near 4.93%, compared with 5.00% on October 23, a drop of about 7 basis points. The 2-year fell about 10 basis points, from 4.69% to near 4.59%. Q3 GDP rose 3.4% in the advance estimate. September PCE was up 3.6% from a year earlier, and core PCE was up 3.1%.
For the week, USO slipped 0.41%, GLD fell 2.95% and TLT added 0.61%. The VIX closed at 19.42, compared with 19.45 the Friday before, after hitting a low of 16.91 on Wednesday.
Dark Pool Flow
MobyTick counts prints of 50,000 shares or more and excludes the opening and closing auctions. Broad-market ETF flow totaled $20.2B. SPY led with $9.57B, followed by QQQ at $6.41B, IVV at $2.76B, VOO at $1.29B and IWM at $139.8M.
AAPL led the single names at $9.31B, averaging $345.46. META printed $4.87B at $620.79, MU $4.44B at $930.79 and NVDA $3.42B at $210.99. GOOGL printed $3.16B at $289.66, MSFT $2.39B at $527.27 and AMZN $1.44B at $246.91. INTC printed $1.33B at $76.06. TSLA printed $770M at $395.70 and XOM $706M at $184.63.
All 16 big-tech and communications names in the flow closed below their dark pool averages, on a combined $36.2B.
Last Week’s Scorecard
For October 26 to 30, 12 of 13 tickers crossed at least one trigger, and they reached 30 reference levels: 8 upper and 22 lower. GOOGL reached all 6 lower levels. QQQ reached 3 upper and 4 lower levels, with a low of 683.45, and HOOD reached 4 lower. META reached 3 lower levels. SPY reached 1 upper (772.50) and 2 lower, and its 750.36 low stopped 0.36 short of 750.00. AAPL reached 2 lower, XOM 2 upper, and IWM (285.00), MDT and KO 1 each. CVX and GME crossed a trigger without reaching a level, and PG did not trigger on either side.
On the Calendar
ISM Manufacturing is out Monday, November 2. AAPL and PLTR report after the close that day. Tuesday brings the midterm elections and JOLTS, and AMD reports after the close. ISM Services follows Wednesday, and October payrolls come Friday, November 6. The next FOMC meeting is December 8–9.
| Date | Event |
|---|---|
| Mon Nov 2 | ISM Manufacturing (Oct) |
| Mon Nov 2 | AAPL earnings, after close |
| Mon Nov 2 | PLTR earnings, after close |
| Tue Nov 3 | Midterm elections |
| Tue Nov 3 | JOLTS |
| Tue Nov 3 | AMD earnings, after close |
| Wed Nov 4 | ISM Services (Oct) |
| Fri Nov 6 | October payrolls |
| Dec 8–9 | FOMC meeting |
IWM gained 1.30% on the week while QQQ fell 1.97%.
Last Week’s Callout Performance
| Ticker | Upper Level | Lower Level | High | Low | Close | Observed Side | Reference Levels Reached | Range From Reference |
|---|---|---|---|---|---|---|---|---|
| SPY | $770.00 | $757.50 | $773.36 | $750.36 | $755.72 | Upper and lower | Upper: 1 of 6 → R1 $772.50 · Lower: 2 of 5 → R2 $752.50 | Upper +0.44% · Lower -0.94% |
| QQQ | $712.50 | $700.00 | $726.14 | $683.45 | $690.49 | Upper and lower | Upper: 3 of 6 → R3 $725.00 · Lower: 4 of 5 → R4 $690.00 | Upper +1.91% · Lower -2.36% |
| IWM | $282.50 | $270.00 | $285.26 | $276.00 | $279.33 | Upper | Upper: 1 of 5 → R1 $285.00 | Upper +0.98% |
| MDT | $96.75 | $93.00 | $98.09 | $93.04 | $96.54 | Upper | Upper: 1 of 4 → R1 $98.00 | Upper +1.39% |
| AAPL | $352.50 | $340.00 | $351.43 | $334.35 | $344.63 | Lower | Lower: 2 of 5 → R2 $335.00 | Lower -1.66% |
| XOM | $184.00 | $176.50 | $188.50 | $179.77 | $187.25 | Upper | Upper: 2 of 5 → R2 $187.50 | Upper +2.45% |
| CVX | $235.00 | $219.50 | $236.48 | $227.63 | $235.52 | Upper | Upper: 0 of 5 | Upper +0.63% |
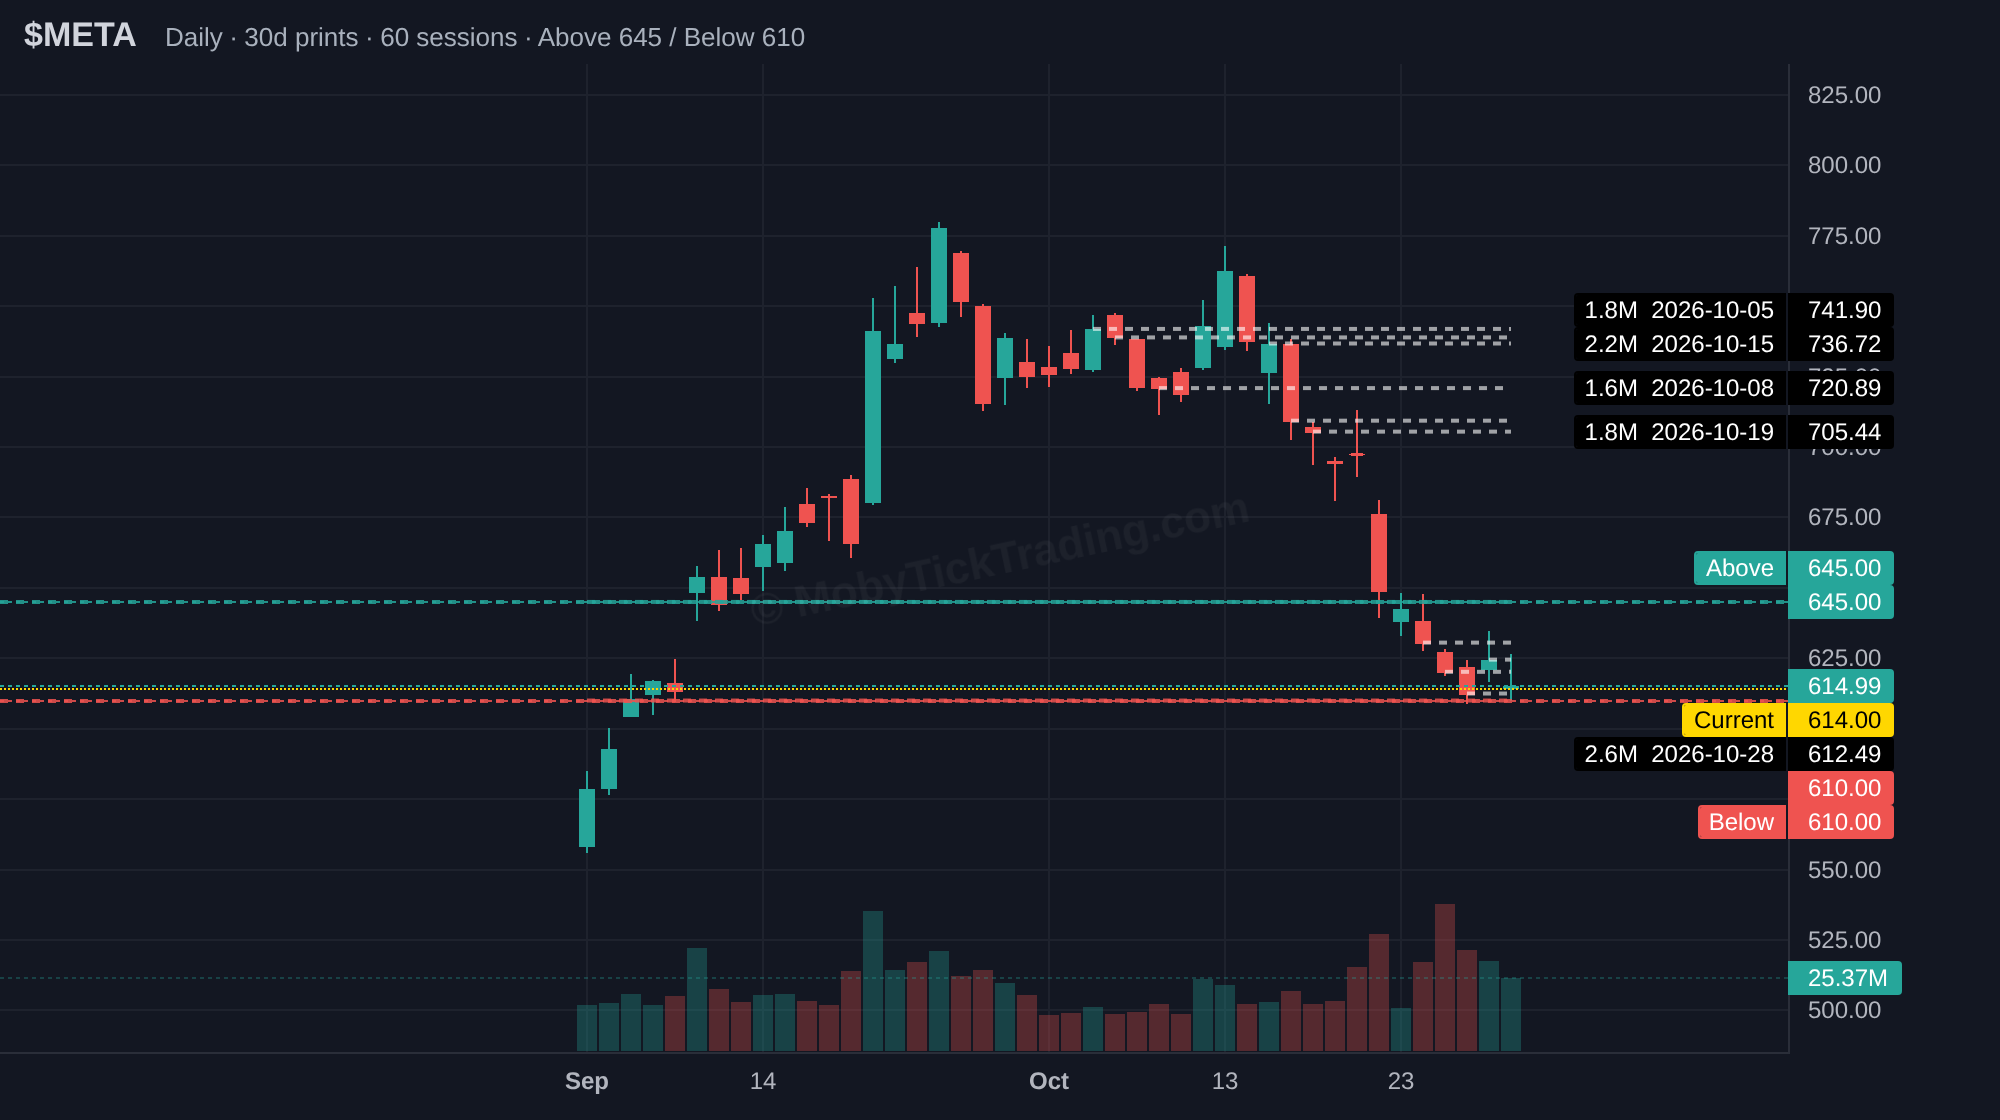
| META | $667.50 | $630.00 | $647.69 | $609.00 | $614.99 | Lower | Lower: 3 of 6 → R3 $610.00 | Lower -3.33% |
| GOOGL | $335.00 | $320.00 | $326.40 | $276.92 | $279.84 | Lower | Lower: 6 of 6 → R6 $280.00 | Lower -13.46% |
| PG | $167.00 | $157.00 | $165.36 | $157.40 | $161.57 | None | 0 of 0 | — |
| HOOD | $100.00 | $93.00 | $96.71 | $82.00 | $84.99 | Lower | Lower: 4 of 5 → R4 $82.50 | Lower -11.83% |
| KO | $95.50 | $92.50 | $95.08 | $90.58 | $94.08 | Lower | Lower: 1 of 6 → R1 $91.00 | Lower -2.08% |
| GME | $26.50 | $24.50 | $24.99 | $23.07 | $24.23 | Lower | Lower: 0 of 4 | Lower -5.84% |
Upper-side observations: 6 · Lower-side observations: 8 · No crossing recorded: 1
Tickers reaching ≥1 reference level: 10 · Total reference levels reached: 30
This Week’s Callouts — Upper Reference Levels
| Ticker | Upper Reference | Reference Levels |
|---|---|---|
| SPY | $765.00 | $767.50 → $770.00 → $772.50 → $775.00 → $780.00 |
| QQQ | $700.00 | $704.00 → $710.00 → $712.00 → $715.00 → $720.00 |
| IWM | $285.25 | $287.14 → $290.00 → $291.50 → $295.00 → $297.50 → $300.00 |
| CMCSA | $24.00 | $24.50 → $25.00 → $25.50 → $26.00 → $26.50 → $27.00 |
| NFLX | $65.00 | $66.50 → $67.50 → $69.00 → $70.00 → $71.00 → $72.50 → $75.00 |
| TSLA | $412.50 | $420.00 → $425.00 → $430.00 → $435.00 → $440.00 |
| PLTR | $202.50 | $205.00 → $207.50 → $210.00 → $212.50 → $215.00 |
| MU | $985.00 | $1,000.00 → $1,020.00 → $1,045.00 → $1,065.00 |
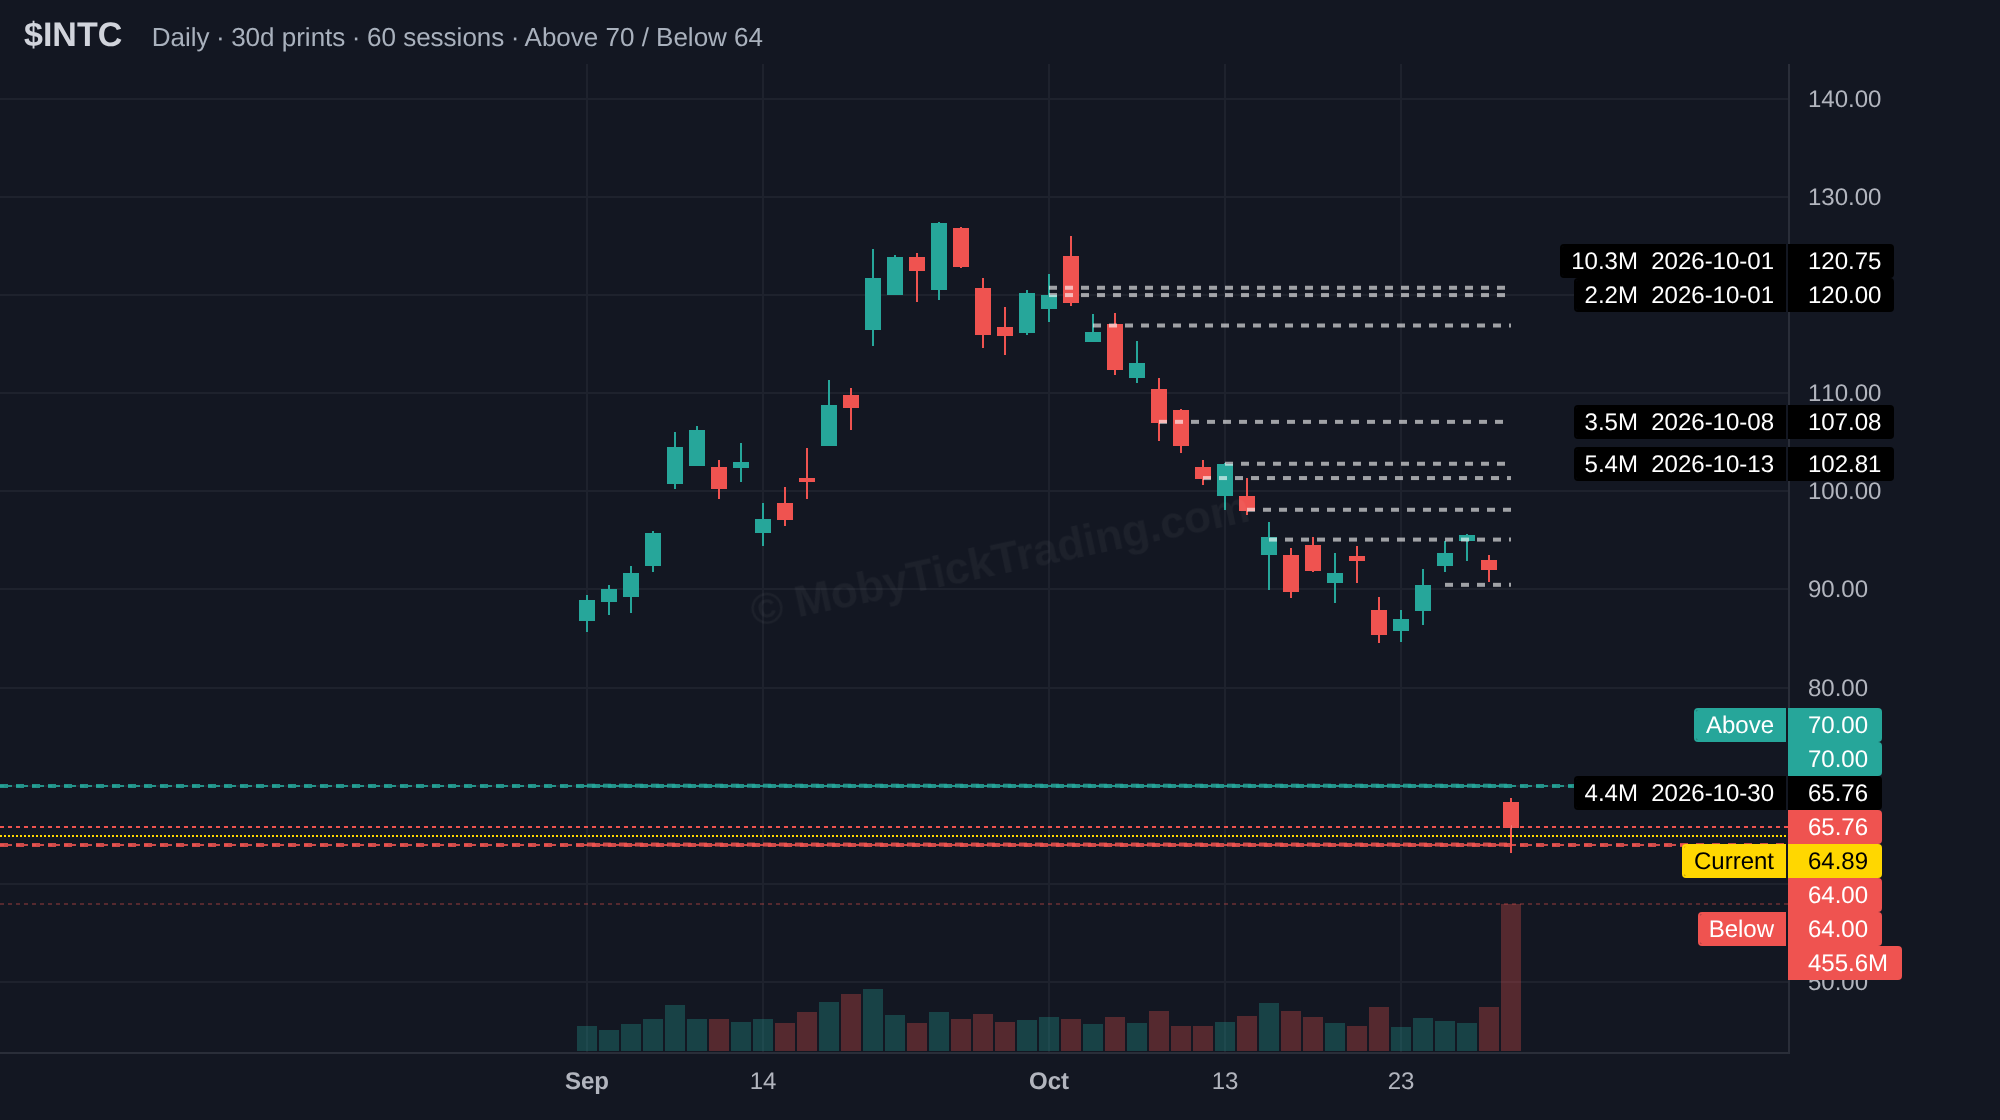
| INTC | $70.00 | $72.50 → $75.00 → $77.50 → $79.00 → $80.00 → $82.50 → $85.00 |
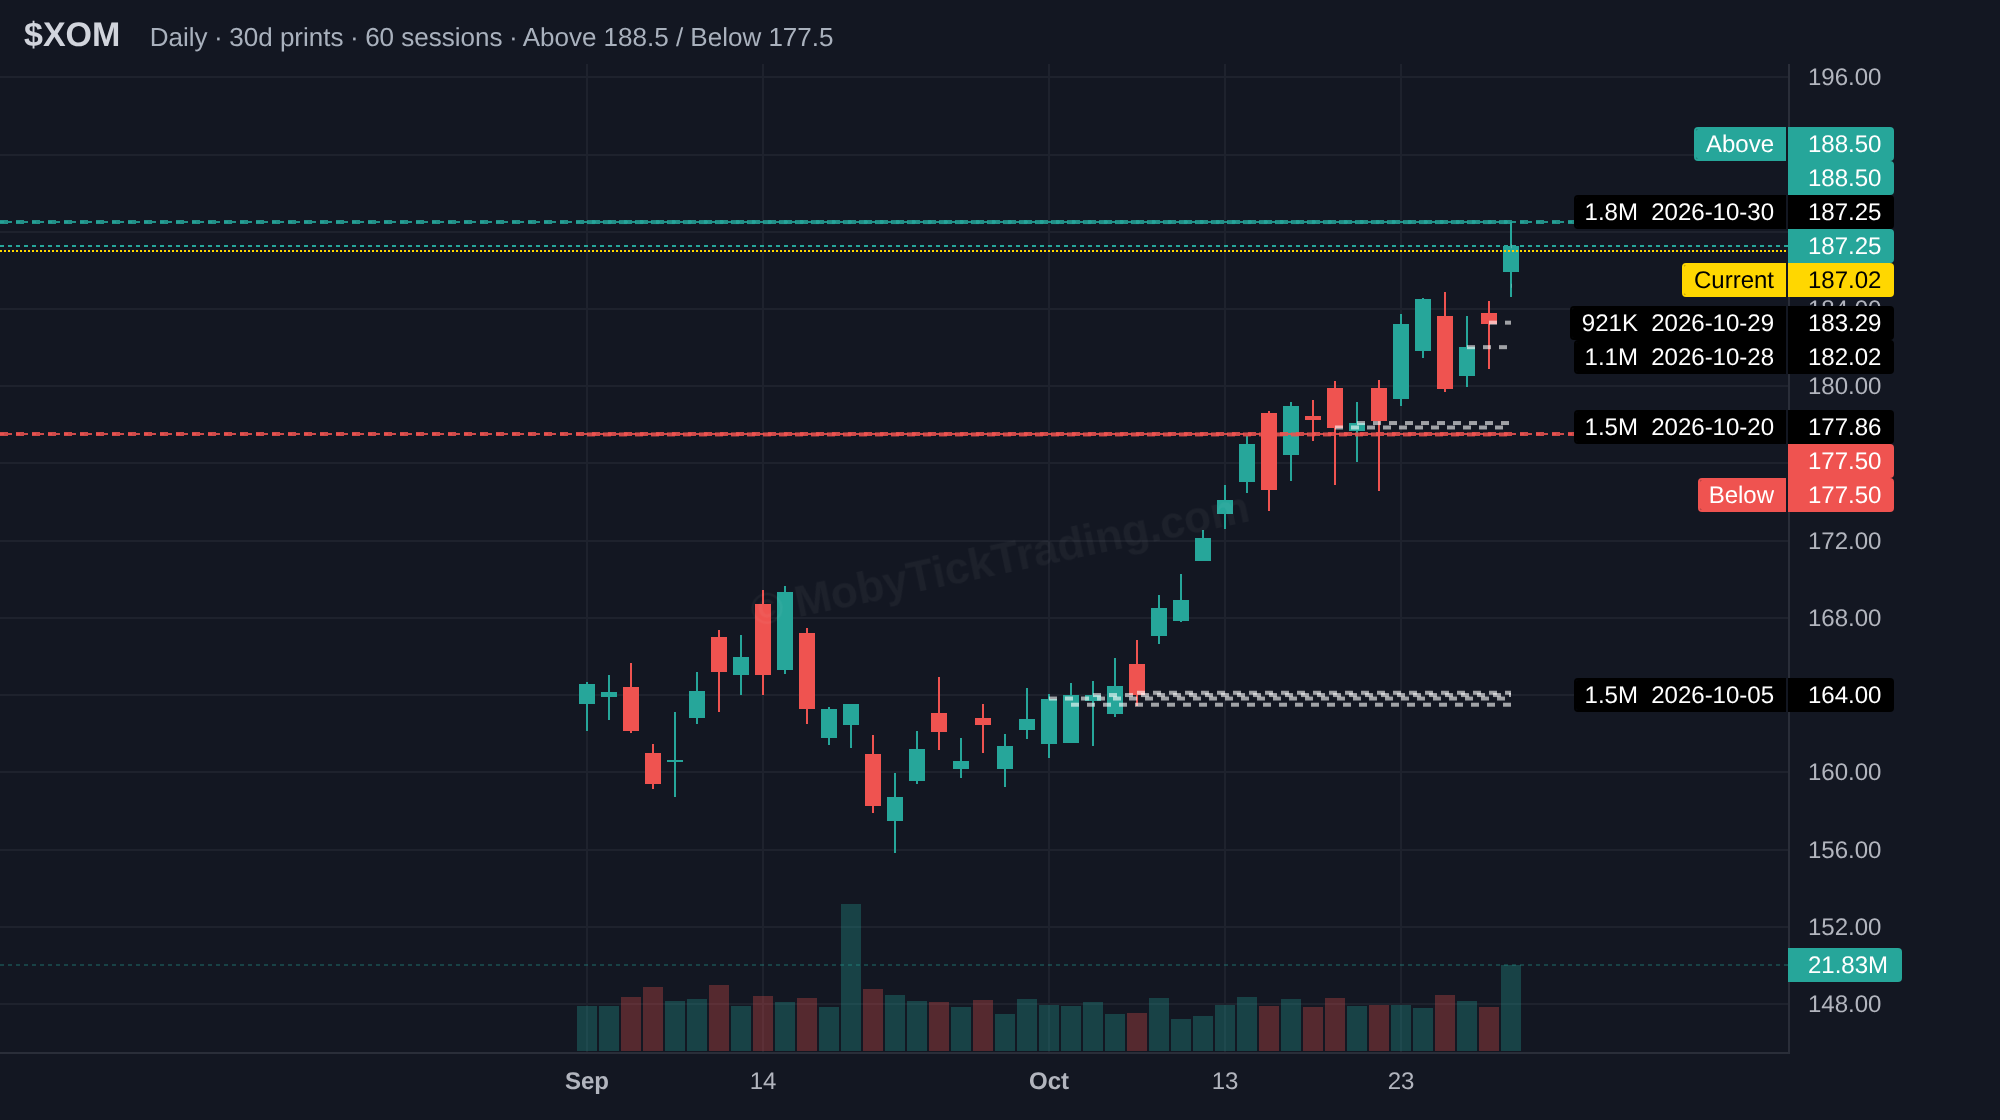
| XOM | $188.50 | $190.00 → $192.50 → $195.00 → $197.50 → $200.00 |
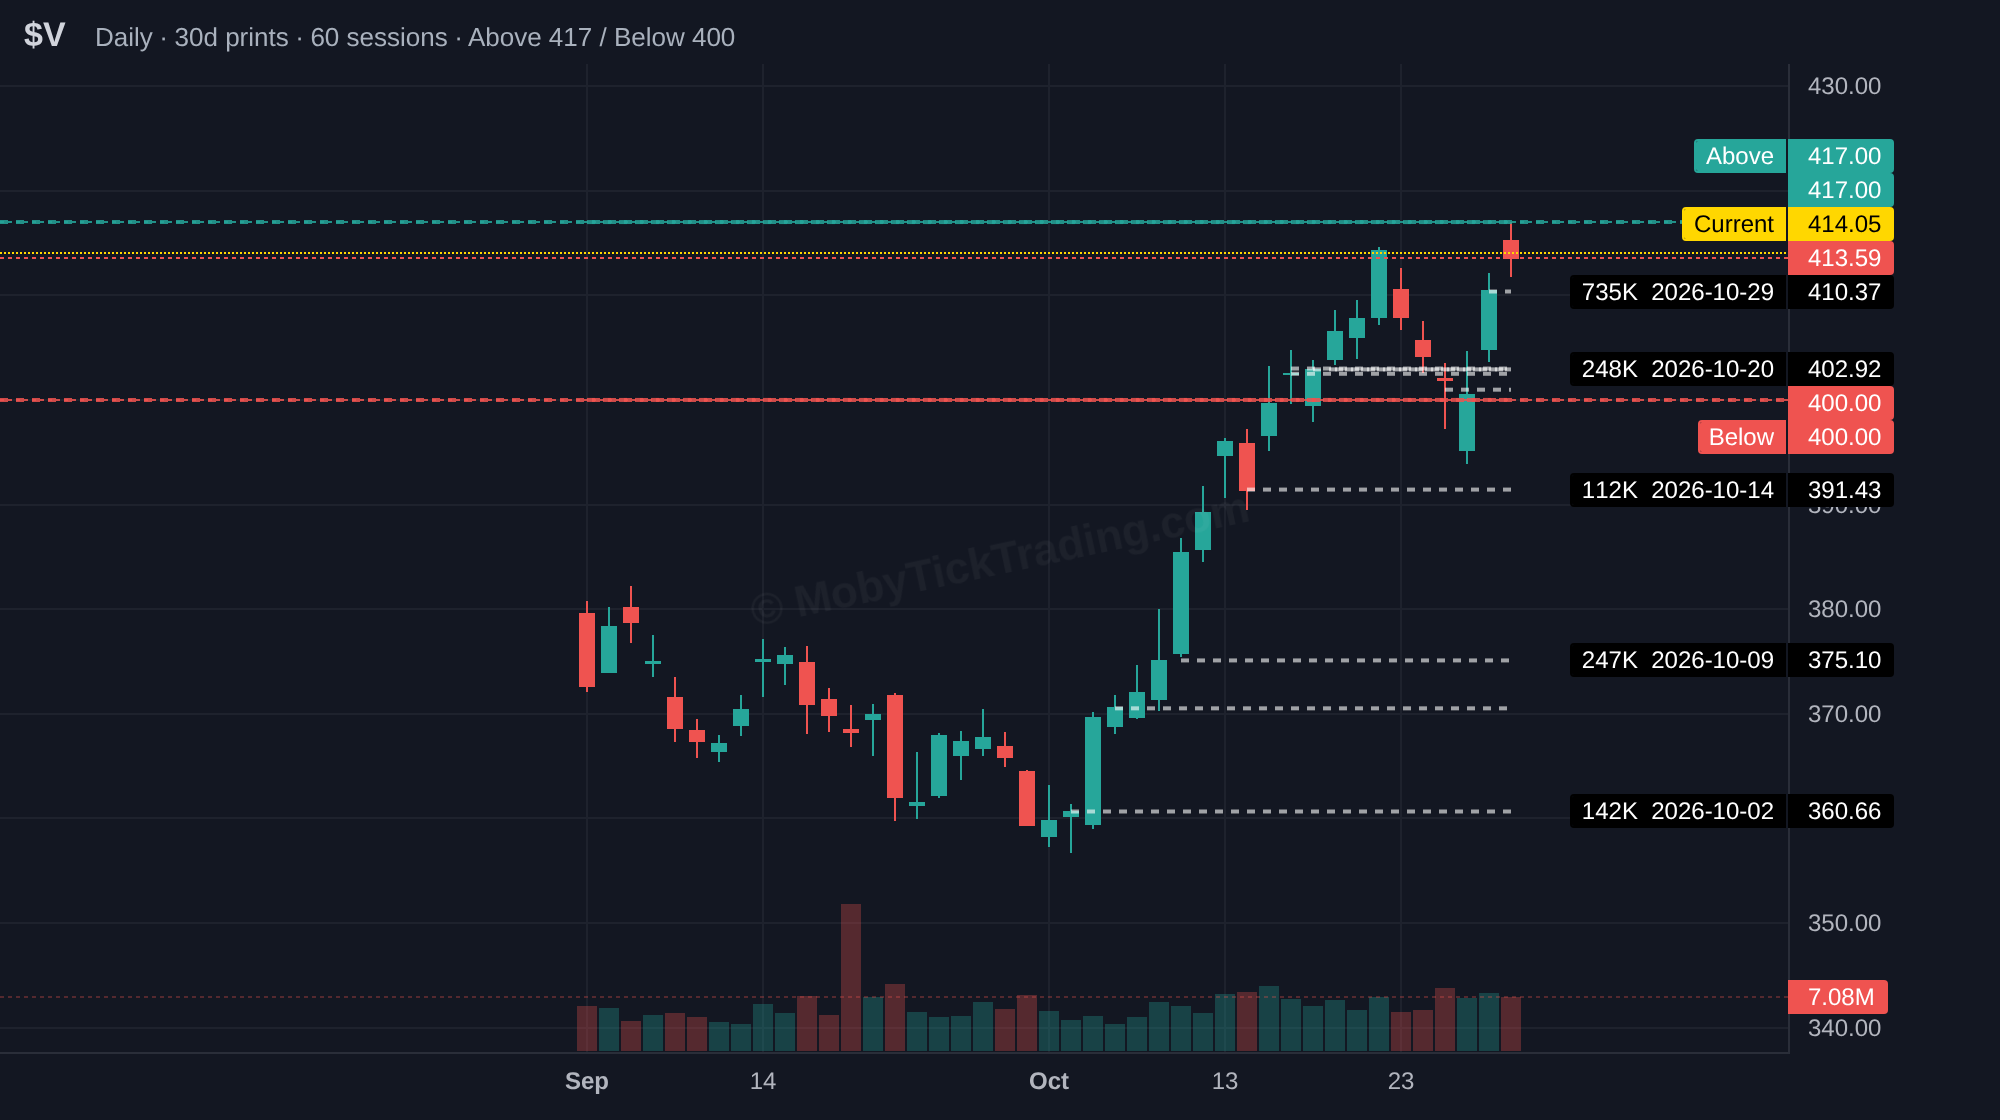
| V | $417.00 | $420.00 → $422.50 → $425.00 → $430.00 |
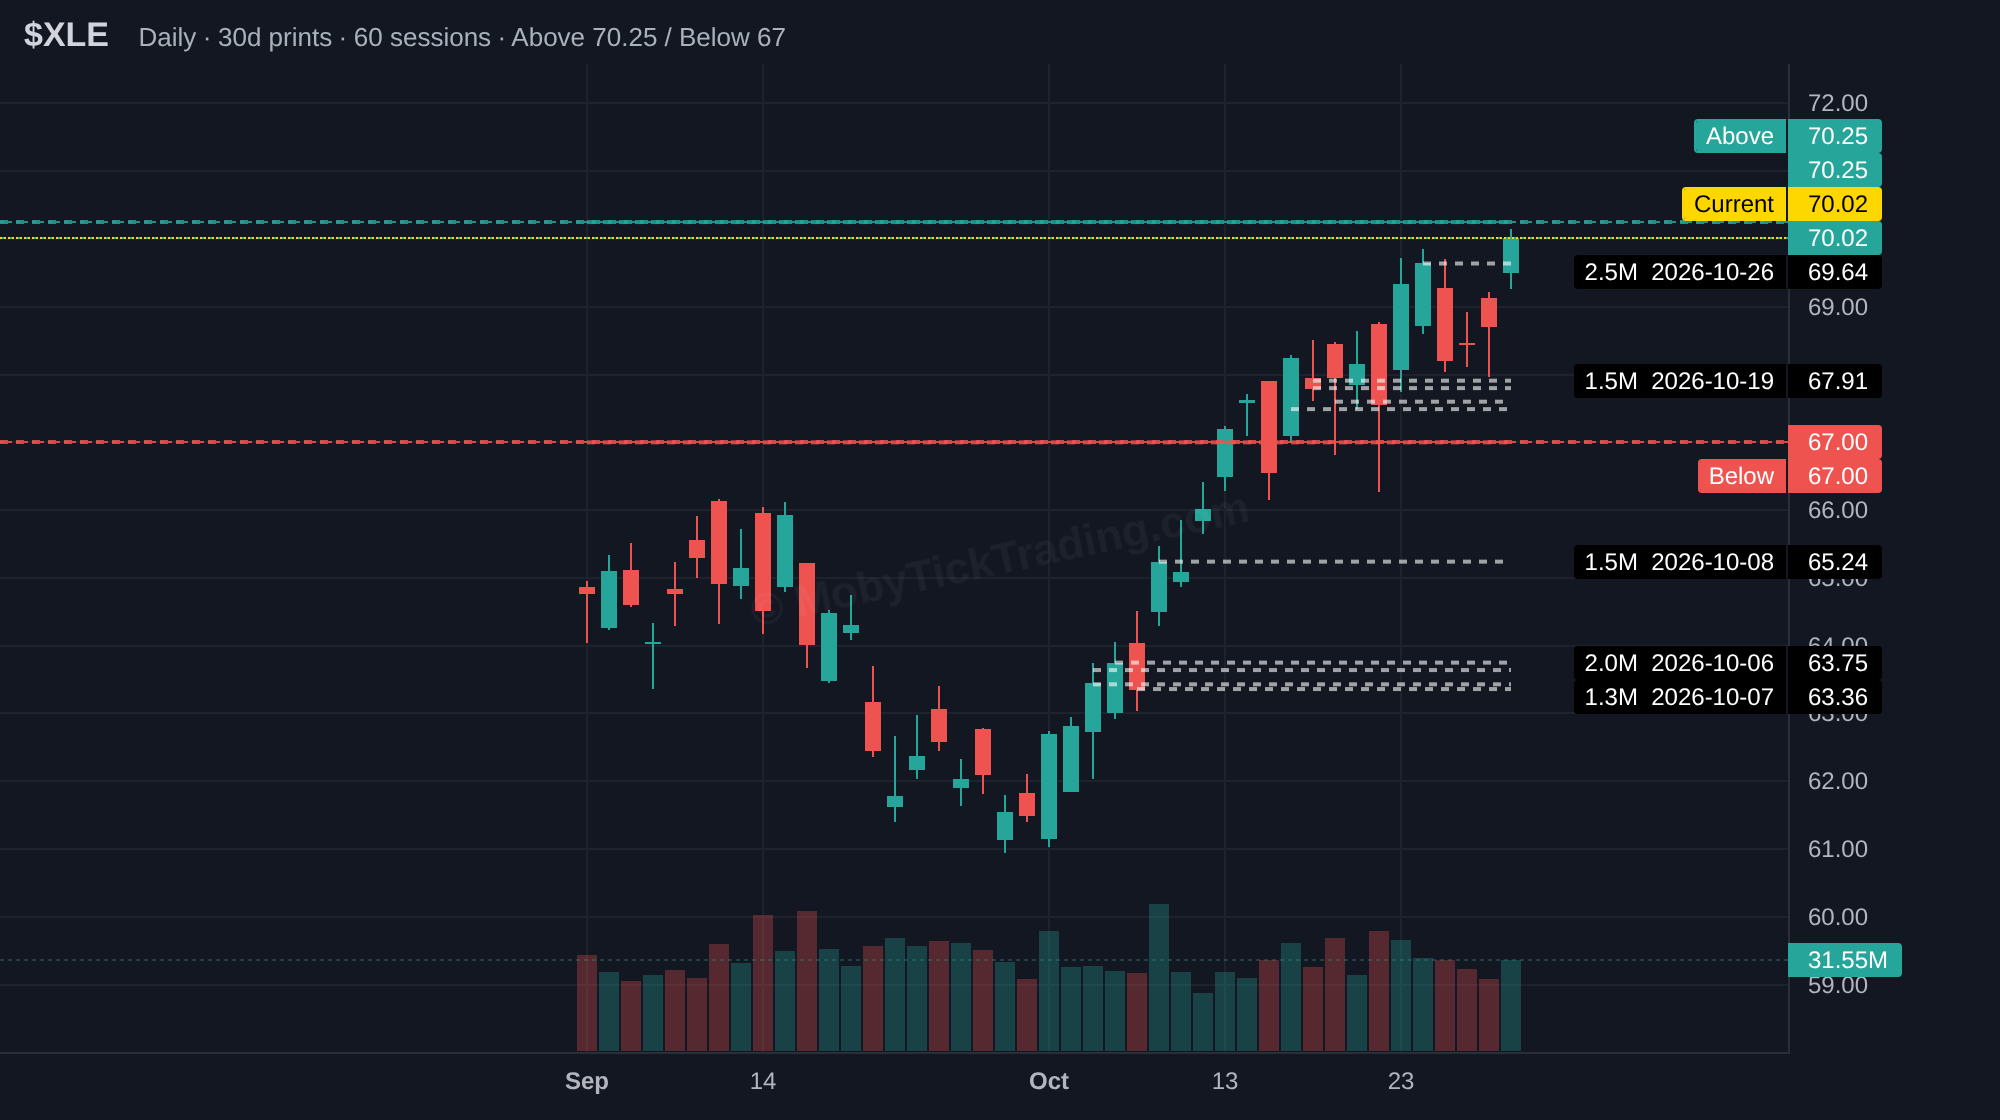
| XLE | $70.25 | $71.00 → $72.50 → $73.75 → $75.00 |
| META | $645 | $650 → $660 → $675 → $700 → $705.44 |
This Week’s Callouts — Lower Reference Levels
| Ticker | Lower Reference | Reference Levels |
|---|---|---|
| SPY | $750.00 | $745.00 → $740.00 → $735.00 → $730.00 |
| QQQ | $682.50 | $680.00 → $675.00 → $672.70 → $670.00 → $665.00 → $661.48 |
| IWM | $276.50 | $275.00 → $272.50 → $270.00 → $267.50 → $265.00 |
| CMCSA | $21.40 | $20.00 → $19.50 → $19.00 → $18.00 → $17.50 |
| NFLX | $60.00 | $58.25 → $57.50 → $56.25 → $55.00 → $52.50 → $50.00 |
| TSLA | $387.00 | $382.50 → $380.00 → $375.00 → $370.00 → $365.00 → $360.00 |
| PLTR | $180.00 | $177.50 → $175.00 → $170.00 → $167.50 → $165.00 |
| MU | $855.00 | $840.00 → $820.00 → $800.00 → $788.00 → $775.00 → $750.00 → $700.00 |
| INTC | $64.00 | $62.50 → $60.00 → $57.50 → $55.00 → $52.50 → $50.00 |
| XOM | $177.50 | $175.00 → $172.50 → $170.00 |
| V | $400.00 | $397.50 → $395.00 → $392.50 → $390.00 → $388.75 → $385.00 |
| XLE | $67.00 | $66.25 → $65.00 → $64.60 → $63.25 → $62.00 → $61.00 |
| META | $610 | $600 → $575 → $550 → $540 → $530 |
This Week’s Callouts — Ticker Detail
Each card below shows dark pool flow data for the past week, along with reference levels for the upcoming week. Dark pool statistics are sourced from MobyTick’s proprietary analytics.
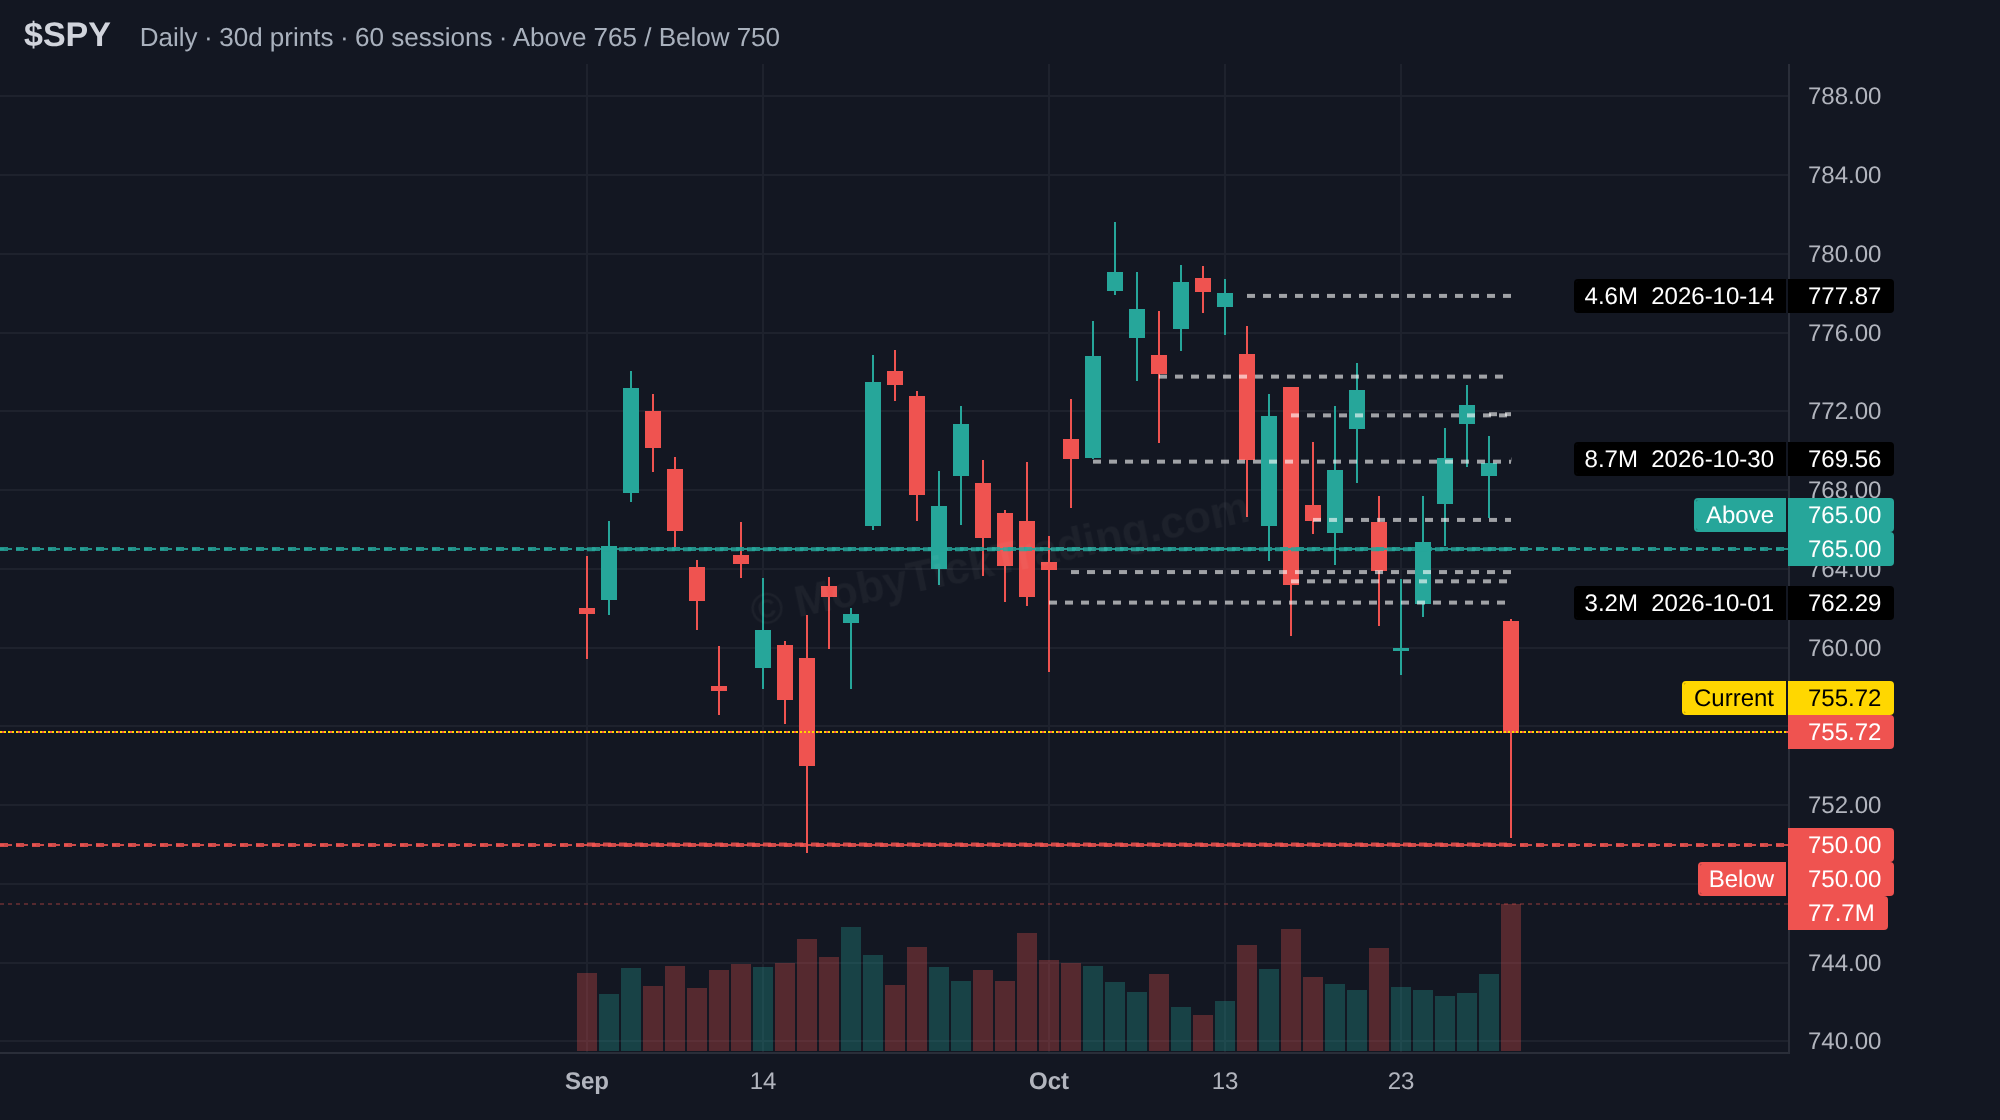
SPY
Upper reference $765.00 → $767.50 → $770.00 → $772.50 → $775.00 → $780.00
Lower reference $750.00 → $745.00 → $740.00 → $735.00 → $730.00
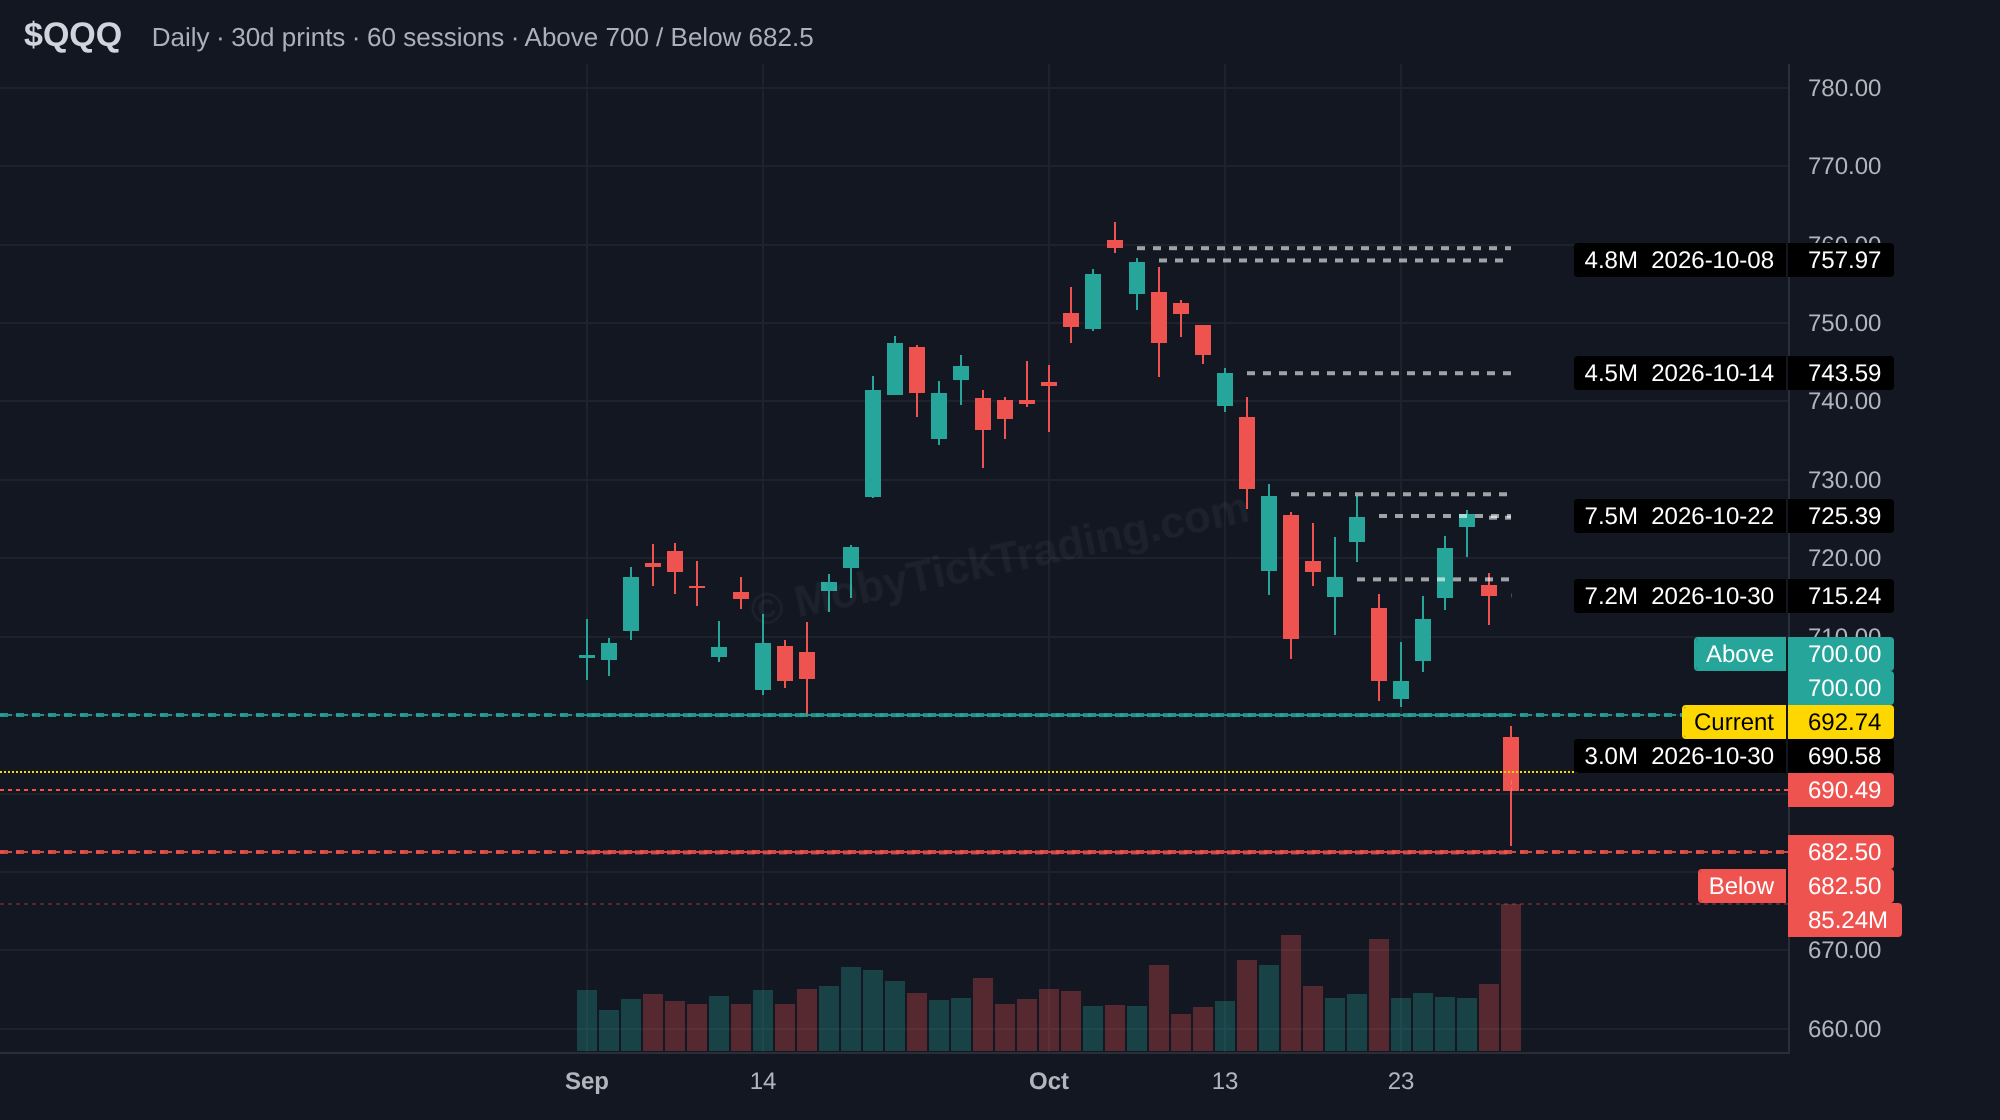
QQQ
Upper reference $700.00 → $704.00 → $710.00 → $712.00 → $715.00 → $720.00
Lower reference $682.50 → $680.00 → $675.00 → $672.70 → $670.00 → $665.00 → $661.48
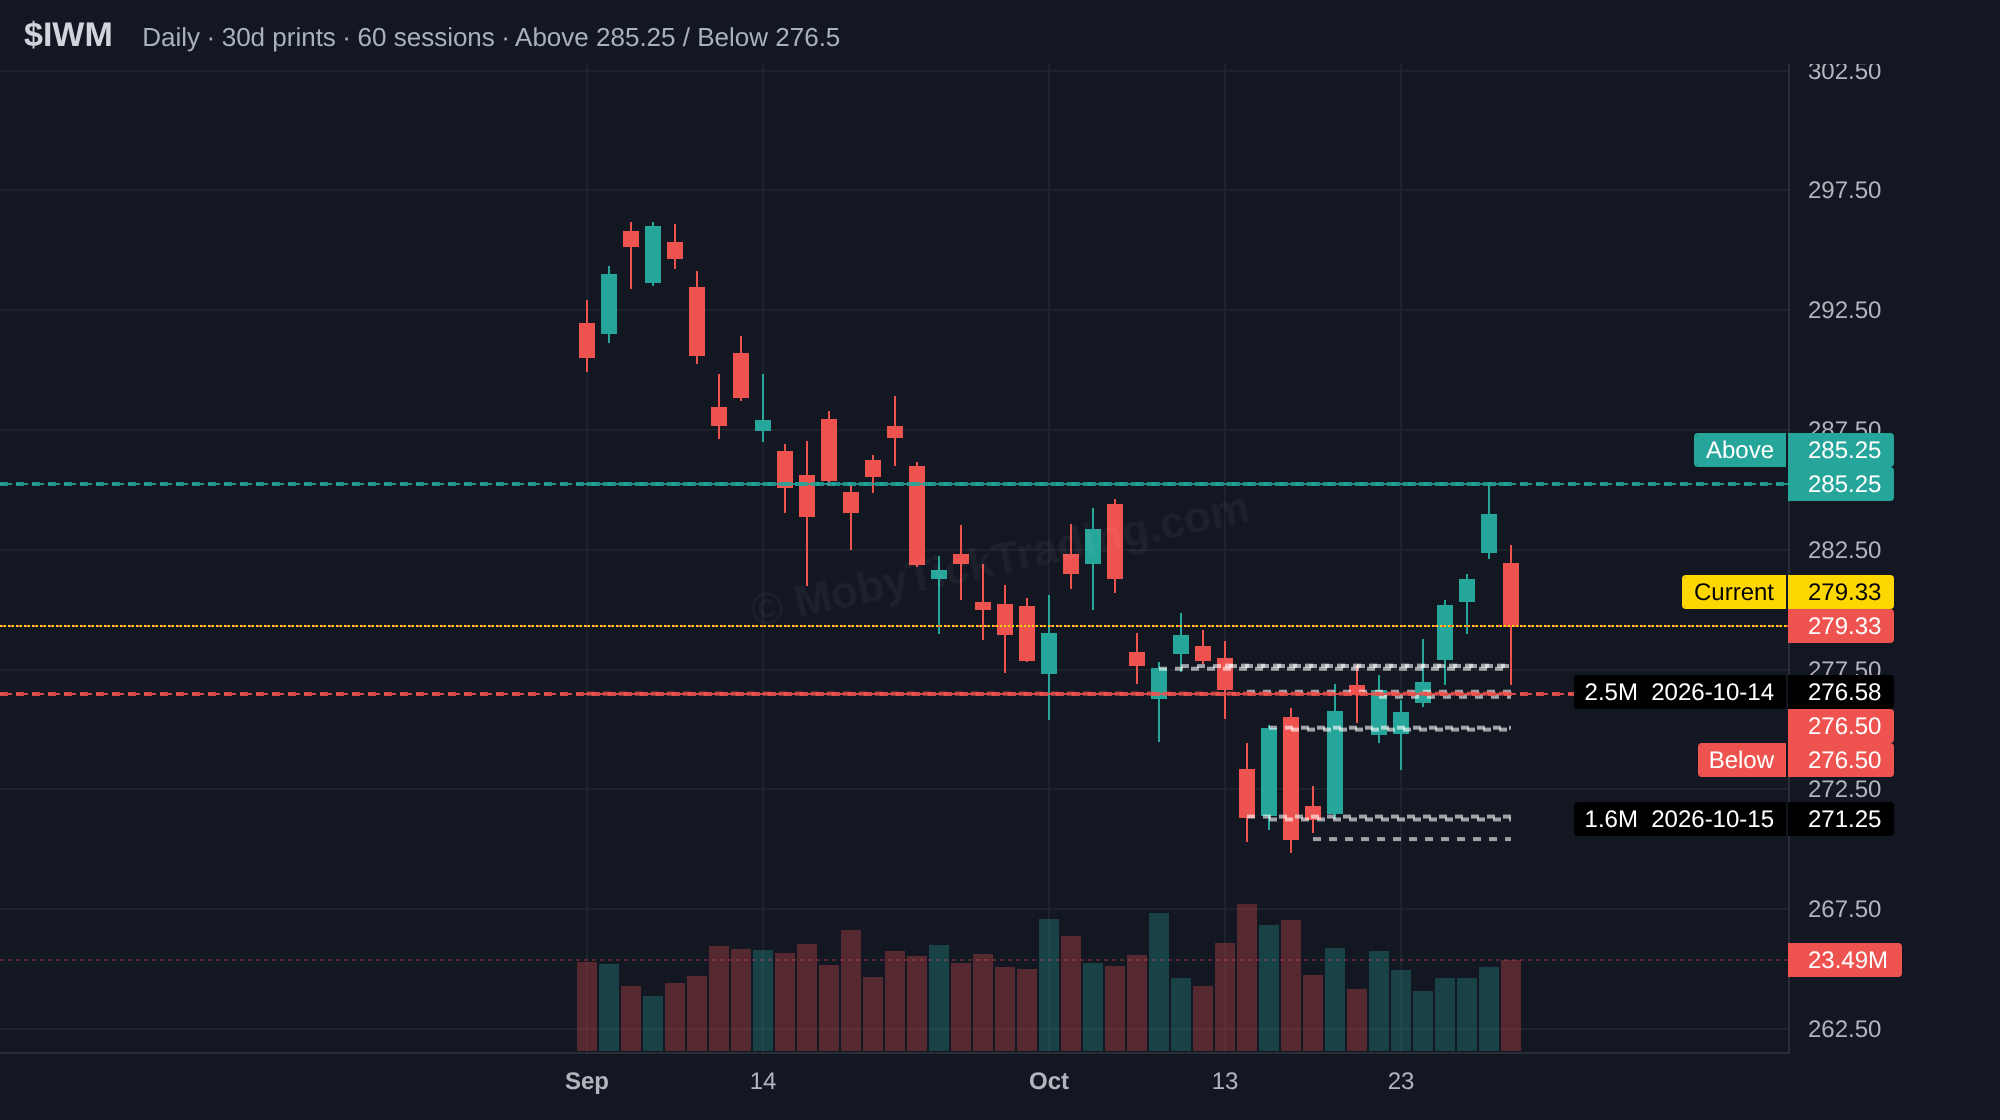
IWM
Upper reference $285.25 → $287.14 → $290.00 → $291.50 → $295.00 → $297.50 → $300.00
Lower reference $276.50 → $275.00 → $272.50 → $270.00 → $267.50 → $265.00
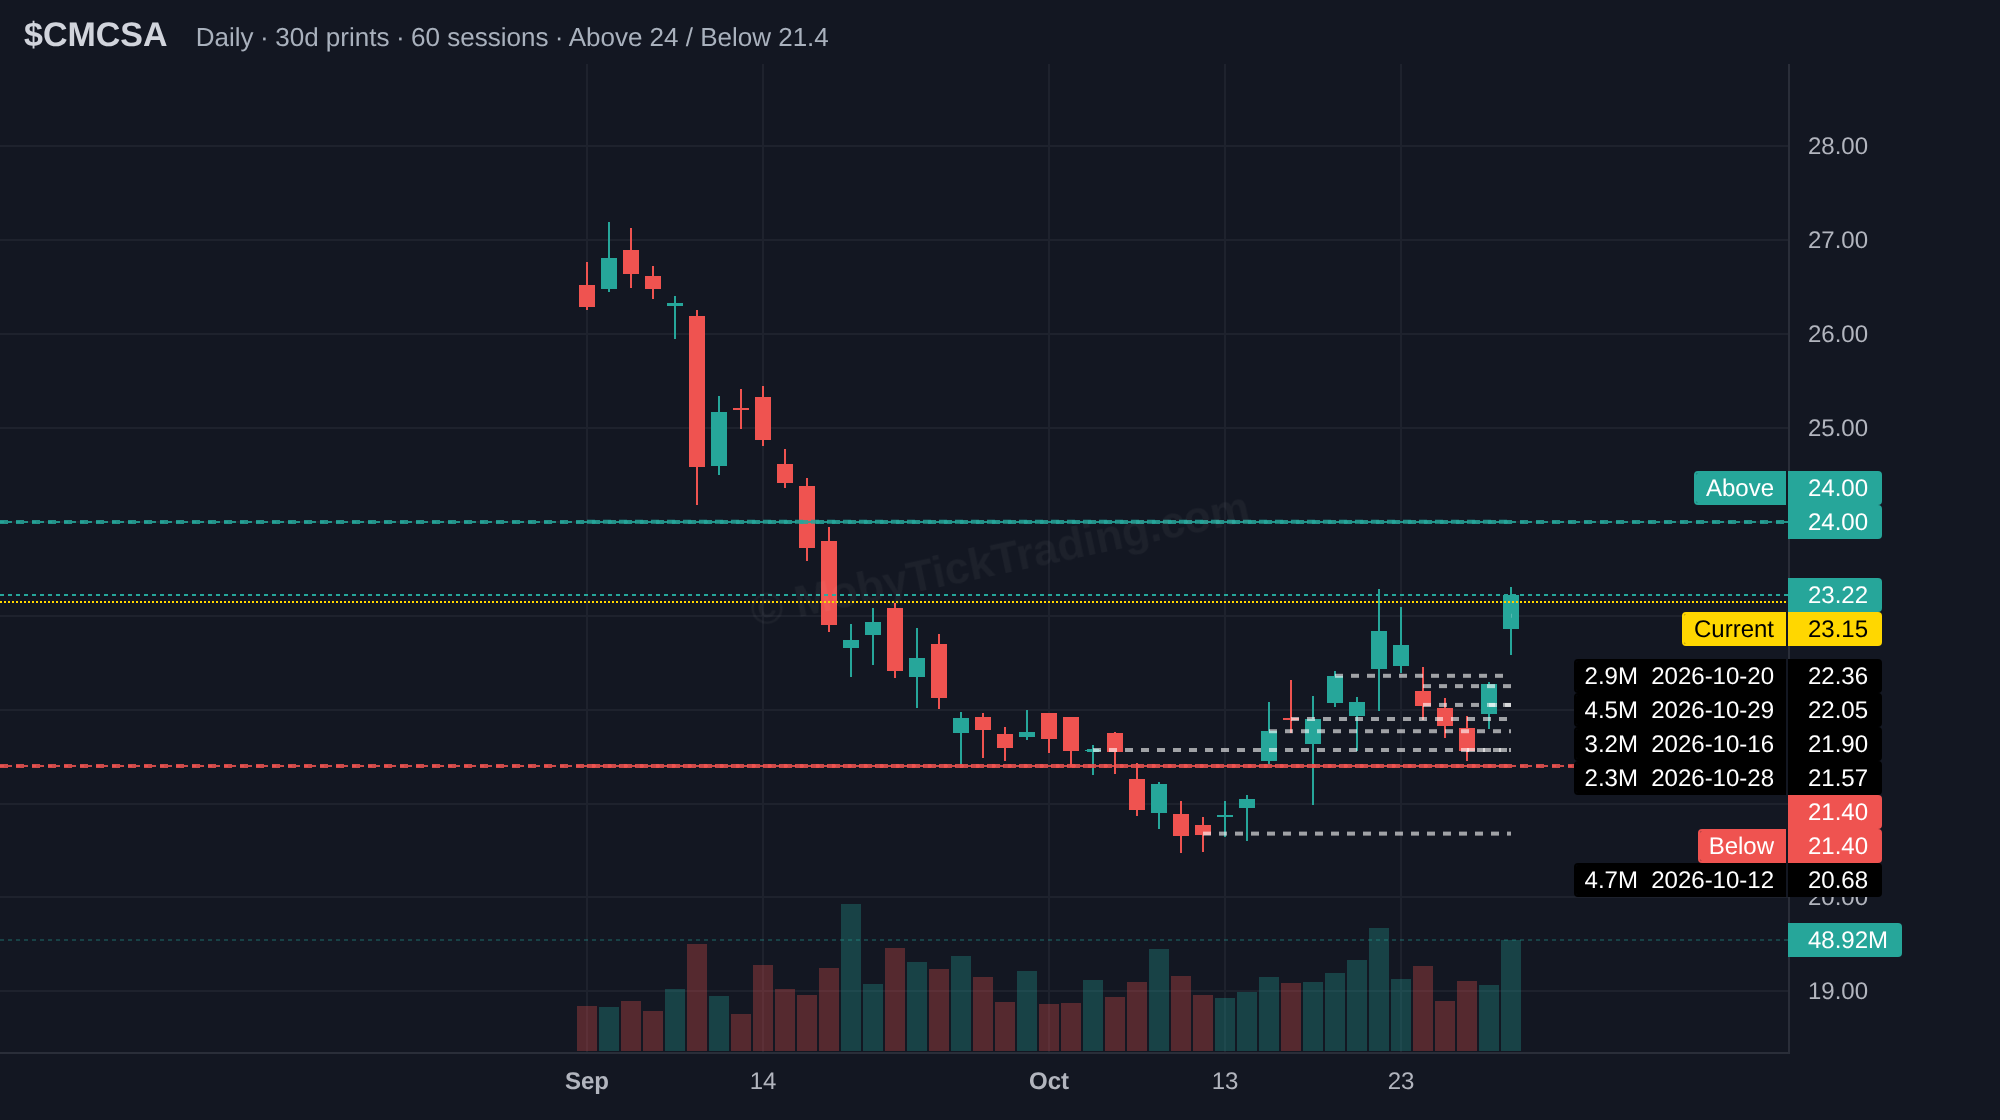
CMCSA
Upper reference $24.00 → $24.50 → $25.00 → $25.50 → $26.00 → $26.50 → $27.00
Lower reference $21.40 → $20.00 → $19.50 → $19.00 → $18.00 → $17.50
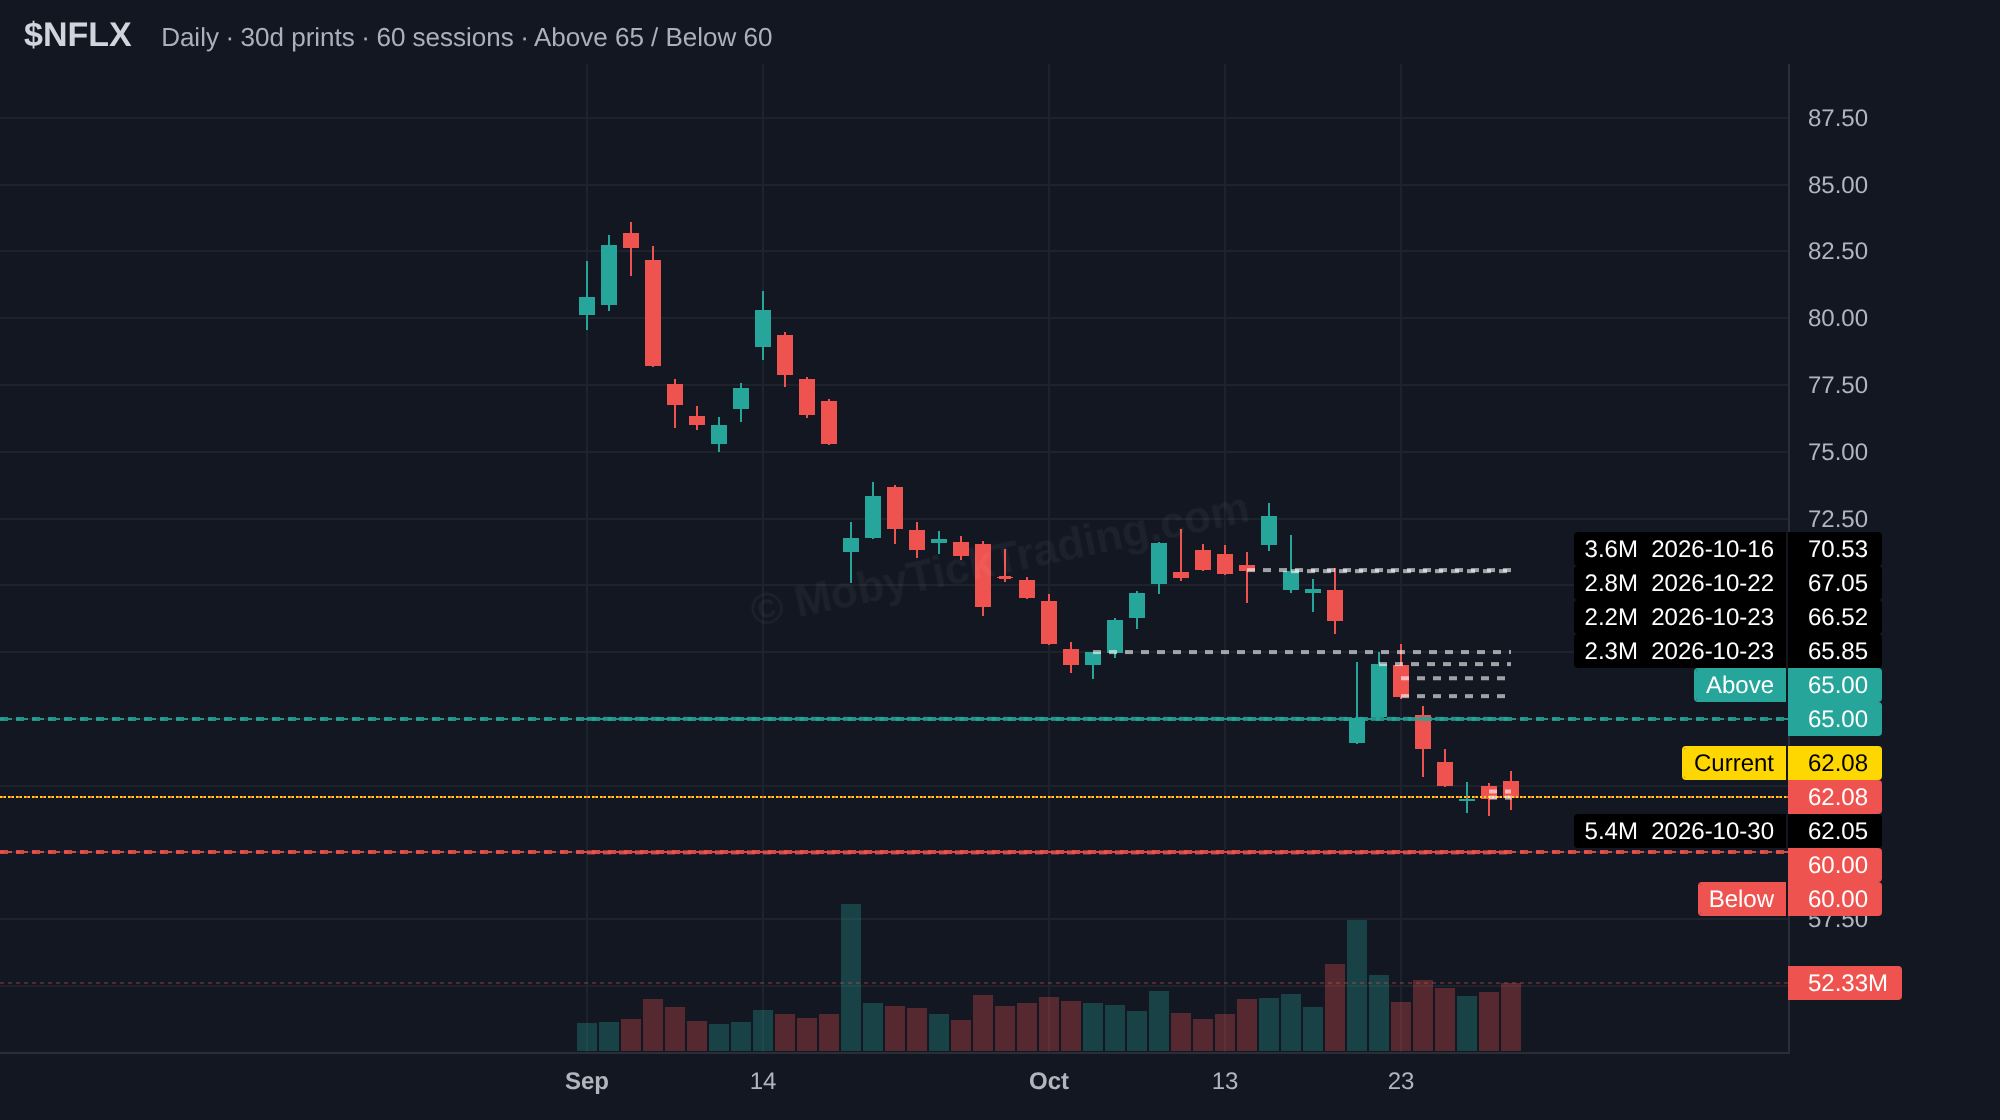
NFLX
Upper reference $65.00 → $66.50 → $67.50 → $69.00 → $70.00 → $71.00 → $72.50 → $75.00
Lower reference $60.00 → $58.25 → $57.50 → $56.25 → $55.00 → $52.50 → $50.00
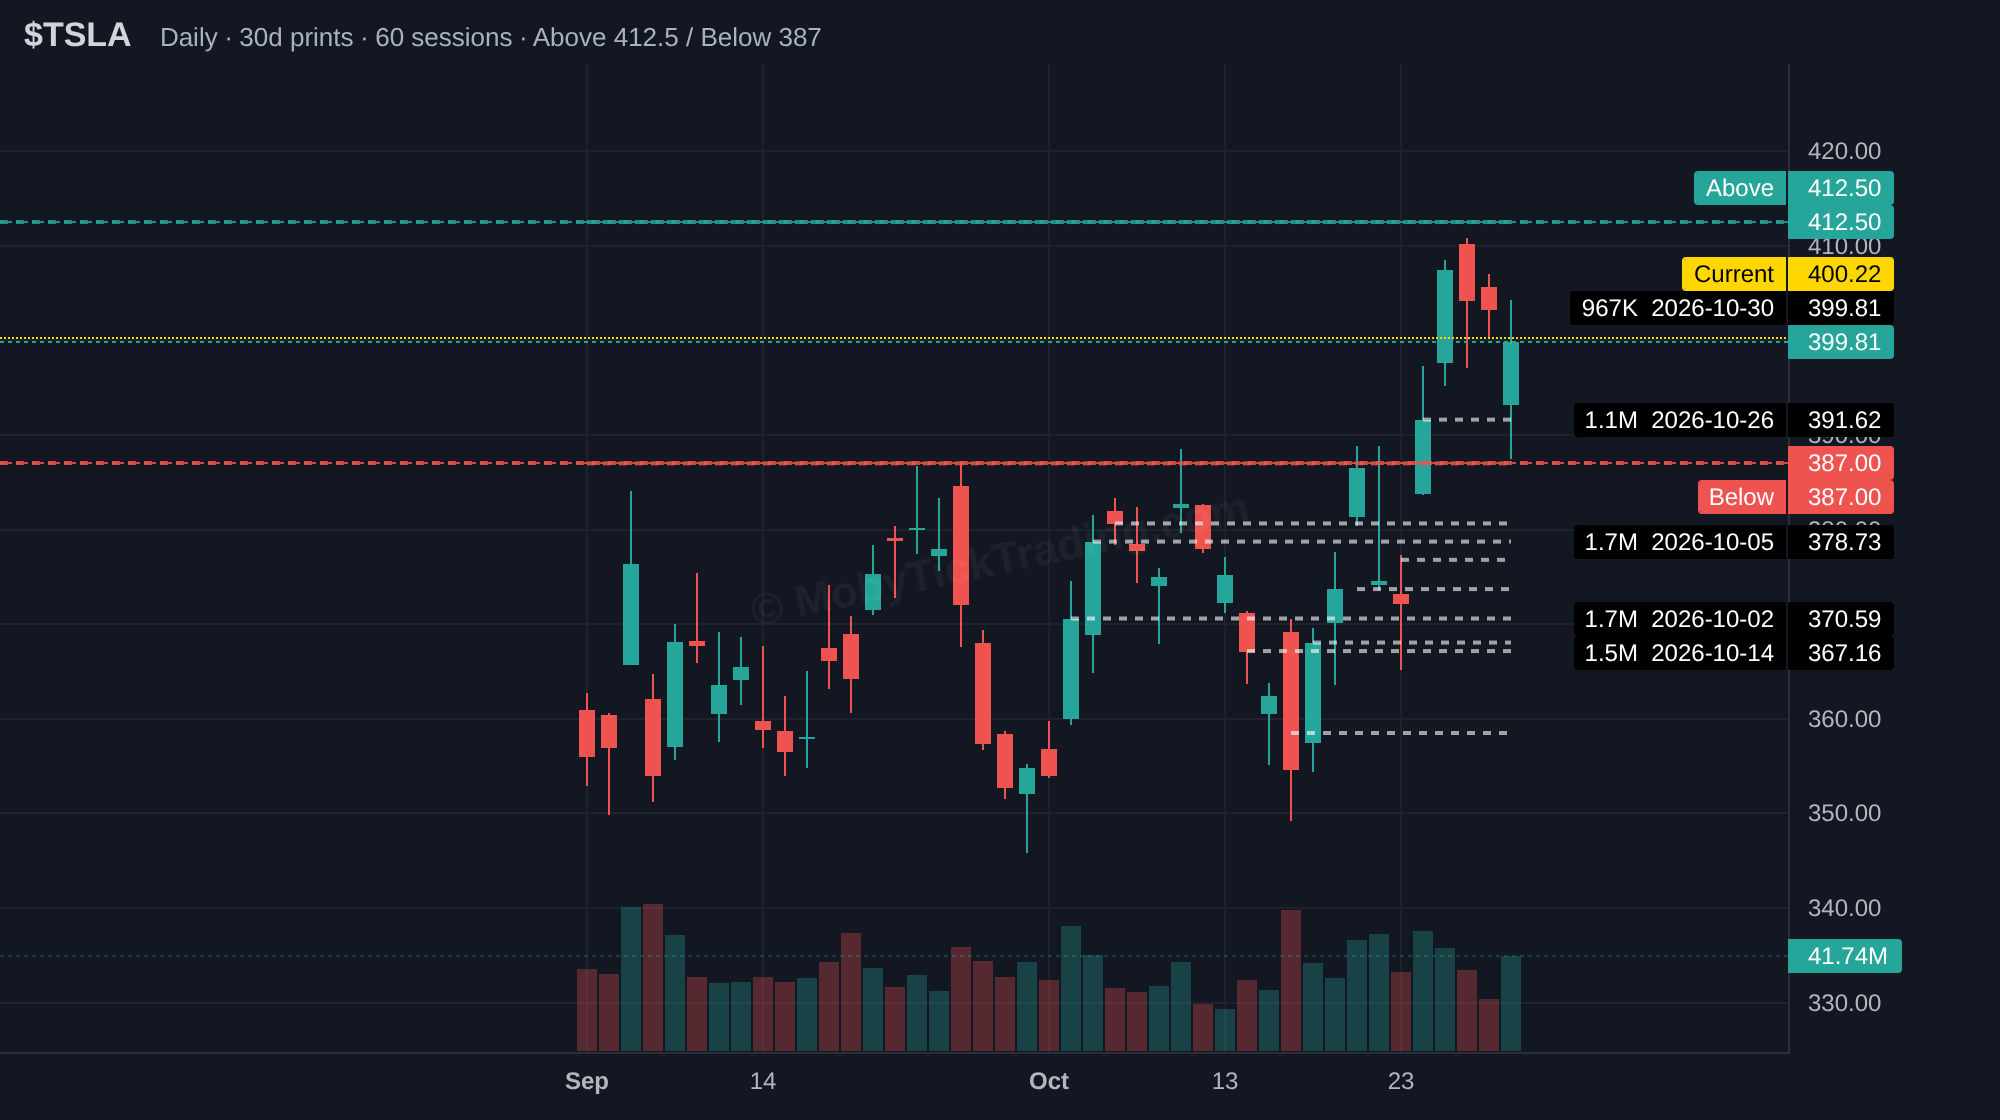
TSLA
Upper reference $412.50 → $420.00 → $425.00 → $430.00 → $435.00 → $440.00
Lower reference $387.00 → $382.50 → $380.00 → $375.00 → $370.00 → $365.00 → $360.00
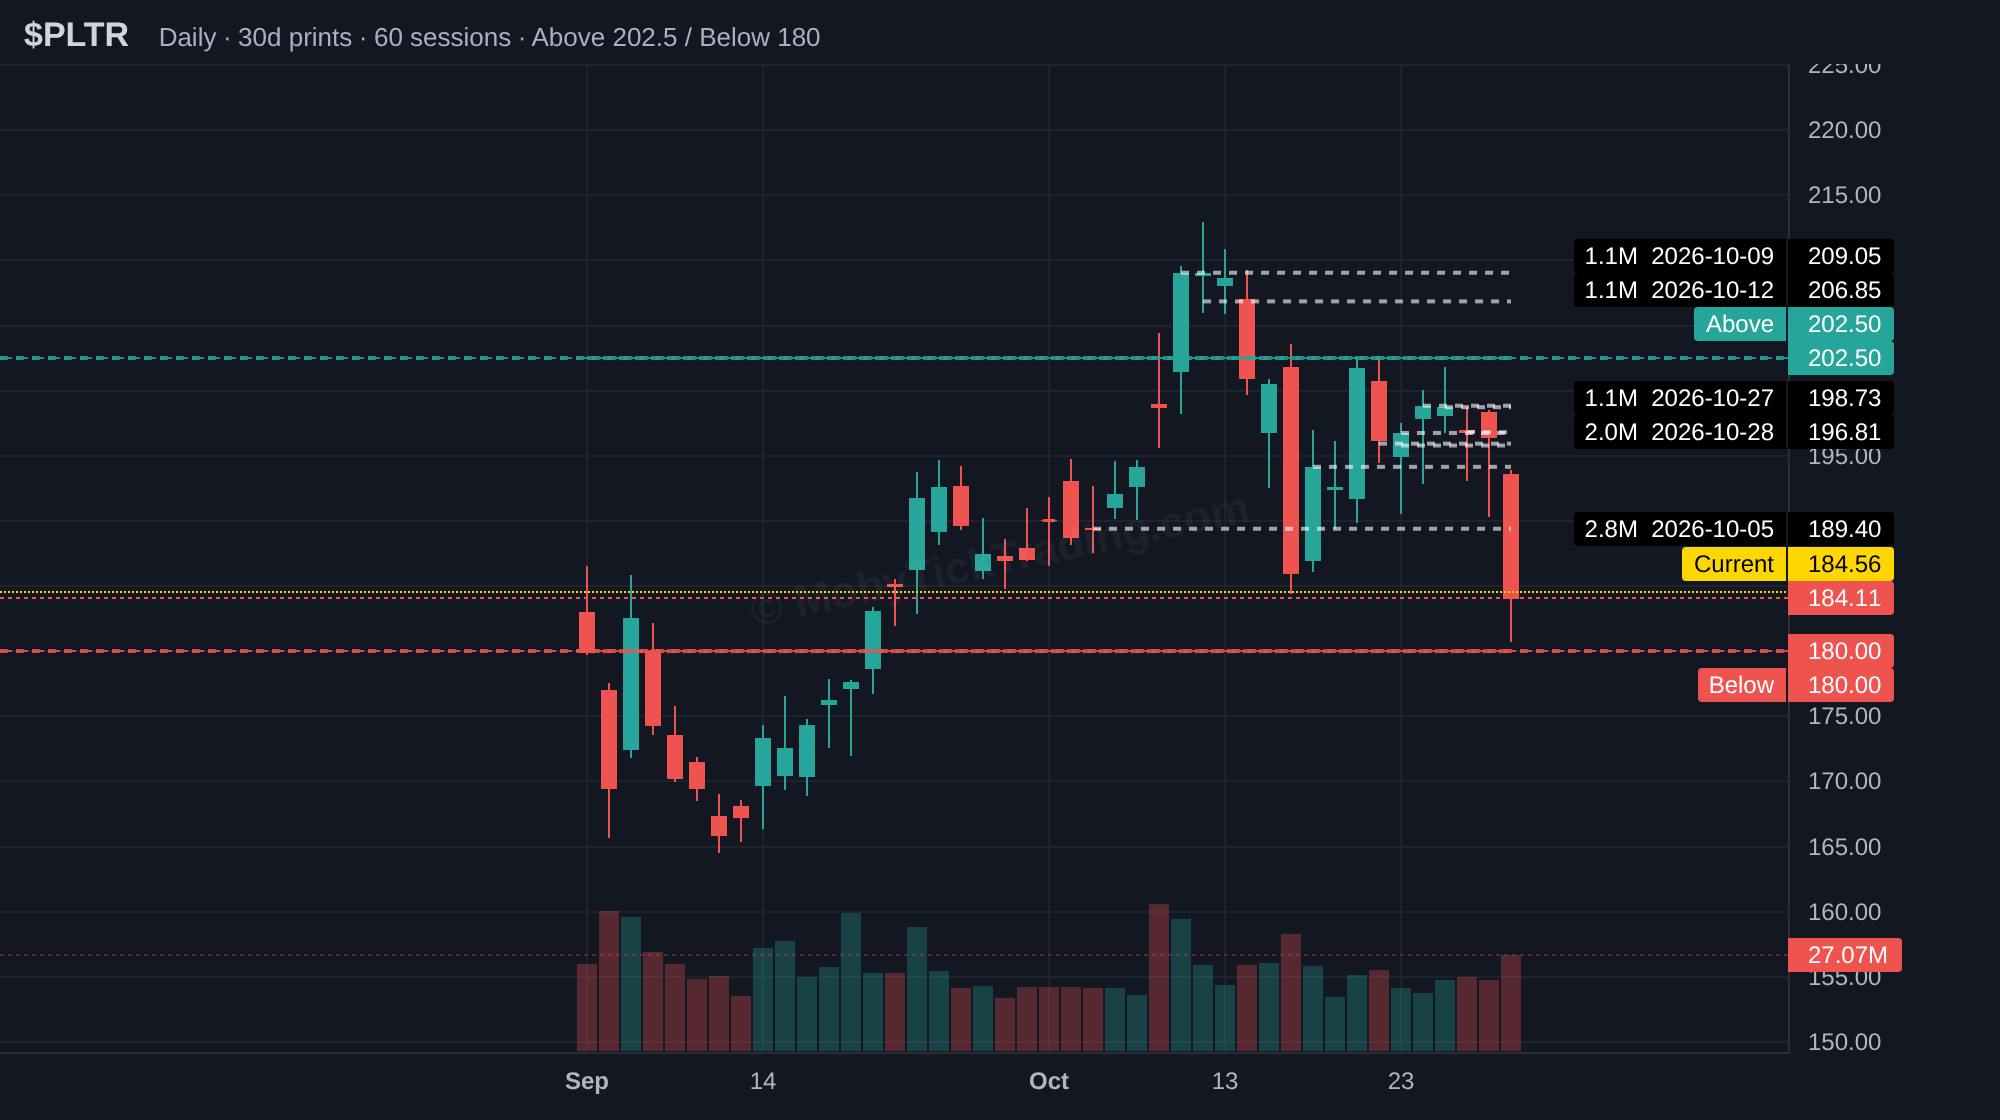
PLTR
Upper reference $202.50 → $205.00 → $207.50 → $210.00 → $212.50 → $215.00
Lower reference $180.00 → $177.50 → $175.00 → $170.00 → $167.50 → $165.00
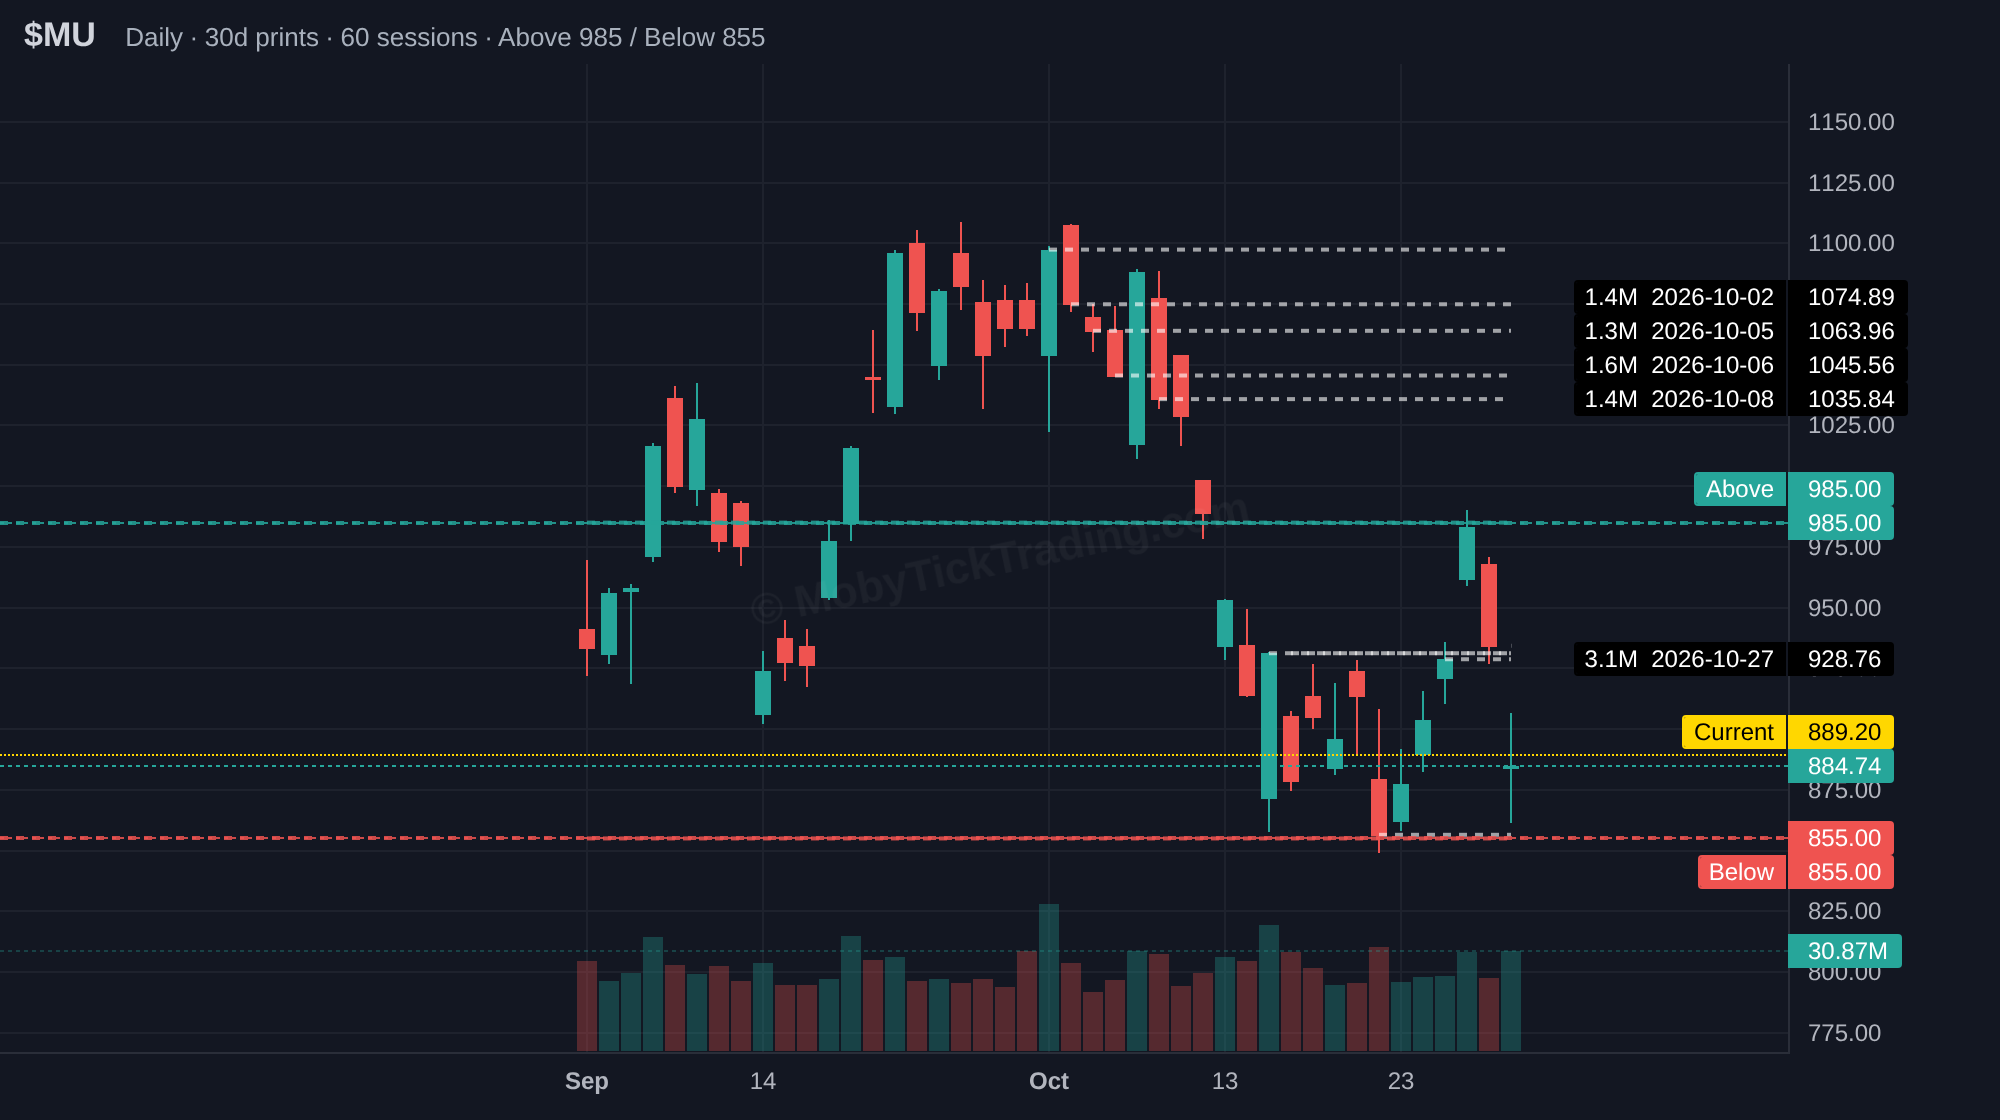
MU
Upper reference $985.00 → $1,000.00 → $1,020.00 → $1,045.00 → $1,065.00
Lower reference $855.00 → $840.00 → $820.00 → $800.00 → $788.00 → $775.00 → $750.00 → $700.00
INTC
Upper reference $70.00 → $72.50 → $75.00 → $77.50 → $79.00 → $80.00 → $82.50 → $85.00
Lower reference $64.00 → $62.50 → $60.00 → $57.50 → $55.00 → $52.50 → $50.00
XOM
Upper reference $188.50 → $190.00 → $192.50 → $195.00 → $197.50 → $200.00
Lower reference $177.50 → $175.00 → $172.50 → $170.00
V
Upper reference $417.00 → $420.00 → $422.50 → $425.00 → $430.00
Lower reference $400.00 → $397.50 → $395.00 → $392.50 → $390.00 → $388.75 → $385.00
XLE
Upper reference $70.25 → $71.00 → $72.50 → $73.75 → $75.00
Lower reference $67.00 → $66.25 → $65.00 → $64.60 → $63.25 → $62.00 → $61.00
META
Upper reference $645 → $650 → $660 → $675 → $700 → $705.44
Lower reference $610 → $600 → $575 → $550 → $540 → $530
ETF Dark Pool Flow
$20.2B. That’s the broad-market ETF dark pool flow for Oct 26–30. SPY was $9.57B, QQQ $6.41B, IVV $2.76B, VOO $1.29B and IWM $139.8M. The sector tape split in two. Communications (XLC −5.32%) and technology (XLK −2.03%) were the only two sector ETFs that finished the week lower. Every other sector we track gained: XLV +3.12%, XLB +2.79%, XLU +2.04%, XLY +2.02%, XLI +1.69%, XLRE +1.41%, XLP +1.31%, XLF +1.09% and XLE +1.00%.
Where the week’s money landed
Most of the index flow arrived on Friday. Adding up the daily SPY + QQQ + IVV + VOO + IWM totals gives Oct 26 $1.24B, Oct 27 $4.70B, Oct 28 $0, Oct 29 $3.30B and Oct 30 $10.9B. Friday alone was $10.9B of $20.2B, or 54.2% of the week. QQQ was the most extreme case, with $6.08B of its $6.41B (94.8%) on Oct 30. Three blocks made up most of it: 3.0M shares at $690.58 ($2.07B), 2.7M shares at $691.42 ($1.87B) and 1.25M shares at $690.23 ($862.8M). SPY’s largest print of the week also came Friday: 3.68M shares at $769.56 ($2.84B). IVV went the other way. $2.45B of its $2.76B came on Oct 27 in one 3.17M-share block at $773.25.
Single-stock tech followed the same Friday pattern. Across the 16 big-tech and communications names in the flow, the combined total was $36.2B:
- NVDA: $1.62B of its $3.42B week on Oct 30
- MSFT: $1.47B of $2.39B on Oct 30. That includes a 1.89M-share block at $521.91 ($984.2M).
- AMZN: $717M of $1.44B on Oct 30
- AAPL: the largest single-stock total at $9.31B, with $3.28B of it on Oct 30
- GOOGL: the exception, with $1.95B of its $3.16B on Thursday, Oct 29
MU had the largest single-stock print of the week: 3.02M shares at $928.76 on Oct 27, a $2.80B block. MU closed Friday at $884.74, which is $44.02 (4.74%) below that block’s price.
How to read this
The dark pool average price is the volume-weighted price of all the week’s off-exchange institutional prints in a name. You can treat it as a cost-basis line. If a stock closes below its aggregate dark pool average, the week’s institutional print flow sits at higher prices than the close. That is institutions selling into strength and leaving the tape at a loss, not accumulation. Until we see large prints land at lower prices and hold, we are bearish. This week, all 16 big-tech and communications names closed below their averages:
| Ticker | Close vs. DP average |
|---|---|
| AAPL | −0.24% |
| MSFT | −1.02% |
| NVDA | −3.01% |
| GOOGL | −3.39% |
| GOOG | −2.42% |
| META | −0.93% |
| AMZN | −2.66% |
| AVGO | −2.58% |
| MU | −4.95% |
| ORCL | −1.01% |
| NFLX | −0.23% |
| INTC | −13.55% |
| NOW | −10.81% |
| PLTR | −6.73% |
| MRVL | −15.99% |
| CSCO | −2.86% |
That’s the same divergence the sector ETFs showed. XLC and XLK closed lower while the other nine sectors closed higher.
What to watch in the levels tables
- Distance to DP average: AAPL (−0.24%) and NFLX (−0.23%) closed close to their averages. MRVL (−15.99%), INTC (−13.55%) and NOW (−10.81%) closed far below theirs. Watch where price trades relative to those lines.
- The MU block at $928.76: it sits $44.02 above Friday’s $884.74 close, and the whole week’s MU average ($930.79) is not far above it.
- Friday index prints: QQQ’s $690–$691 cluster and SPY’s $769.56 block are the most concentrated reference prices from the week’s broad-market flow.
- GOOGL’s Oct 29 activity: its $1.95B day came one session earlier than the Friday concentration in NVDA, MSFT and AMZN. Compare its levels against the rest of the group.
Floors, Flips and Gaps: Reading Dark Pool Prints and Options Regimes
Oct 31, 2026
SPY dropped 12.24 points on Friday and stopped at 750.36, within pennies of a level that institutional prints and options positioning had both flagged. The same week, GOOGL fell 12.6% and INTC 28.6% on earnings. This piece uses both events to teach four things: how stacked levels form a floor, how to read a late print, why the gamma flip changes market behaviour, and what dark pool flow can and cannot warn you about before earnings.
Lesson 1: A floor is built from stacked signals
Friday’s low of 750.36 landed on four independent signals at once. Any one of them is a level; four together are a floor.
- A 10.5M-share late print from June 17 at 750.07. Institutions transacted a large position there, and size tends to defend its price.
- The largest put wall on the board: 276K contracts at 750 (options 30 days or less). Heavy put open interest marks where hedgers are concentrated.
- The monthly pivot S1 at about 750. A purely mechanical level many traders watch.
- Three straight monthly lows at the same price: 748.80 in August, 749.60 in September, 750.36 in October.
The lesson: when institutional prints, options positioning and classic technicals agree on a price, it earns more respect than any of them alone. It also tells you SPY has been in a three-month range of roughly 749 to 782, and Friday closed near the bottom of it.
Lesson 2: Late prints arrive all day, and they mark where size is anchored
A late print is not an after-the-close event. Trades report late for a set of permitted reasons and can be filed up to 24 hours after execution, so they land throughout the session and into the evening. What makes them worth watching is not the clock — it is the size, the price, and the share of that day’s volume they represent.
Friday’s SPY late prints totalled 8.73M shares at 769.56 across 39 separate trades, $6.7B in value, which was 11.23% of the day’s 78M shares. Compare that with the week of Oct 19 to 23, when the same measure ran 3.92%, 3.97%, 3.96%, 3.97% and 6.05%. QQQ did the same thing: 7.25M shares at 715.24 across 70 trades, $5.2B, 8.50% of its 85M shares, against a 690.49 close.
SPY never traded above 761.46 that day, so the print price is not where the stock changed hands on the screen. It is where a large position was negotiated.
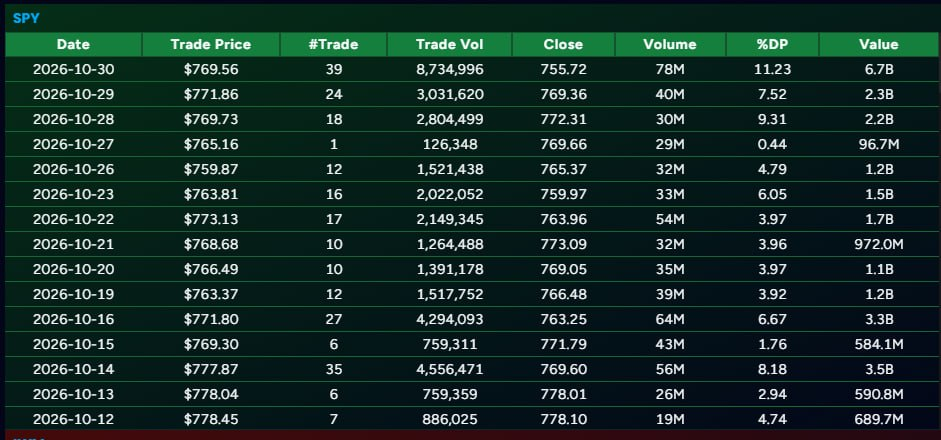
Moby Tick late prints · SPY, Oct 12–30, 2026. The %DP column is each day’s late-print volume as a share of that day’s total volume.
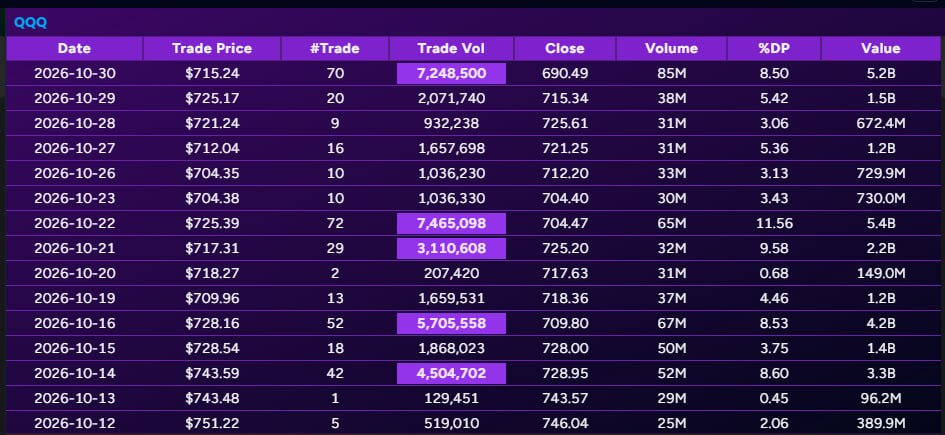
Moby Tick late prints · QQQ, Oct 12–30, 2026. The same pattern: 3.43% on Oct 23 against 8.50% on Oct 30.
That 769 price is not random. It sits on top of four other markers:
- Max pain: 769.00
- October monthly VWAP: 768.81 (August’s was 768.85)
- Gamma flip: 768.48
- Friday’s late print: 769.56
This is the range’s center of gravity. Two more things stood out in the late-print history:
- Activity built into the drop. Late prints were 11.23% of SPY volume on Friday against roughly 4% a day the week before, and QQQ went from 3.43% on Oct 23 to 8.50% on Oct 30.
- Late prints kept landing above the close: 777.87 on Oct 14 (close 769.60, 8.18% of volume), 773.13 on Oct 22 (close 763.96, 3.97%) and 769.56 on Oct 30 (close 755.72, 11.23%). Size anchored above the price is overhead supply until price gets back there.
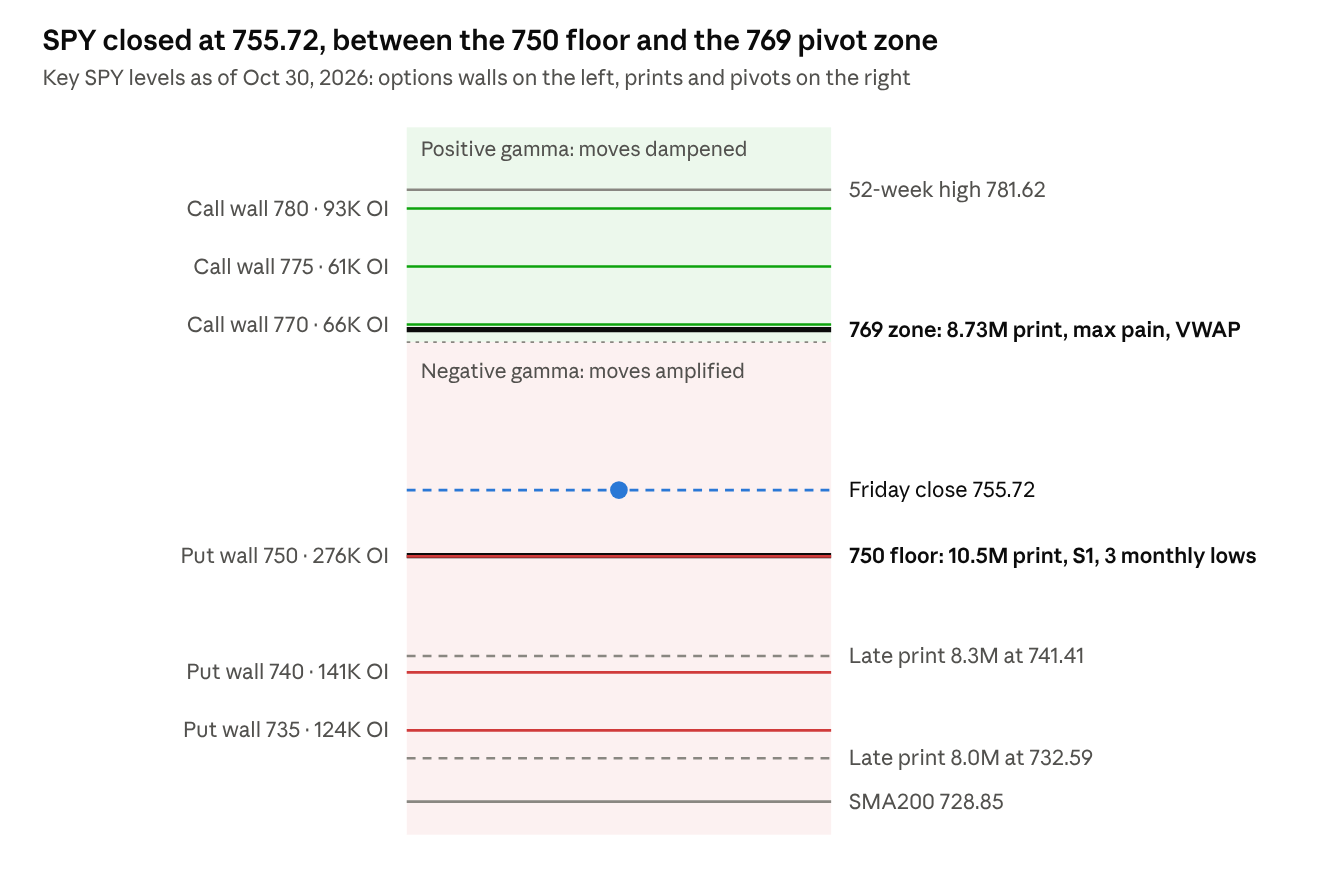
Moby Tick dark pool and options data · SPY, Oct 30, 2026
The floor and the pivot frame the range: 750 below, 769 above, and Friday’s close in between. The shading shows which side of the gamma flip each level sits on.
Lesson 3: The gamma flip changes how the market moves
The gamma flip is the price where options dealers’ net hedging switches direction. SPY closed Friday about 13 points below its flip at 768.48.
- Above the flip (positive gamma): dealers buy dips and sell rips to stay hedged. That leans against moves, so ranges tighten and call walls tend to cap rallies.
- Below the flip (negative gamma): dealers sell into drops and buy into rallies. That chases moves, so ranges widen and trends extend.
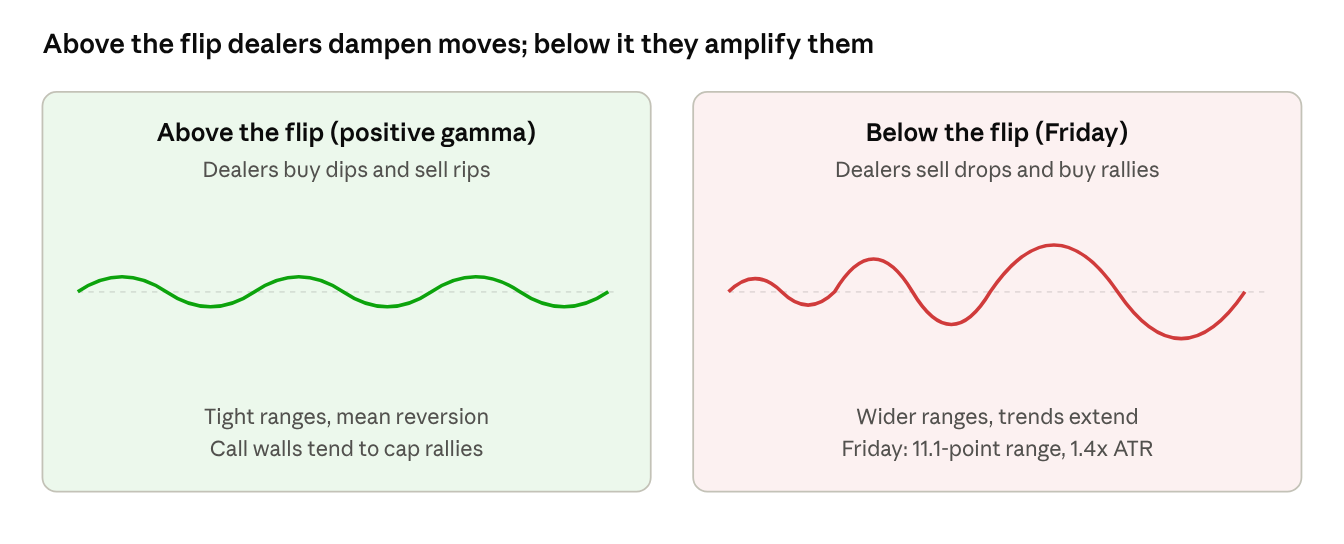
Illustration · the same shock in each gamma regime
The same shock produces a small wobble above the flip and a widening swing below it.
Friday fit the script. SPY’s range was 11.1 points, about 1.4 times its 7.74 average true range. Put walls usually act as support, partly because hedges unwind as puts are cashed in. In a negative-gamma regime, though, a put wall that breaks can add fuel instead.
One caution: these walls are built from options expiring within 30 days, so they shift as November expiration (Nov 20) approaches.
Lesson 4: Could you see GOOGL and INTC coming?
You could see the risk, not the outcome. From Oct 13 to Oct 28, SPY slipped 0.7% while GOOGL fell 8.2% and INTC 7.1%, before either had reported. GOOGL reported Oct 28 after the close and gapped 12.6% the next day. INTC reported Oct 29 and gapped 28.6%.
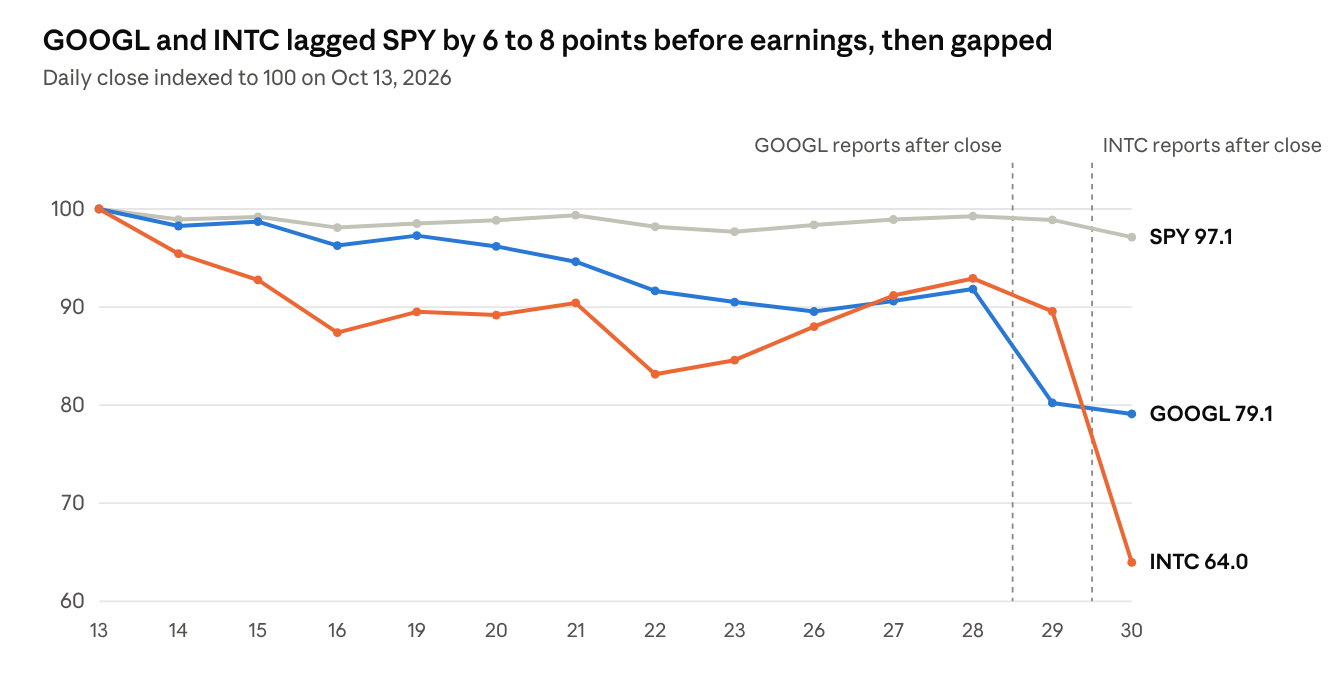
Moby Tick daily closes · Oct 13 to 30, 2026
The gap between the grey SPY line and the two stocks opened well before either report. That divergence, with no news event yet, was the first warning.
The backdrop was capex anxiety across megacap tech. Alphabet had raised its 2026 capex guide to $195B to $205B, and its October selling deepened on Oct 22, the day after Meta raised its own capex forecast (TIKR). Intel had upsized a stock offering to $20B to fund factory buildouts and guided 2026 capex above $20B (Trefis).
Options also underpriced the GOOGL move: the market implied about 5% (MoneyCheck), and it delivered 12.6%.
INTC: blocks walked down a staircase
In the four weeks before earnings, INTC’s large dark pool blocks printed at progressively lower prices: 120.75, 116.90, 113.30, 102.81, 98.12, 93.83, 90.60 and 85.30. Most of the later ones hit at or below the bid.
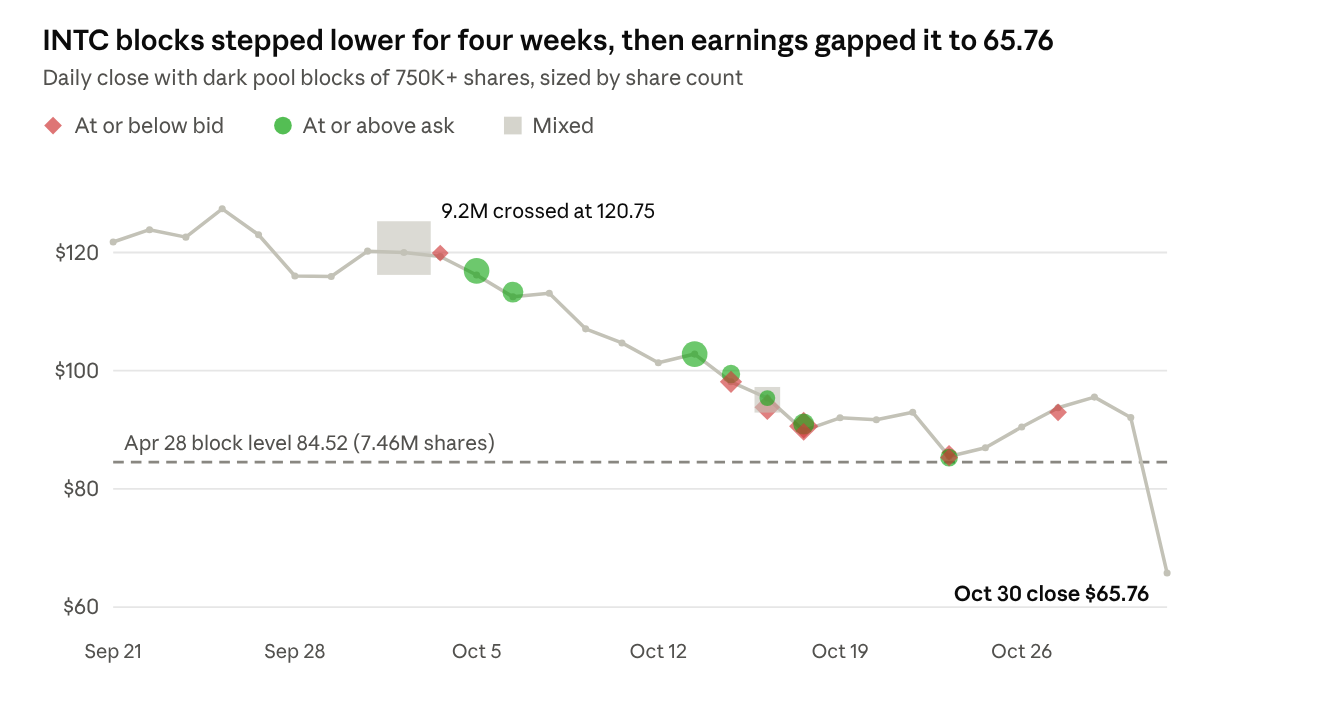
Moby Tick dark pool prints · INTC, Sep 21 to Oct 30, 2026
Each marker is one large block. Follow them down and the staircase is plain: every step became overhead supply for the next.
Three details make this a teaching case:
- Trapped buyers. Blocks that printed at or above the ask at 116.90, 113.30 and 102.81 were buyers stepping in early. They now sit well under water.
- A level held, then failed. The Oct 22 low of 84.645 held the April 28 block level at 84.52 (7.46M shares) almost to the penny. INTC then bounced 11.7% into earnings on lighter volume, and the only large block in that bounce (1M shares on Oct 27) printed below the bid.
- The gap ignored the level. INTC opened Friday at 68.36 and closed at 65.76, down 48% from its Sep 24 close.
INTC now sits under about $7.7B of notional at its 11 heaviest block levels between 84 and 125. Those levels become resistance on any bounce.
GOOGL: the same pattern in a different stock
From Oct 13 to 28, GOOGL blocks of 200K shares or more ran about 2.6 to 1 sell side: roughly 7.3M shares at or below the bid versus 2.8M at or above the ask. Early October had been roughly balanced. Oct 16 alone saw about 3.5M sell-side shares, including some 2.3M crossed at 340.59 at the close.
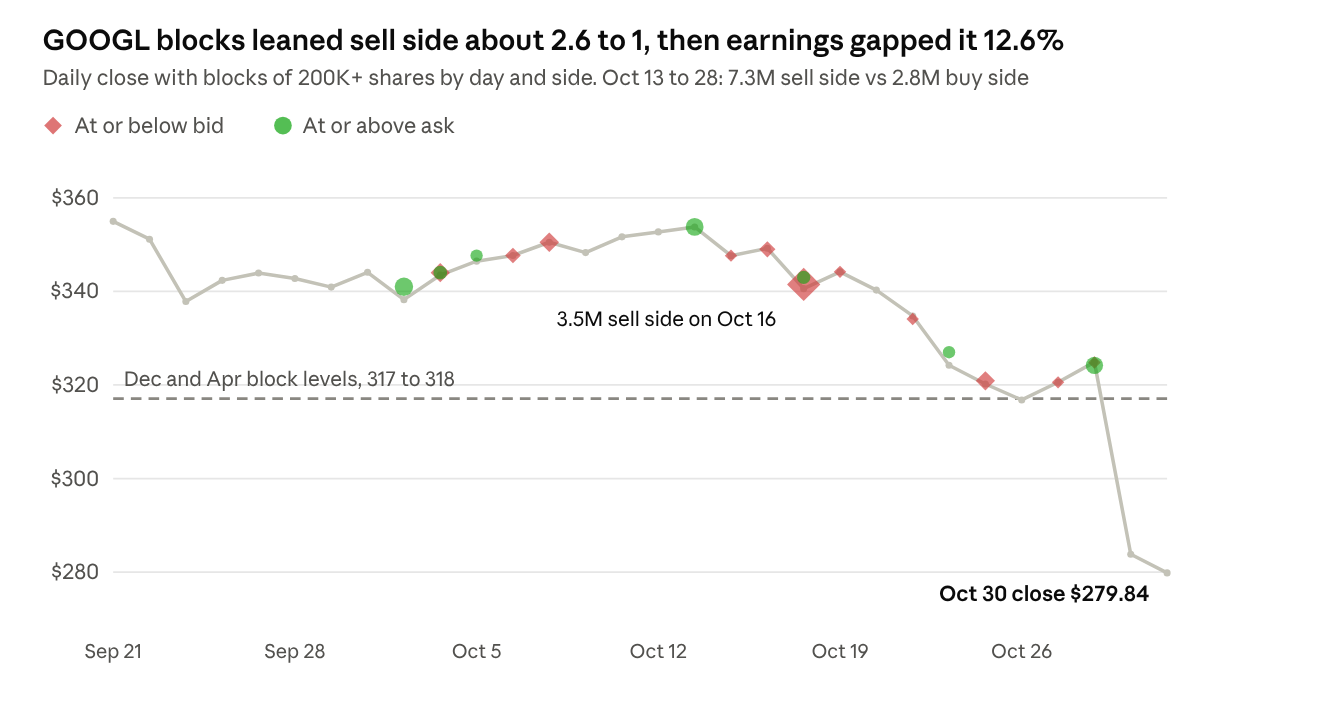
Moby Tick dark pool prints · GOOGL, Sep 21 to Oct 30, 2026, aggregated by day and side
Early October was close to balanced. After the Oct 13 high, red dominates, and that shift is the pattern to watch for.
Then the same sequence as INTC played out. The Oct 26 low of 316.60 held the 317 to 318 block levels from December and April. The earnings gap then went straight through them to 283.82.
GOOGL now trades at 279.84, below all 15 of its heaviest institutional levels from the past year. The nearest overhead levels are 298.85, 305.72, 311.76 and the 317 to 318 cluster.
What dark pool data can and cannot tell you
Dark pool levels show where liquidity sits. They do not stop an information shock, and an earnings gap can skip straight over them.
What it can show before an event:
- Relative weakness against the index
- Blocks printing at progressively lower prices
- A sell-side skew in who was aggressive
- Price leaning on a major level going into a binary event
What it cannot show: the size of the gap, or its direction with any certainty.
Read bid/ask tags with care:
- Every print has a buyer and a seller. The tag only estimates which side was aggressive.
- Many large blocks are Qualified Contingent Trades, often paired with an options or hedge leg.
- Closing (Form T) prints are tagged against quotes at report time.
Treat a skew as a pattern, not proof. The practical edge is risk management: when a stock walks into earnings below its recent block prices, with sell-skewed prints and relative weakness, reduce size or define your risk rather than trying to predict the gap.
The week-ahead map for SPY
The regime is negative gamma inside a three-month range, with the long-term uptrend still intact above the 200-day averages near 729 to 733.
| Scenario | What to watch | Next levels |
|---|---|---|
| 750 holds | Mean reversion higher | 769 pivot zone, where overhead size is anchored |
| 750 breaks | Negative gamma can accelerate the move | 740 to 742 (put wall, 741.41 late print), then 729 to 735 |
| 768.5 reclaimed | Back to positive gamma, calmer ranges | Call walls at 770, 775 and 780 |
This is educational content, not investment advice. Levels are context, not signals.
Sources
- Price, dark pool block, late print and level data: Moby Tick
- SPY options walls, max pain and gamma flip: Moby Tick chart, Oct 30, 2026
- TIKR: Alphabet Stock Is Up 26.5% Over the Past Year
- Trefis: Intel (INTC)
- MoneyCheck: Alphabet stock falls 2% before earnings
Ready to Trade with Whale-Level Insight?
Get institutional-grade dark pool intelligence delivered to your inbox every week.


Disclaimer: This newsletter is for informational and educational purposes only. It does not constitute financial advice, investment recommendations, or solicitation to buy or sell securities. Trading stocks, ETFs, and options involves substantial risk of loss. Past performance is not indicative of future results.