
Quick Answer: What Makes a Great Dark Pool Trading Tool in 2026
Roughly 30-40% of all U.S. equity trading volume runs through dark pools — private exchanges where institutions execute large blocks without moving the public market. If you’re trading without visibility into that data, you’re navigating with a blindfold.
The question is which dark pool trading tool actually delivers actionable data — and here’s how to evaluate that.
What Is a Dark Pool Trading Tool?
A dark pool trading tool is a software platform that captures, organizes, and displays trade data from Alternative Trading Systems (ATS) — the private venues where large institutions execute orders away from public exchanges.
A good dark pool scanner does not just show you trades. It helps you understand where institutional money is placing size, when those trades cluster, and what levels institutions have been active at historically.
What Makes a Good Dark Pool Trading Tool?
1. Real-Time Data Feed
A tool that updates with significant delay is like reading yesterday’s newspaper to plan today. The best platforms stream dark pool prints as they occur, giving you the ability to track activity in near real-time rather than reconstructing it after the fact.
2. Comprehensive Coverage
Many tools only cover the largest, most popular stocks. A strong dark pool trading tool monitors all actively traded equities — not just the mega-caps. MobyTick tracks 10,000+ stocks across all major exchanges and ATS venues.
3. Filtering and Customization
Raw data is noise. A great dark pool scanner lets you filter and customize:
- Minimum trade size — focus on meaningful block trades
- Date ranges — pull historical data going back months or years
- Ticker-specific analysis — deep-dive into one stock’s dark pool history
- Opening/closing filters — focus on genuine intraday institutional positioning
4. Historical Analysis
Single data points are interesting. Trends are actionable. A solid tool stores historical dark pool data so you can identify recurring price levels where institutions return repeatedly.
5. Actionable Output
Data should translate into insight. The best platforms present dark pool information through clean dashboards, alerts for unusual activity spikes, and aggregated summaries.
Real Dark Pool Data: What Institutional Flow Looks Like
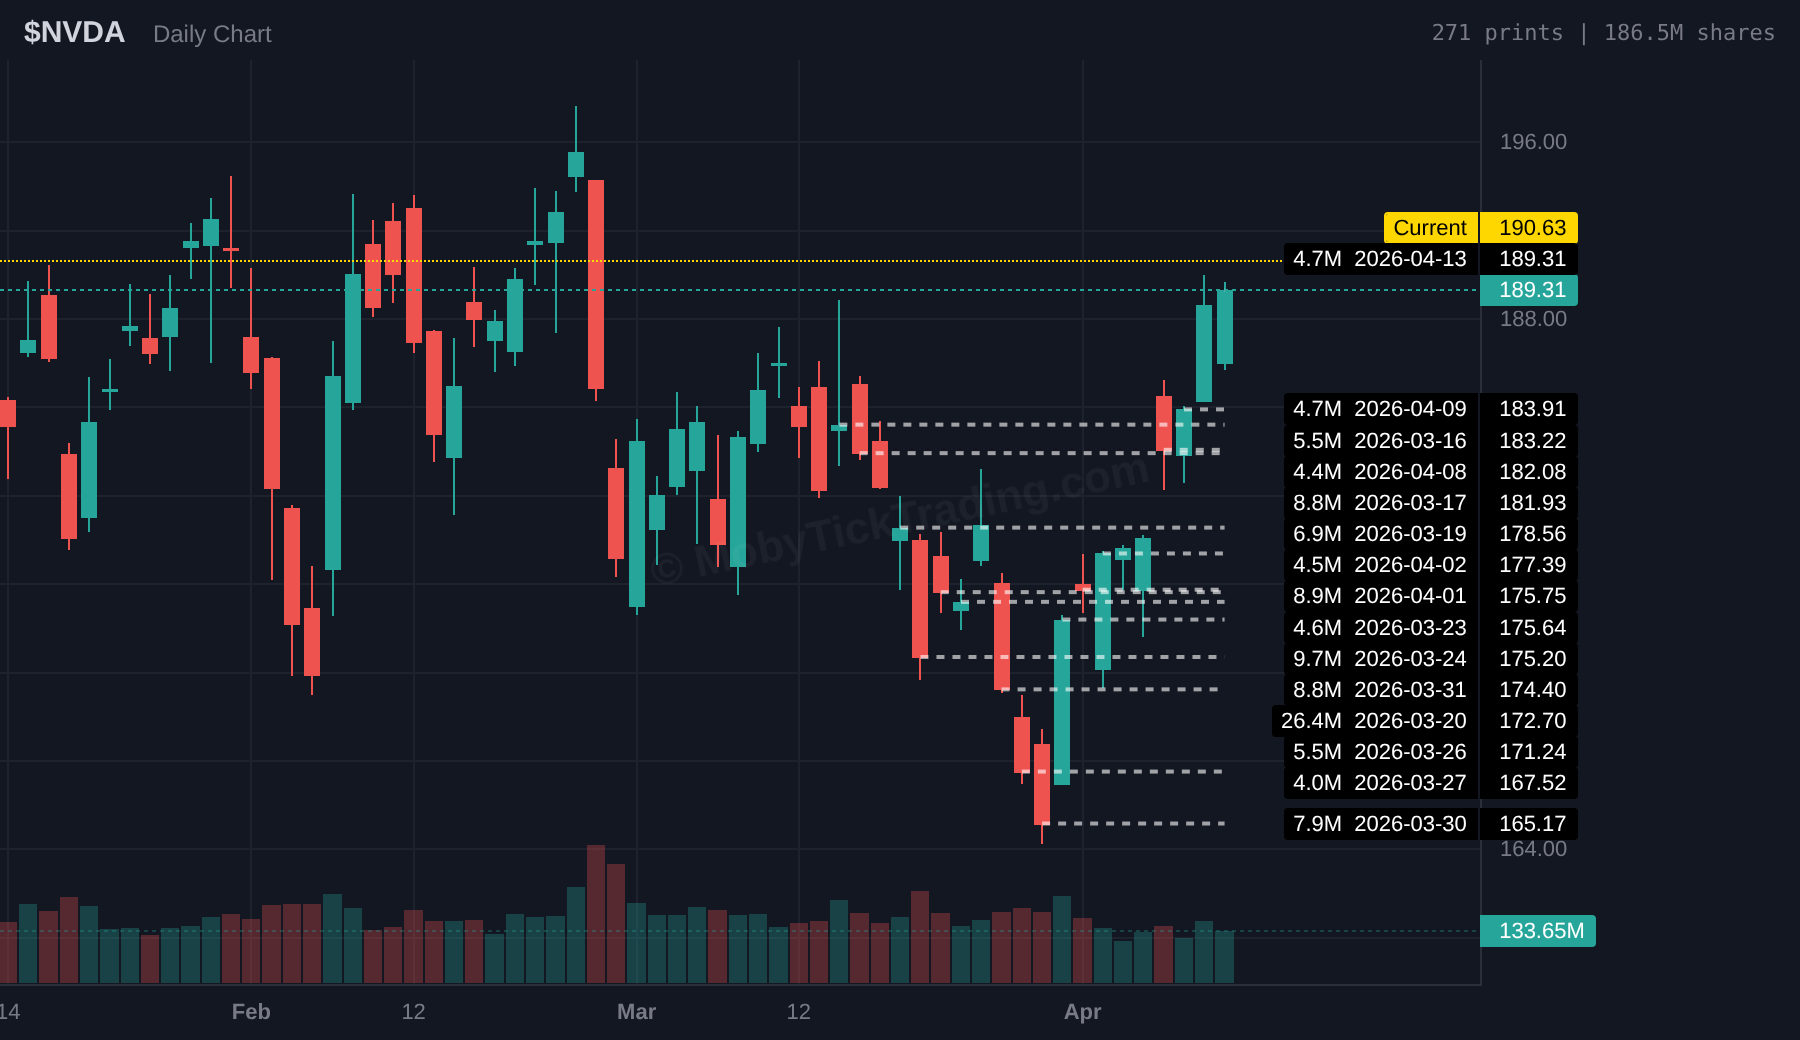
Here’s actual dark pool data from MobyTick for the week of March 16-24, 2026 — the largest verified institutional prints during that period:
| Ticker | Shares | Price | Dollar Value | Date |
|---|---|---|---|---|
| NVDA | 26.4M | $172.70 | $4.55B | March 20 |
| SPY | 10.6M | $658.02 | $6.96B | March 20 |
| AAPL | 15.8M | $251.64 | $3.98B | March 24 |
| MSFT | 7.3M | $381.87 | $2.77B | March 20 |
| AVGO | 8.2M | $322.79 | $2.64B | March 17 |
| MU | 4.5M | $422.90 | $1.92B | March 20 |
| JPM | 3.9M | $286.56 | $1.12B | March 20 |
| AMZN | 7.1M | $205.37 | $1.45B | March 20 |
These figures are verified through the MobyTick API. Each row represents a single dark pool print — not aggregated daily totals. The NVDA $4.55 billion print on March 20 was the single largest dark pool print in the 90-day tracked period for that stock.
Dark Pool Scanner vs. Traditional Market Data
Traditional platforms show:
- Public exchange trades (NYSE, NASDAQ)
- Consolidated volume numbers
- Price charts based on lit exchange data
A dark pool trading tool adds:
- Off-exchange ATS prints (the 30-40% invisible elsewhere)
- Block trade identification filtered by your criteria
- Institutional price levels from private venues
- Early signals of positioning before public market impact
Comparing Dark Pool Trading Platforms
| Feature | MobyTick | Typical Competitors |
|---|---|---|
| Stocks Tracked | 10,000+ | 2,000-3,000 |
| Historical Data | 6+ years | Limited (6-12 months) |
| Real-Time Alerts | ✅ | ✅ (higher tiers) |
| Opening/Closing Filters | ✅ | Limited |
| API Access | ✅ | Usually ❌ |
| Starting Price | $19.99/mo | $49-149/mo |
How to Use Dark Pool Data Effectively
Raw institutional data becomes powerful when applied with discipline:
Step 1: Scan for Activity
Start with a broad dark pool scanner to identify which tickers are seeing significant off-exchange volume. Filter for minimum size to focus on trades that matter.
Step 2: Identify Key Levels
Once you find active tickers, pull historical data and map out the exact prices where large dark pool prints have occurred. These become your reference points.
Step 3: Monitor for Patterns
When institutions return to the same price level repeatedly, that level matters. Track those clusters over time.
Step 4: Contextualize With Other Data
Dark pool prints are one data point among many. Combine them with technical analysis, volume context, and broader market research.
Getting Started with MobyTick
MobyTick tracks 10,000+ stocks with 6+ years of historical data. Plans start at $19.99/month.
- Sign up at mobyticktrading.com
- Scan the market — use the broad scanner to find active tickers
- Deep-dive individual names — pull historical data for stocks on your watchlist
- Map key levels — identify where institutions have been printing size
- Track patterns — return daily and watch for new activity at known levels
The Bottom Line
A great dark pool trading tool gives you something most retail traders never see: a window into institutional positioning on private venues. The features that matter most are real-time data delivery, broad market coverage, historical depth, and clean presentation that turns raw prints into actionable intelligence.
MobyTick delivers all of these — 10,000+ stocks, real-time dark pool prints, historical data going back to 2020, and pricing starting under $20/month.
Start tracking institutional dark pool data today. Visit mobyticktrading.com.