
Market Overview
All four major indexes finished the week higher. The S&P 500 closed Friday at 7,561.67, up 2.51% for the week, its first winning week since October and its biggest weekly gain since August. It is now up 10.5% year to date. The Nasdaq Composite ended at 25,136.27, up 2.27% and its first weekly gain in five weeks. The Dow closed at 52,347.55, up 2.07%, and the Russell 2000 finished at 2,790.49, up 1.32%. Friday itself was mixed. The S&P 500 slipped 0.40% and the Nasdaq lost 0.91%, yet more than 60% of S&P 500 stocks rose on the day. The Dow was the only one of the four to close Friday in the green, up 0.10%. All eleven S&P sectors finished the week higher, led by XLE at +5.42%.
Inflation data was the main macro event of the week. October CPI on Tuesday came in at +0.4% month over month against +0.3% expected, with core at +0.3% against +0.2%. No 12-month CPI figure was published, because October-2025 data could not be collected during the government shutdown. Friday’s October PPI was softer on the month at +0.3% versus +0.4% expected, but the annual rate reached +6.5%, the highest since November 2022. Goods prices were up 10.2% year over year. The 10-year Treasury yield closed Friday at 5.15%, a 29 bp increase on the week from 4.86%, and the 2-year ended at 4.87%. The next FOMC meeting is Dec 8–9, and markets fully price at least a 25 bp hike, with small odds of 50 bp. Waller said a December hike is likely and that he is open to a larger move; Logan said two more 25 bp hikes may be needed. Energy is part of the story. Per AP, costs tied to the U.S.–Iran conflict are feeding through to shipping, food and clothing prices, even as WTI settled at $88.56, down 2.5% for the week and its second straight weekly decline.
The biggest single-company event came Thursday. Jensen Huang resigned as President, CEO and board member of Nvidia, effective immediately, and CFO Colette Kress was named interim CEO. The stock’s decline this week cost Nvidia just under $600 billion in market capitalization. NVDA closed the week at 162.85, down 12.75%. Nvidia reports Q3 FY27 results on Tuesday 11/17 after the close, with the call at 5:00 pm ET.
On the MobyTick dark pool tape, NVDA, QQQ, SPY, IWM and MSFT carried the largest validated block flow across the 13 names in this issue. QQQ led at $11.71B over 106 prints, followed by NVDA at $6.49B over 230 prints, SPY at $3.38B, IWM at $2.72B and MSFT at $2.43B. The widest gaps between Friday’s close and the week’s flow VWAP were in NU (+6.15%), NVDA (−2.79%), MU (+2.54%) and XOM (+2.00%). SPY’s close sat almost exactly on its flow VWAP, at +0.01%. Every print shown is at least 50,000 shares and survived a filter that removes closing-auction prints, prints at the session close, post-close prints, duplicates and prints outside the session’s range.
Here is how last week’s callouts graded out. Eight of 13 tickers reached their upper reference level, four reached their lower level, and three (IWM, INTC, XLU) reached neither. Six tickers reached at least one named level, 17 in total. QQQ took all five of its upper levels, from 662.50 to 695.57. NVDA opened below its 181.00 lower level and traded as low as 148.80. GDX and XOM crossed both levels during the week.
The setups below lay out this week’s levels for each name, with the block flow and VWAP figures alongside them. Nvidia’s report on Tuesday is the scheduled event on the calendar.
Last Week’s Callout Performance
| Ticker | Upper Level | Lower Level | High | Low | Close | Observed Side | Reference Levels Reached |
|---|---|---|---|---|---|---|---|
| SPY | $750.00 | $730.00 | $763.04 | $741.02 | $754.37 | Upper | Upper 3 of 5 → R3 $760.00 |
| QQQ | $662.50 | $647.00 | $695.57 | $662.02 | $679.89 | Upper | Upper 5 of 5 → R5 $690.00 |
| IWM | $284.00 | $270.00 | $283.79 | $274.67 | $277.54 | — | None |
| NVDA | $210.00 | $181.00 | $179.92 | $148.80 | $162.85 | Lower | Lower 4 of 4 → R4 $165.00 |
| INTC | $66.50 | $51.50 | $64.06 | $55.83 | $59.66 | — | None |
| META | $645.00 | $582.50 | $648.45 | $618.92 | $641.69 | Upper | Upper 0 of 3 |
| GOOGL | $295.00 | $275.00 | $304.97 | $285.68 | $295.77 | Upper | Upper 1 of 5 → R1 $300.00 |
| XOM | $170.00 | $162.50 | $171.71 | $160.11 | $170.59 | Upper & Lower | Upper 0 of 4 · Lower 0 of 3 |
| RKT | $15.50 | $13.75 | $15.38 | $13.50 | $13.71 | Lower | Lower 0 of 4 |
| IONQ | $34.50 | $24.87 | $36.35 | $28.25 | $28.88 | Upper | Upper 0 of 3 |
| GDX | $90.00 | $82.50 | $92.02 | $79.87 | $81.64 | Upper & Lower | Upper 1 of 6 → R1 $91.25 · Lower 2 of 5 → R2 $80.00 |
| XLU | $45.00 | $42.00 | $44.14 | $43.15 | $44.04 | — | None |
| NU | $12.37 | $11.20 | $13.25 | $11.79 | $13.22 | Upper | Upper 1 of 5 → R1 $13.00 |
Upper-side observations: 8 · Lower-side observations: 4 · No crossing recorded: 3
Tickers reaching ≥1 reference level: 6 · Total reference levels reached: 17
This Week’s Callouts — Upper Reference Levels
| Ticker | Upper Reference | Reference Levels |
|---|---|---|
| SPY | $772 | $775 → $777.50 → $780 → $785 |
| QQQ | $695 | $697.50 → $700 → $705 → $710 → $715 |
| IWM | $284 | $285 → $287.5 → $289 → $292.5 → $295 |
| NVDA | $182.5 | $185 → $190 → $195 → $200 → $205 |
| MSFT | $536 | $540 → $545 → $550 → $555 → $560 |
| GOOGL | $295 | $300 → $310 → $315 → $317.50 → $325 |
| INTC | $65 | $66.25 → $67.5 → $70 → $72.5 → $75 |
| META | $650 | $660 → $670 → $680 → $700 |
| NU | $13.50 | $13.8 → $14 → $14.86 → $15 → $16 |
| AKAM | $90 | $92.5 → $95 → $97.50 → $99 → $100 → $102.5 |
| DBX | $36 | $37 → $39 → $40 |
| WMT | $128.5 | $130 → $131.25 → $132.5 → $135 → $137.5 |
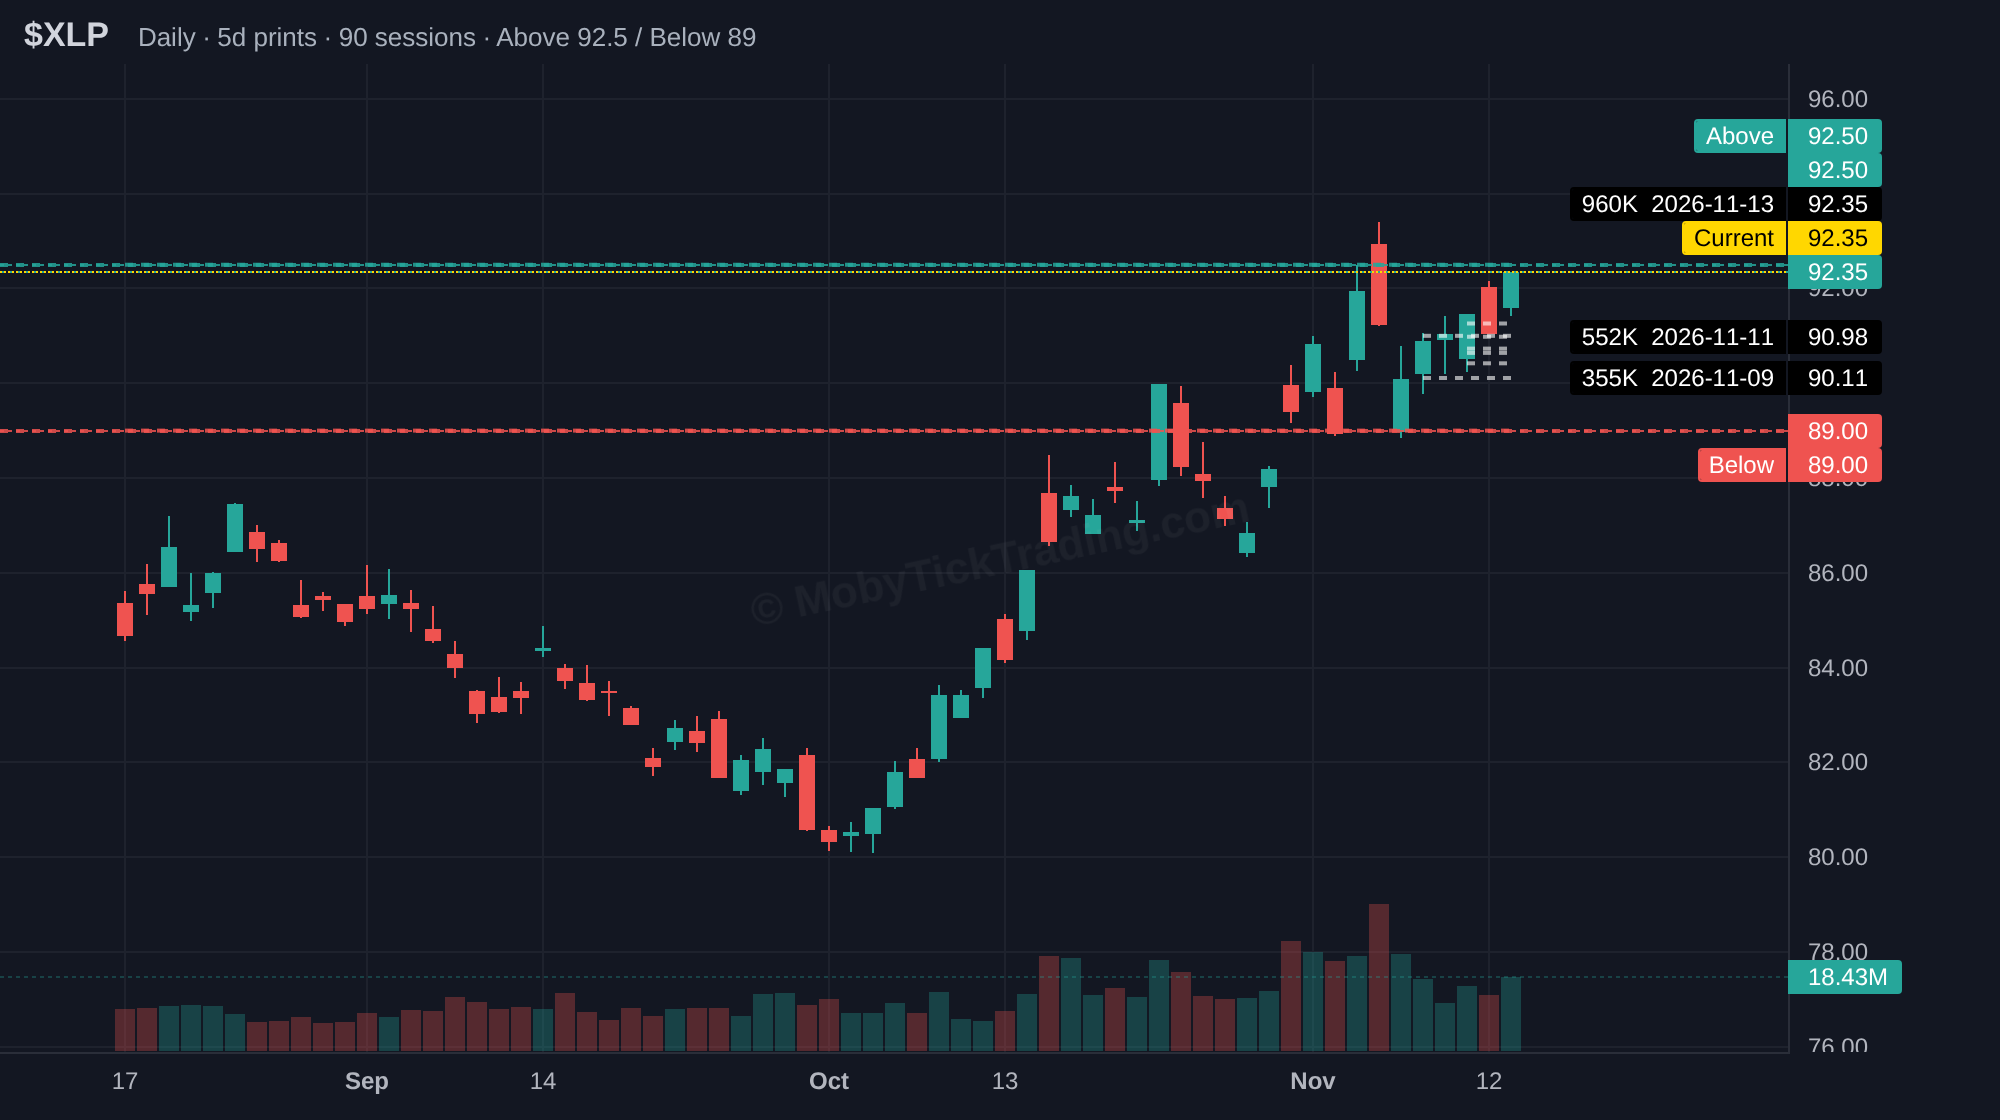
| XLP | $92.50 | $93.25 → $95 → $97.5 → $100 |
This Week’s Callouts — Lower Reference Levels
| Ticker | Lower Reference | Reference Levels |
|---|---|---|
| SPY | $750 | $745 → $740 → $735 → $732.50 |
| QQQ | $672.5 | $670 → $665 → $660 → $657 → $650 |
| IWM | $272.5 | $270 → $267.5 → $265 → $262.5 → $260 |
| NVDA | $160 | $155 → $152.50 → $150 → $147.5 → $145 |
| MSFT | $513 | $510 → $505 → $500 → $490 → $480 |
| GOOGL | $287.5 | $285 → $280 → $275 → $270 → $260 |
| INTC | $57 | $55 → $52.50 → $50 → $47.5 → $45 |
| META | $602.5 | $600 → $590 → $580 → $570 → $560 → $550 |
| NU | $11.50 | $11.20 → $11 → $10.5 → $10 → $9 |
| AKAM | $80 | $77.5 → $75 → $72.5 → $70 |
| DBX | $32 | $31 → $30 → $29 → $28 → $27.5 |
| WMT | $123 | $122 → $120.75 → $120 → $119 → $118 → $117 |
| XLP | $89 | $88 → $87 → $86 → $85 → $84 |
This Week’s Callouts — Ticker Detail
Each card below shows dark pool flow data for the past week, along with reference levels for the upcoming week. Dark pool statistics are sourced from MobyTick’s proprietary analytics.
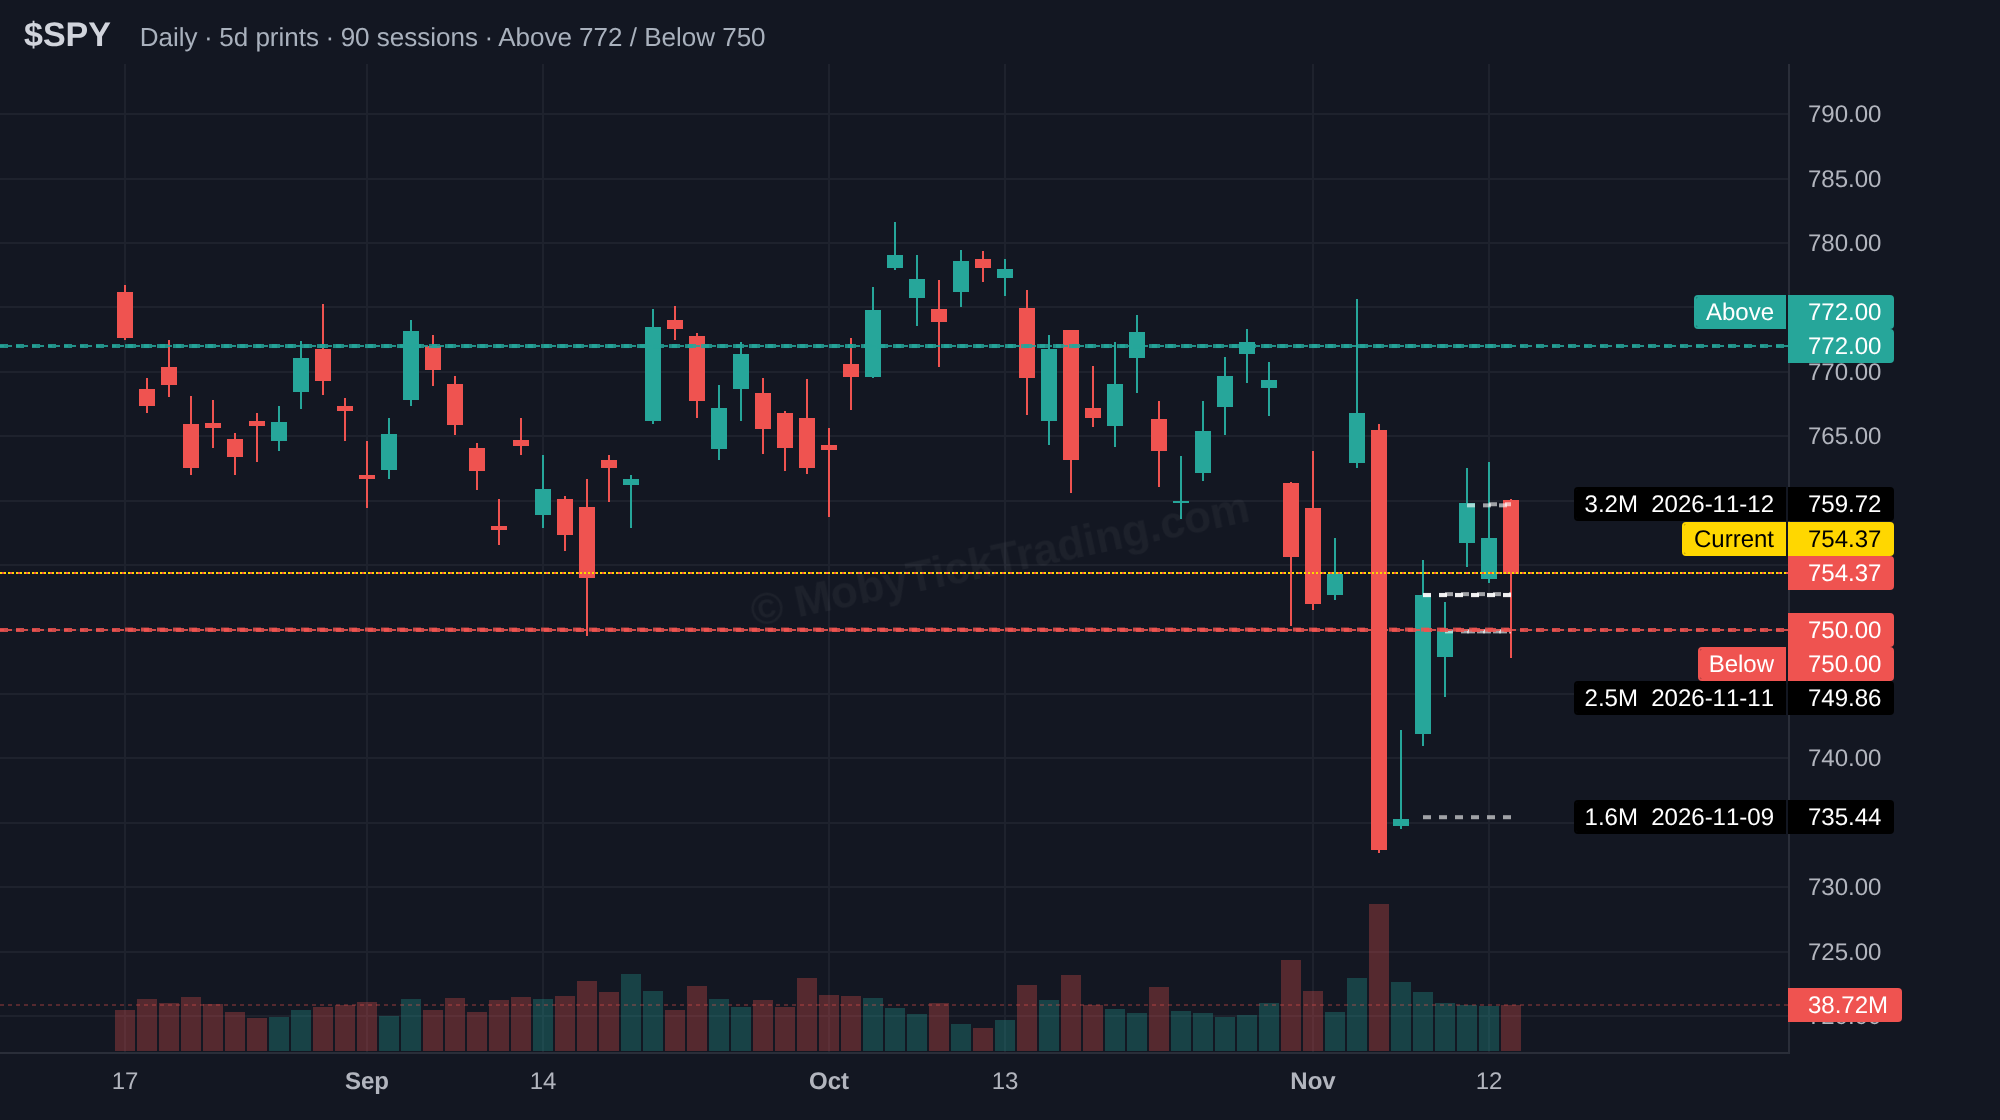
SPY
Upper reference $772 → $775 → $777.50 → $780 → $785
Lower reference $750 → $745 → $740 → $735 → $732.50
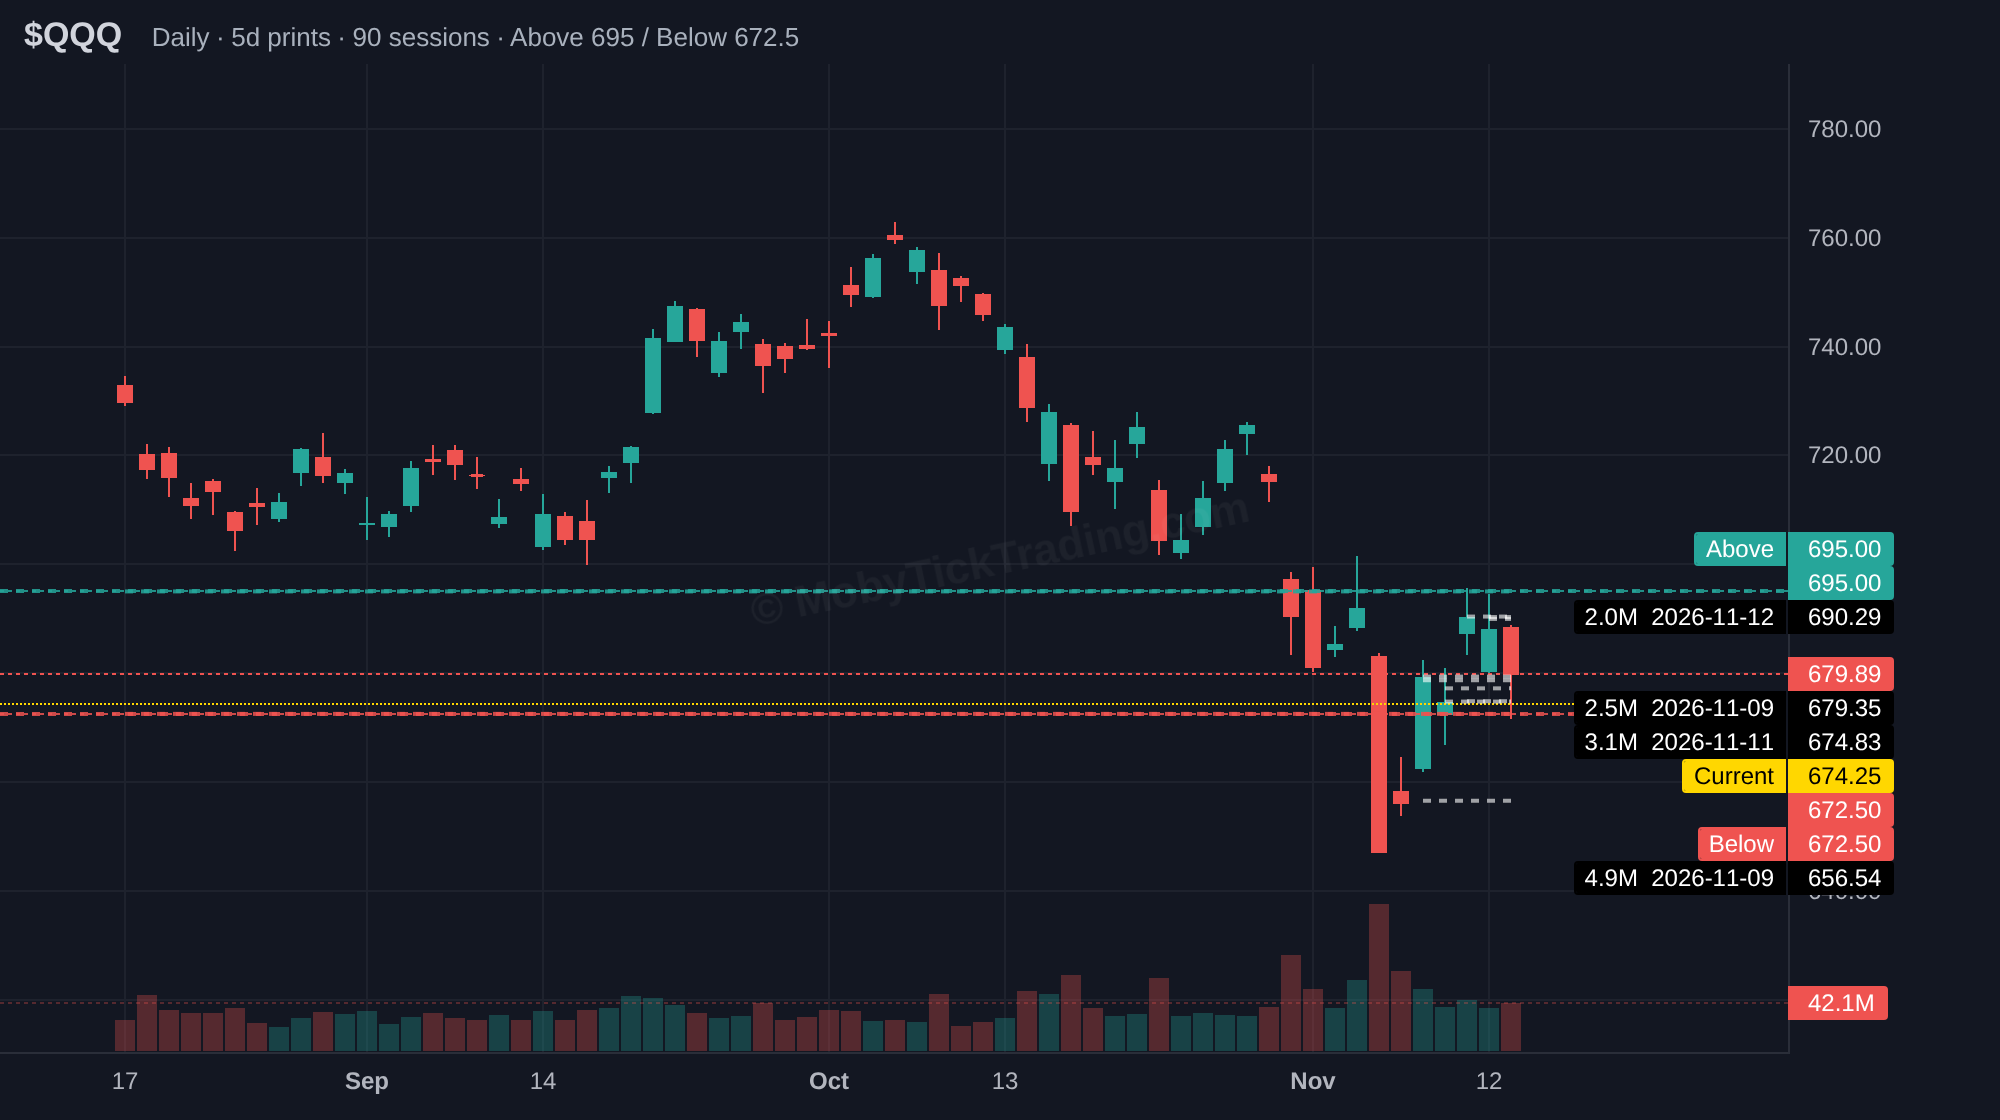
QQQ
Upper reference $695 → $697.50 → $700 → $705 → $710 → $715
Lower reference $672.5 → $670 → $665 → $660 → $657 → $650
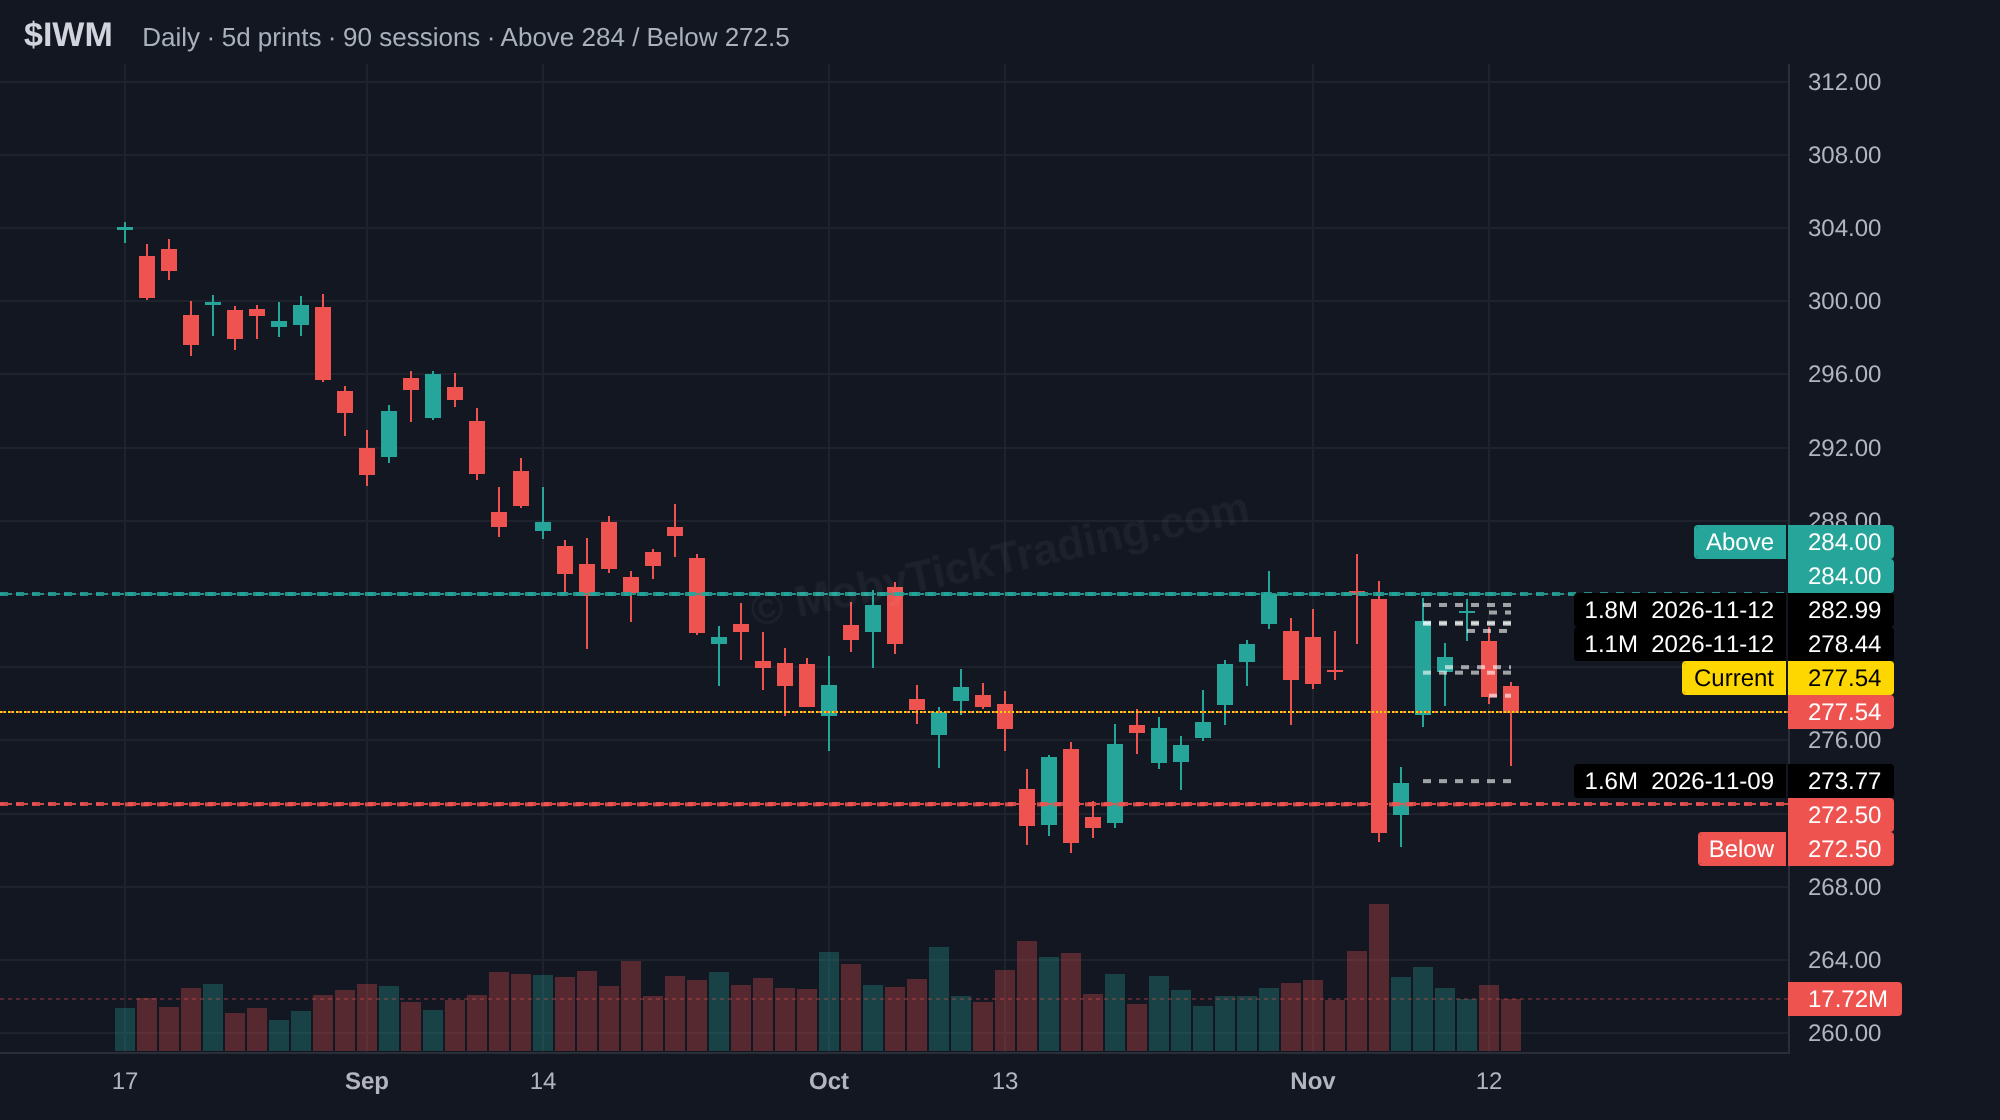
IWM
Upper reference $284 → $285 → $287.5 → $289 → $292.5 → $295
Lower reference $272.5 → $270 → $267.5 → $265 → $262.5 → $260
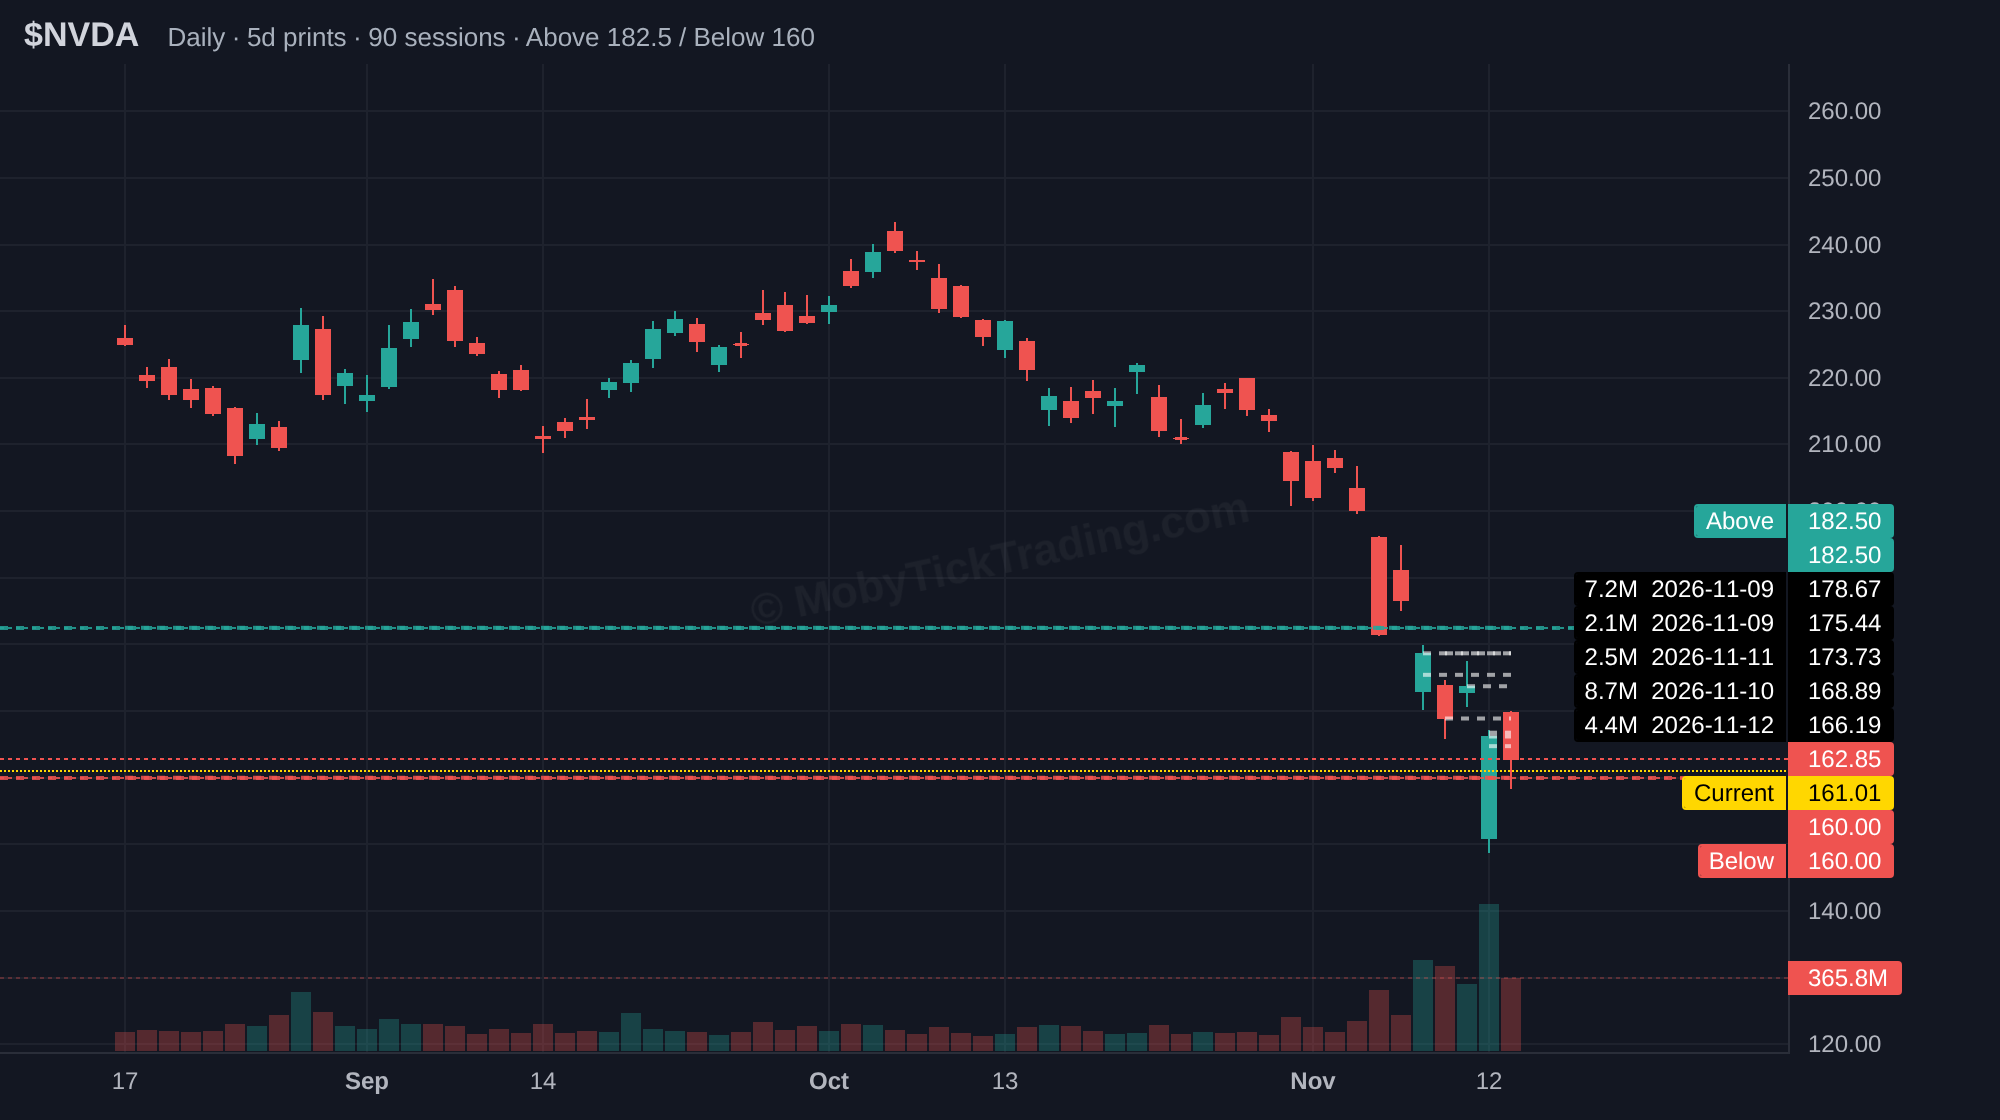
NVDA
Upper reference $182.5 → $185 → $190 → $195 → $200 → $205
Lower reference $160 → $155 → $152.50 → $150 → $147.5 → $145
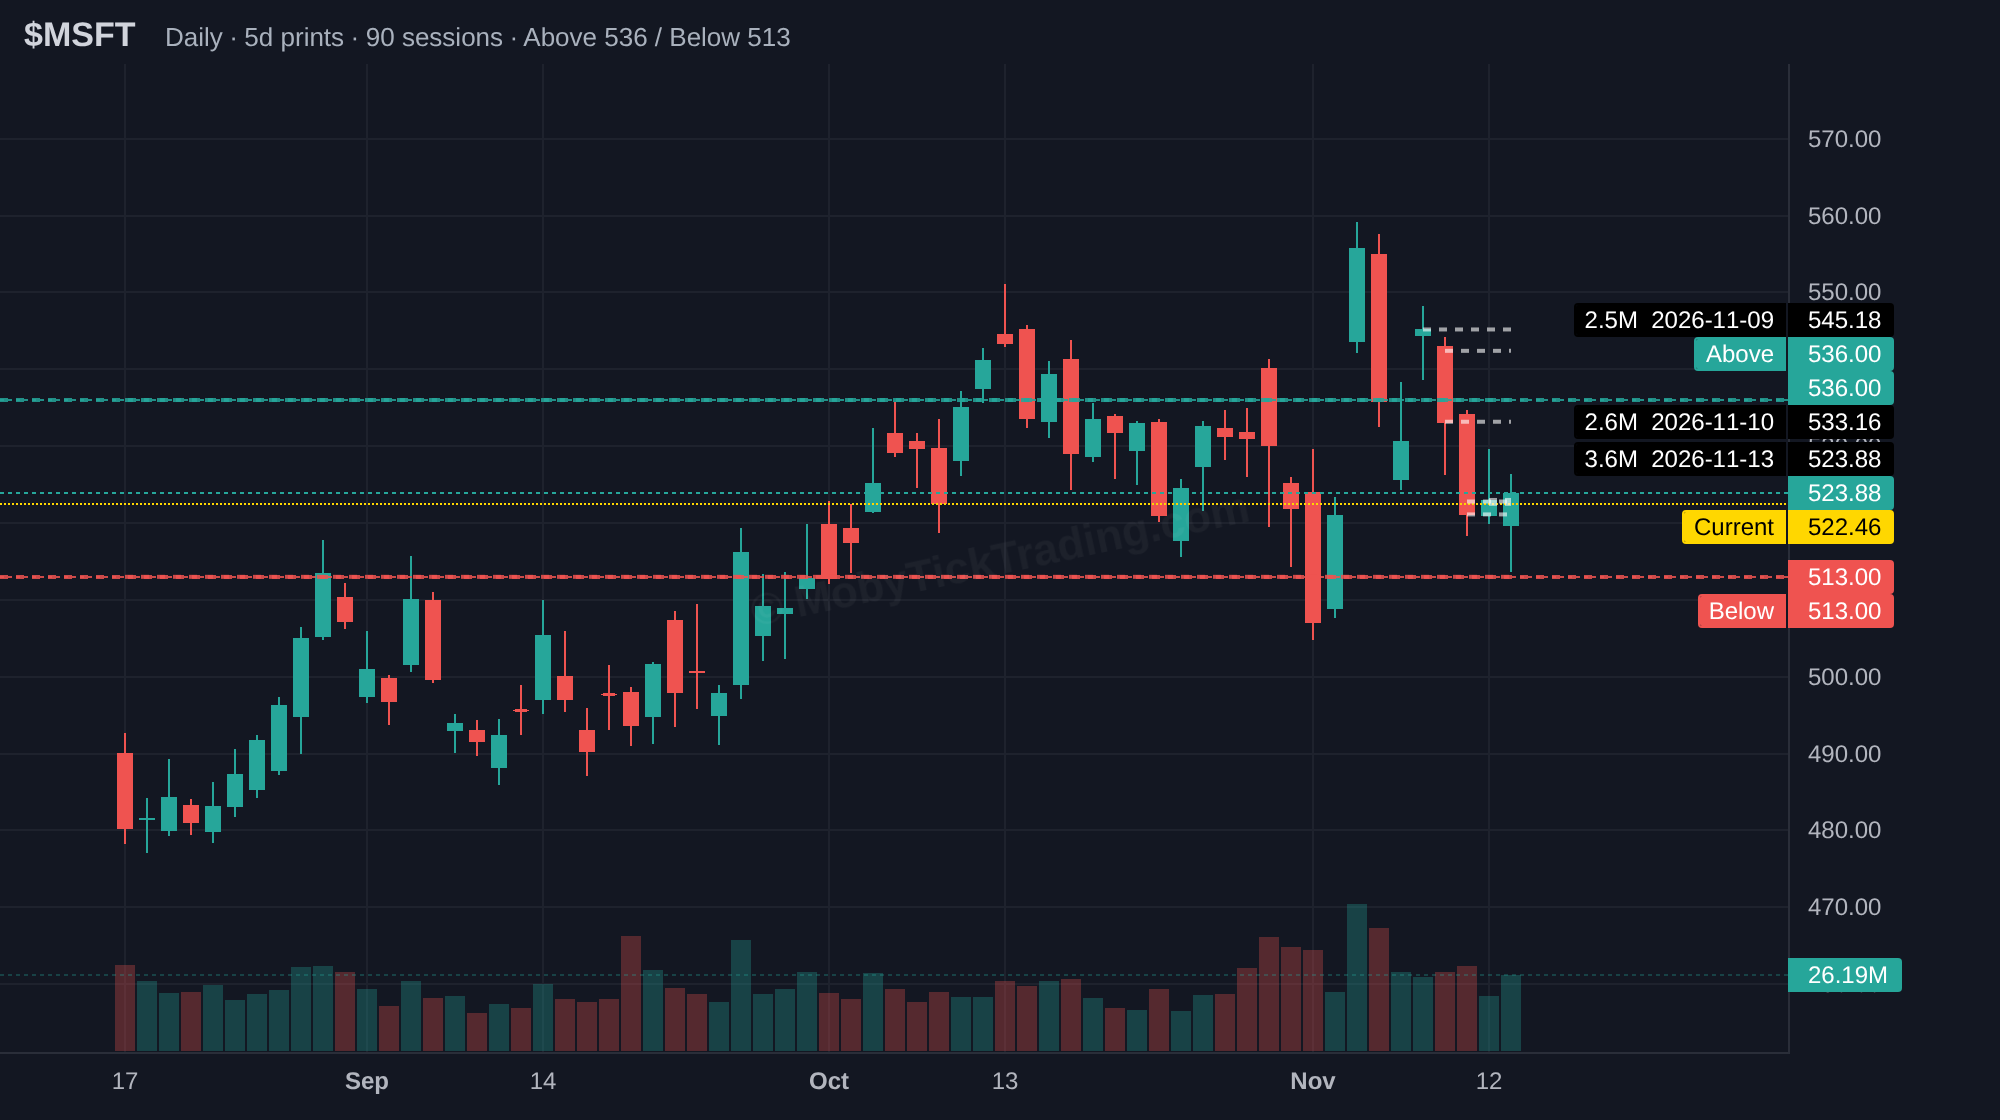
MSFT
Upper reference $536 → $540 → $545 → $550 → $555 → $560
Lower reference $513 → $510 → $505 → $500 → $490 → $480
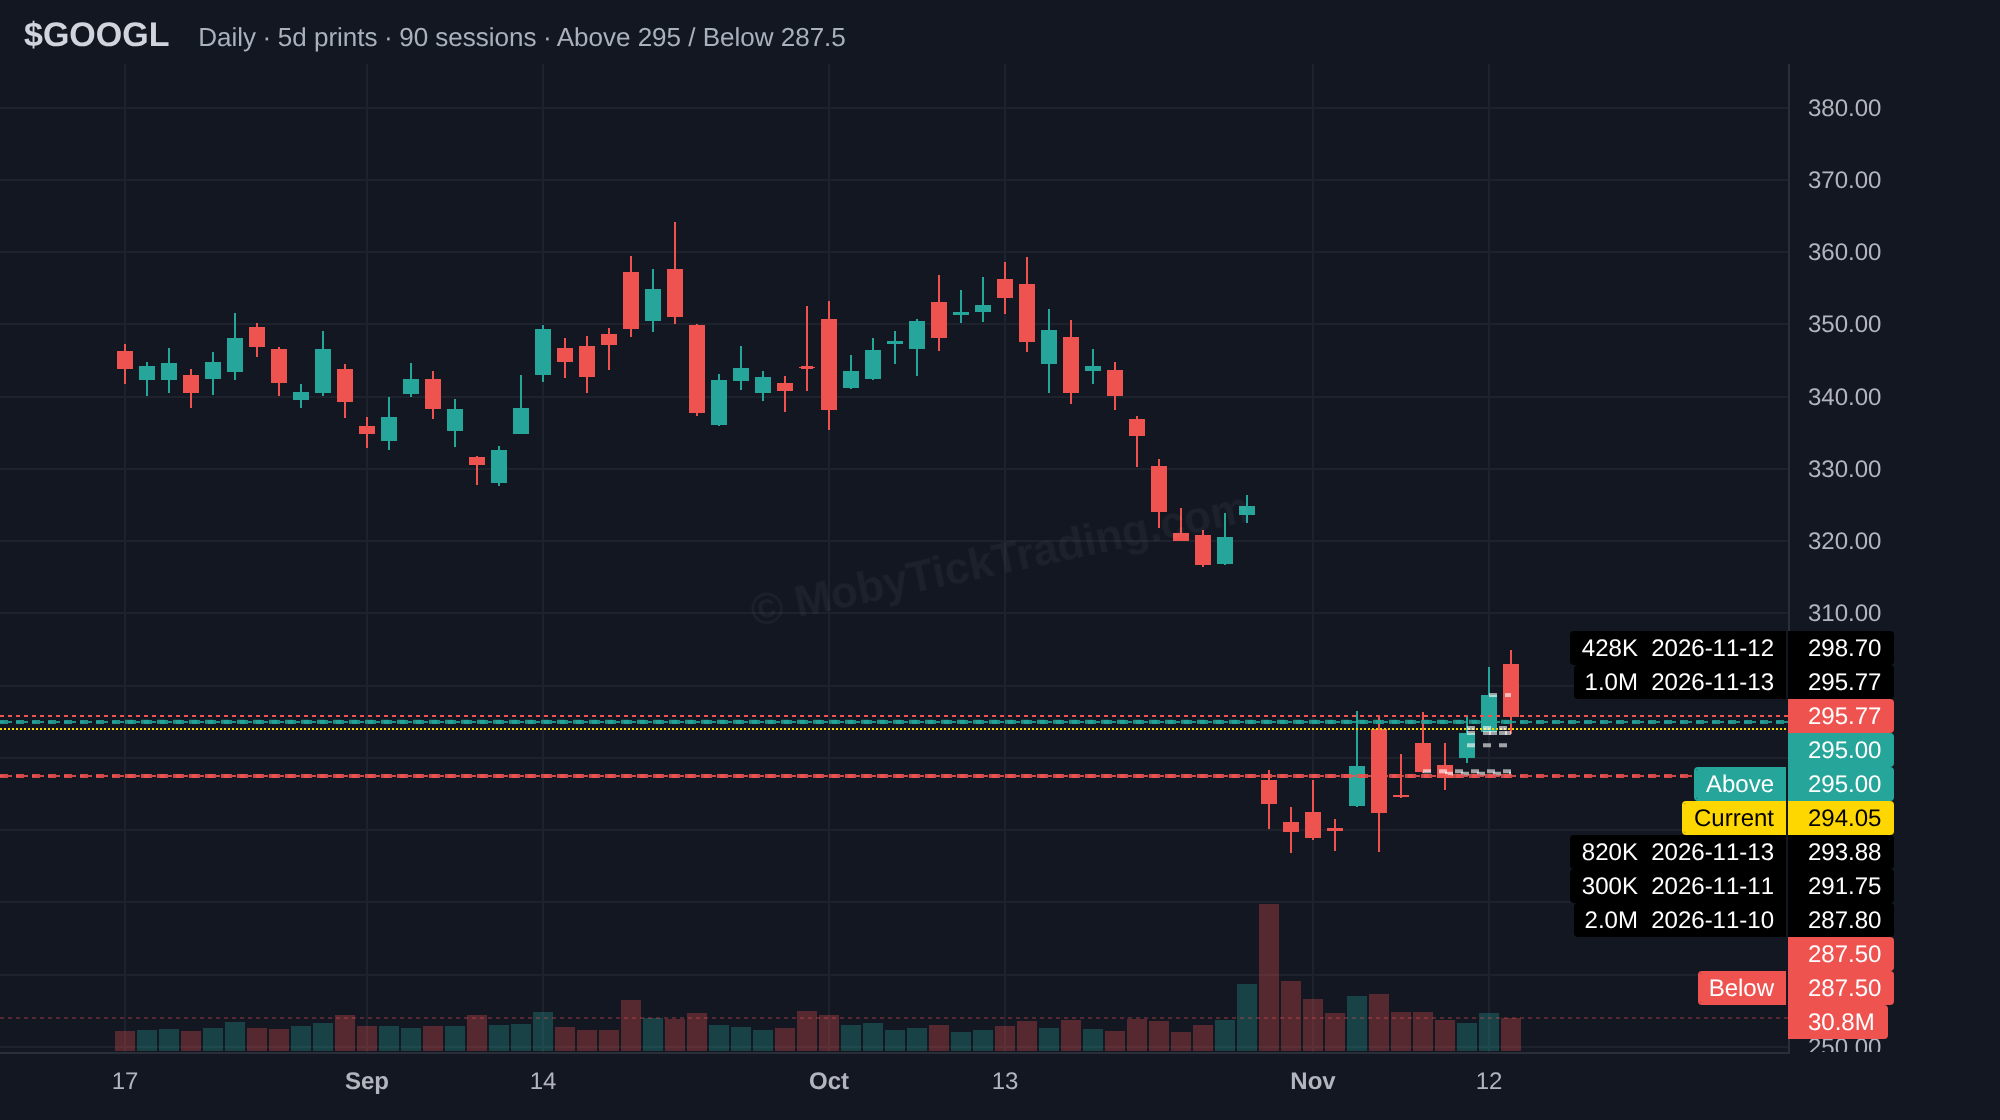
GOOGL
Upper reference $295 → $300 → $310 → $315 → $317.50 → $325
Lower reference $287.5 → $285 → $280 → $275 → $270 → $260
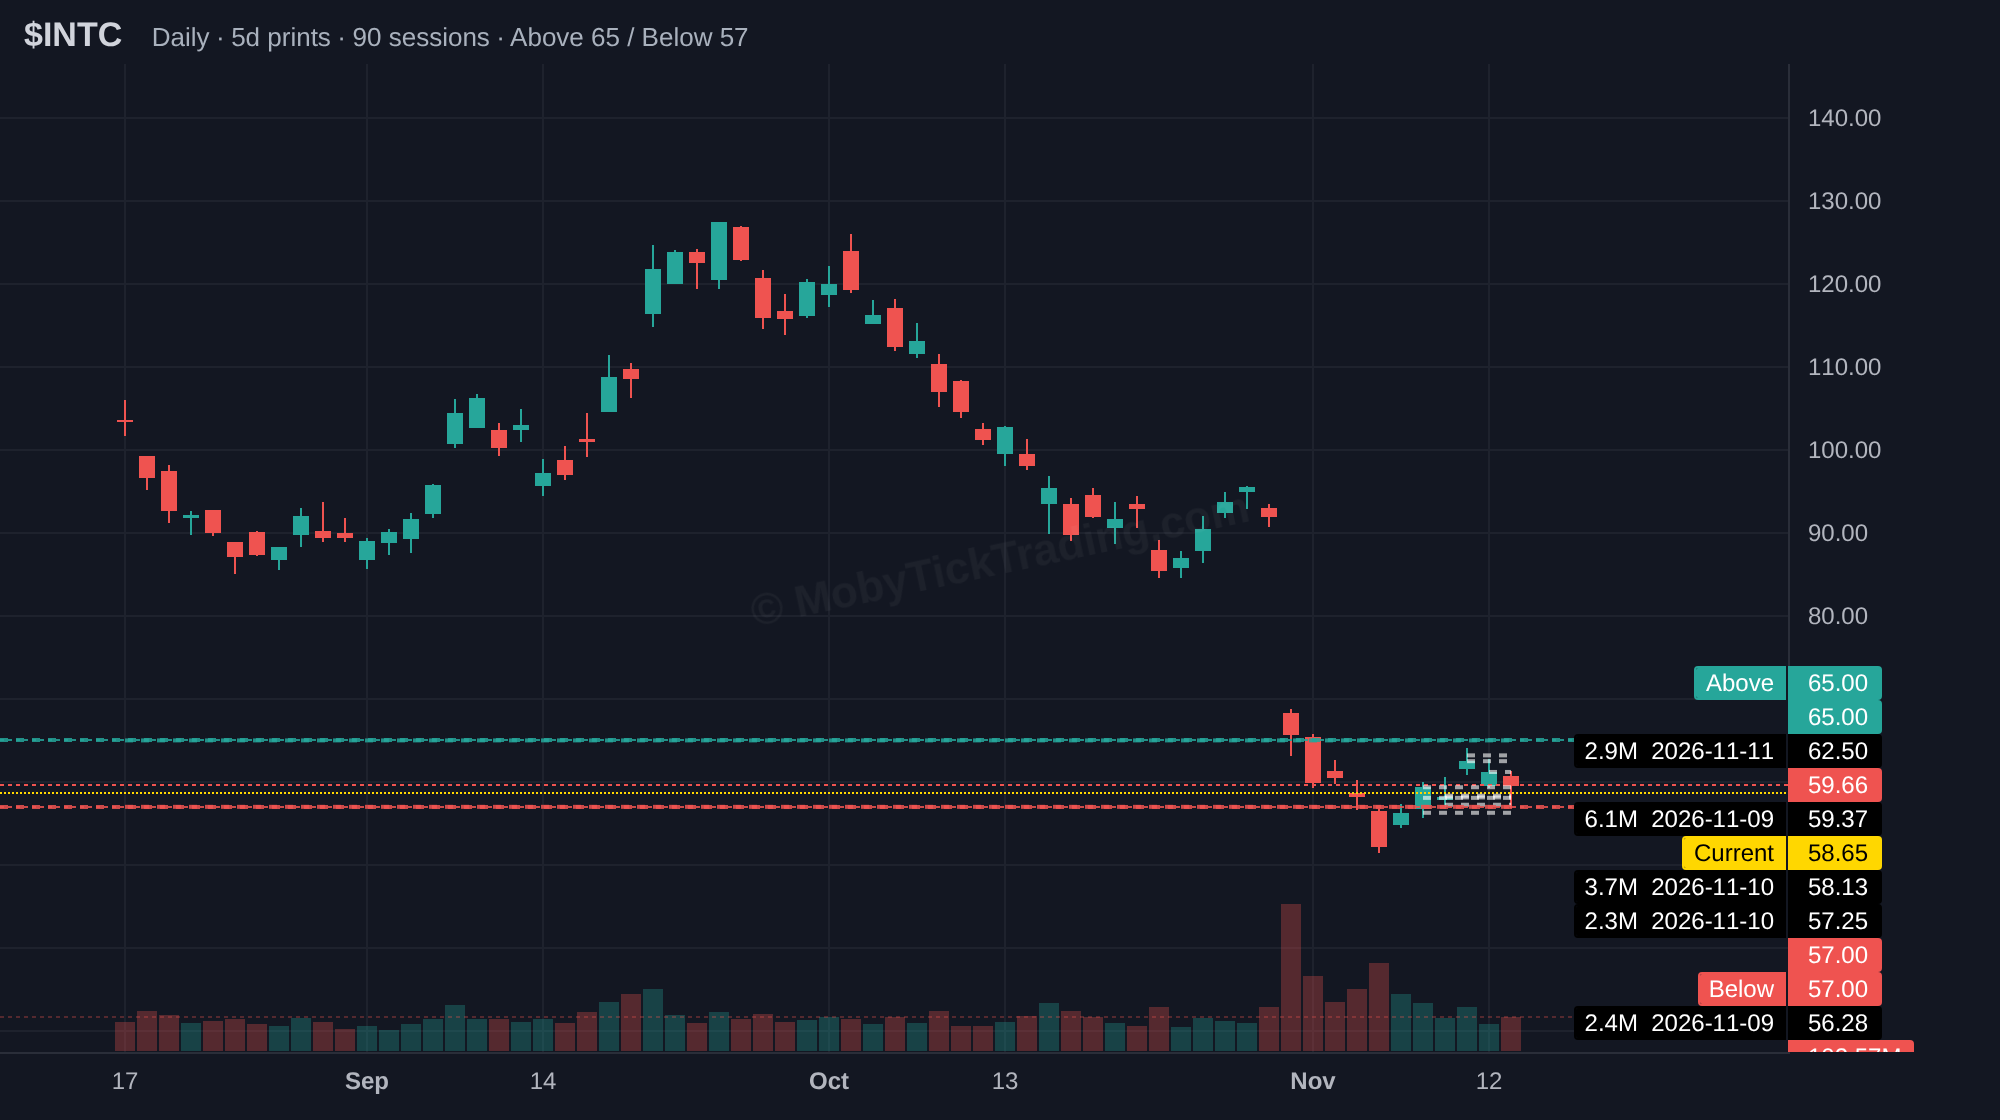
INTC
Upper reference $65 → $66.25 → $67.5 → $70 → $72.5 → $75
Lower reference $57 → $55 → $52.50 → $50 → $47.5 → $45
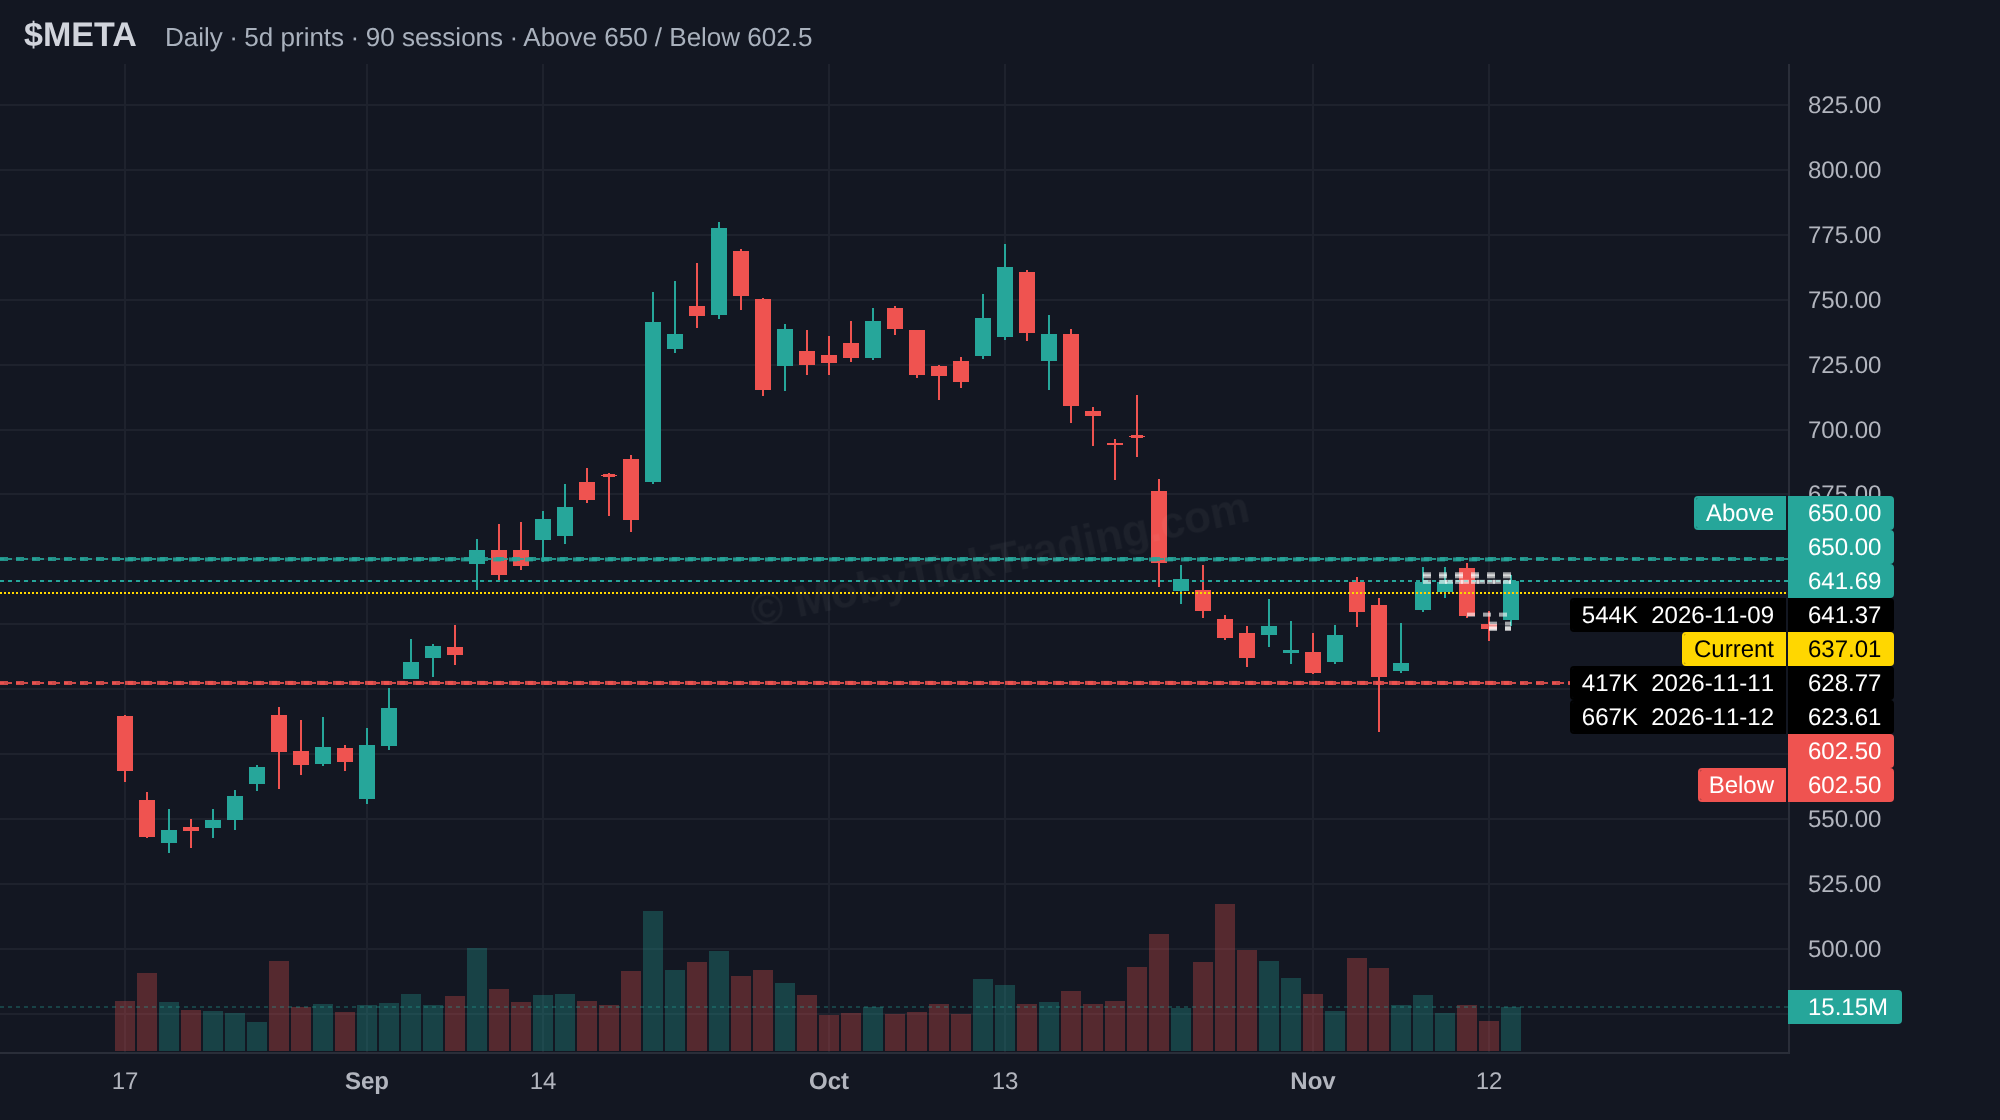
META
Upper reference $650 → $660 → $670 → $680 → $700
Lower reference $602.5 → $600 → $590 → $580 → $570 → $560 → $550
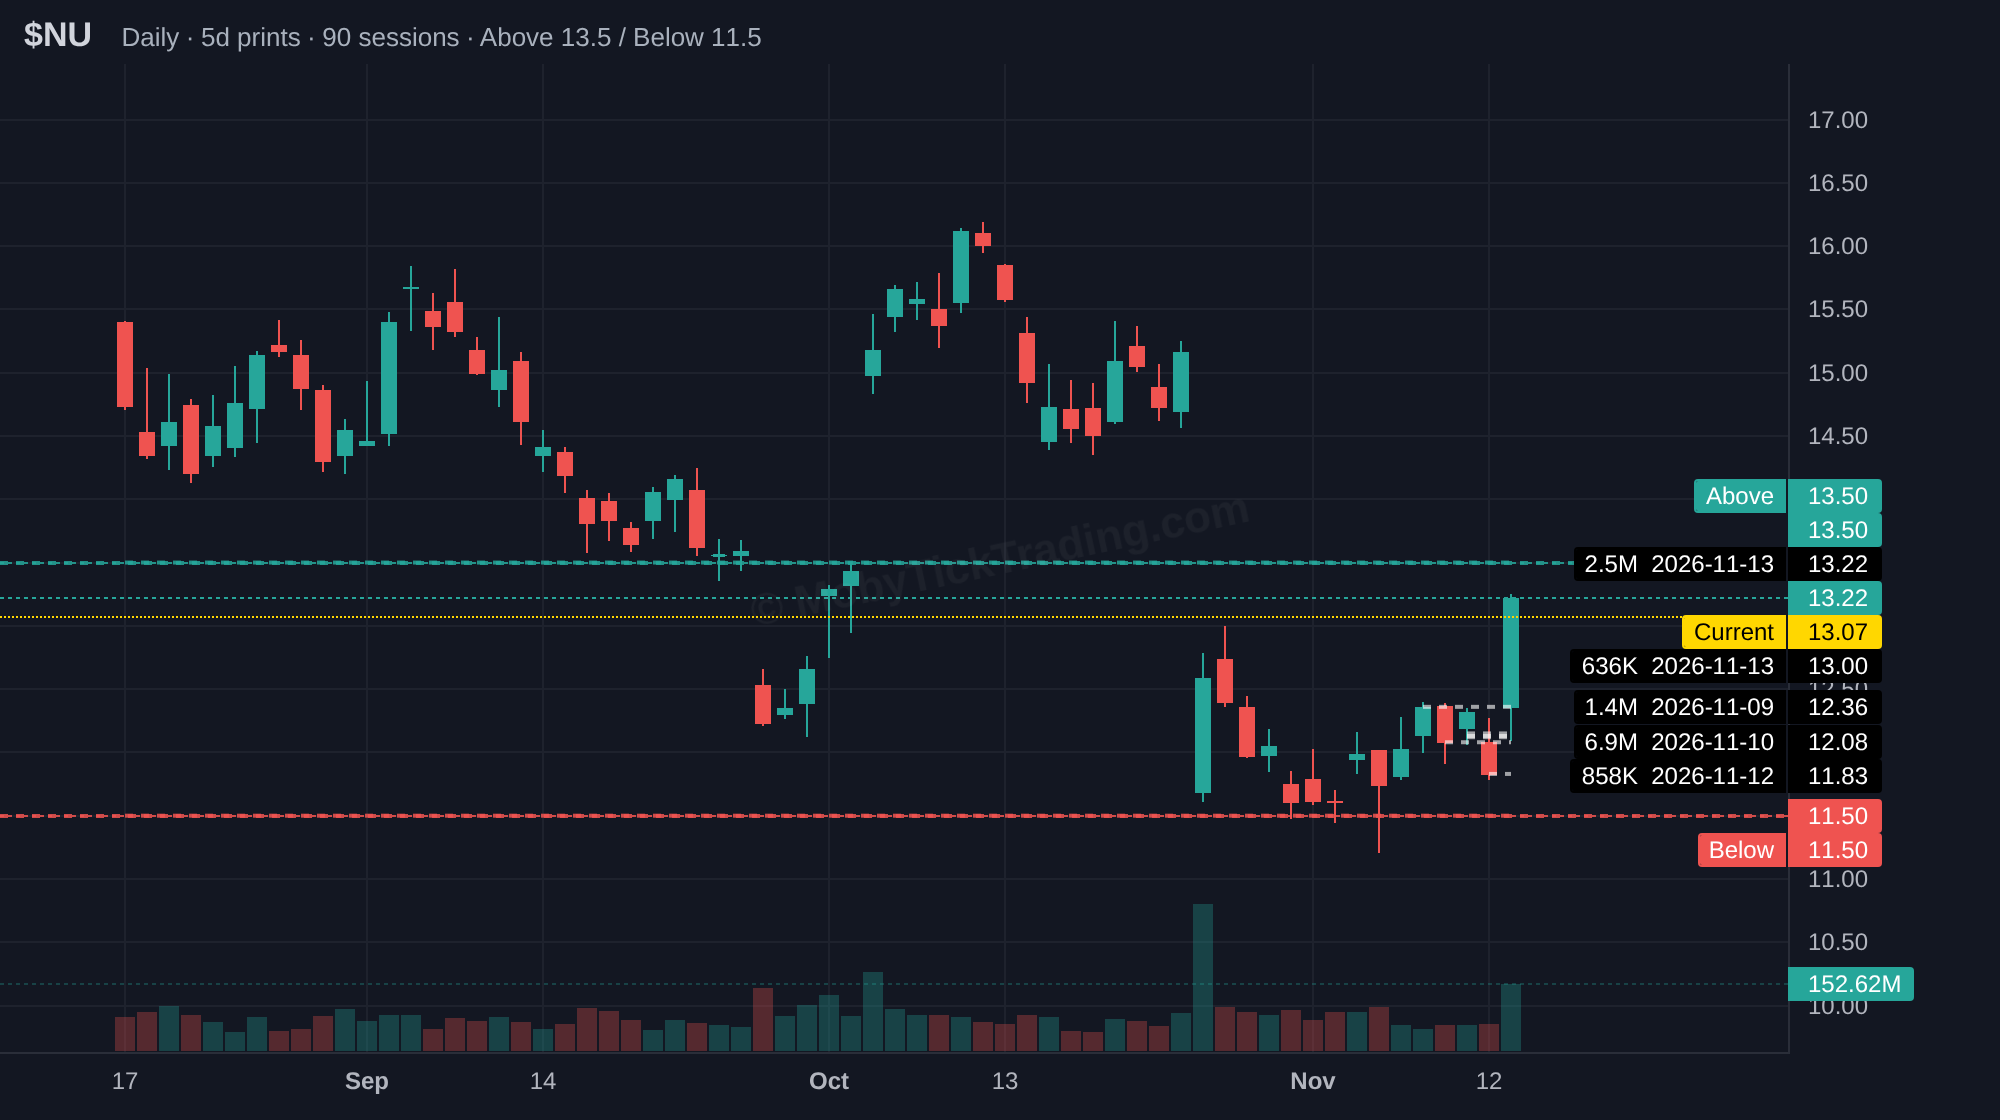
NU
Upper reference $13.50 → $13.8 → $14 → $14.86 → $15 → $16
Lower reference $11.50 → $11.20 → $11 → $10.5 → $10 → $9
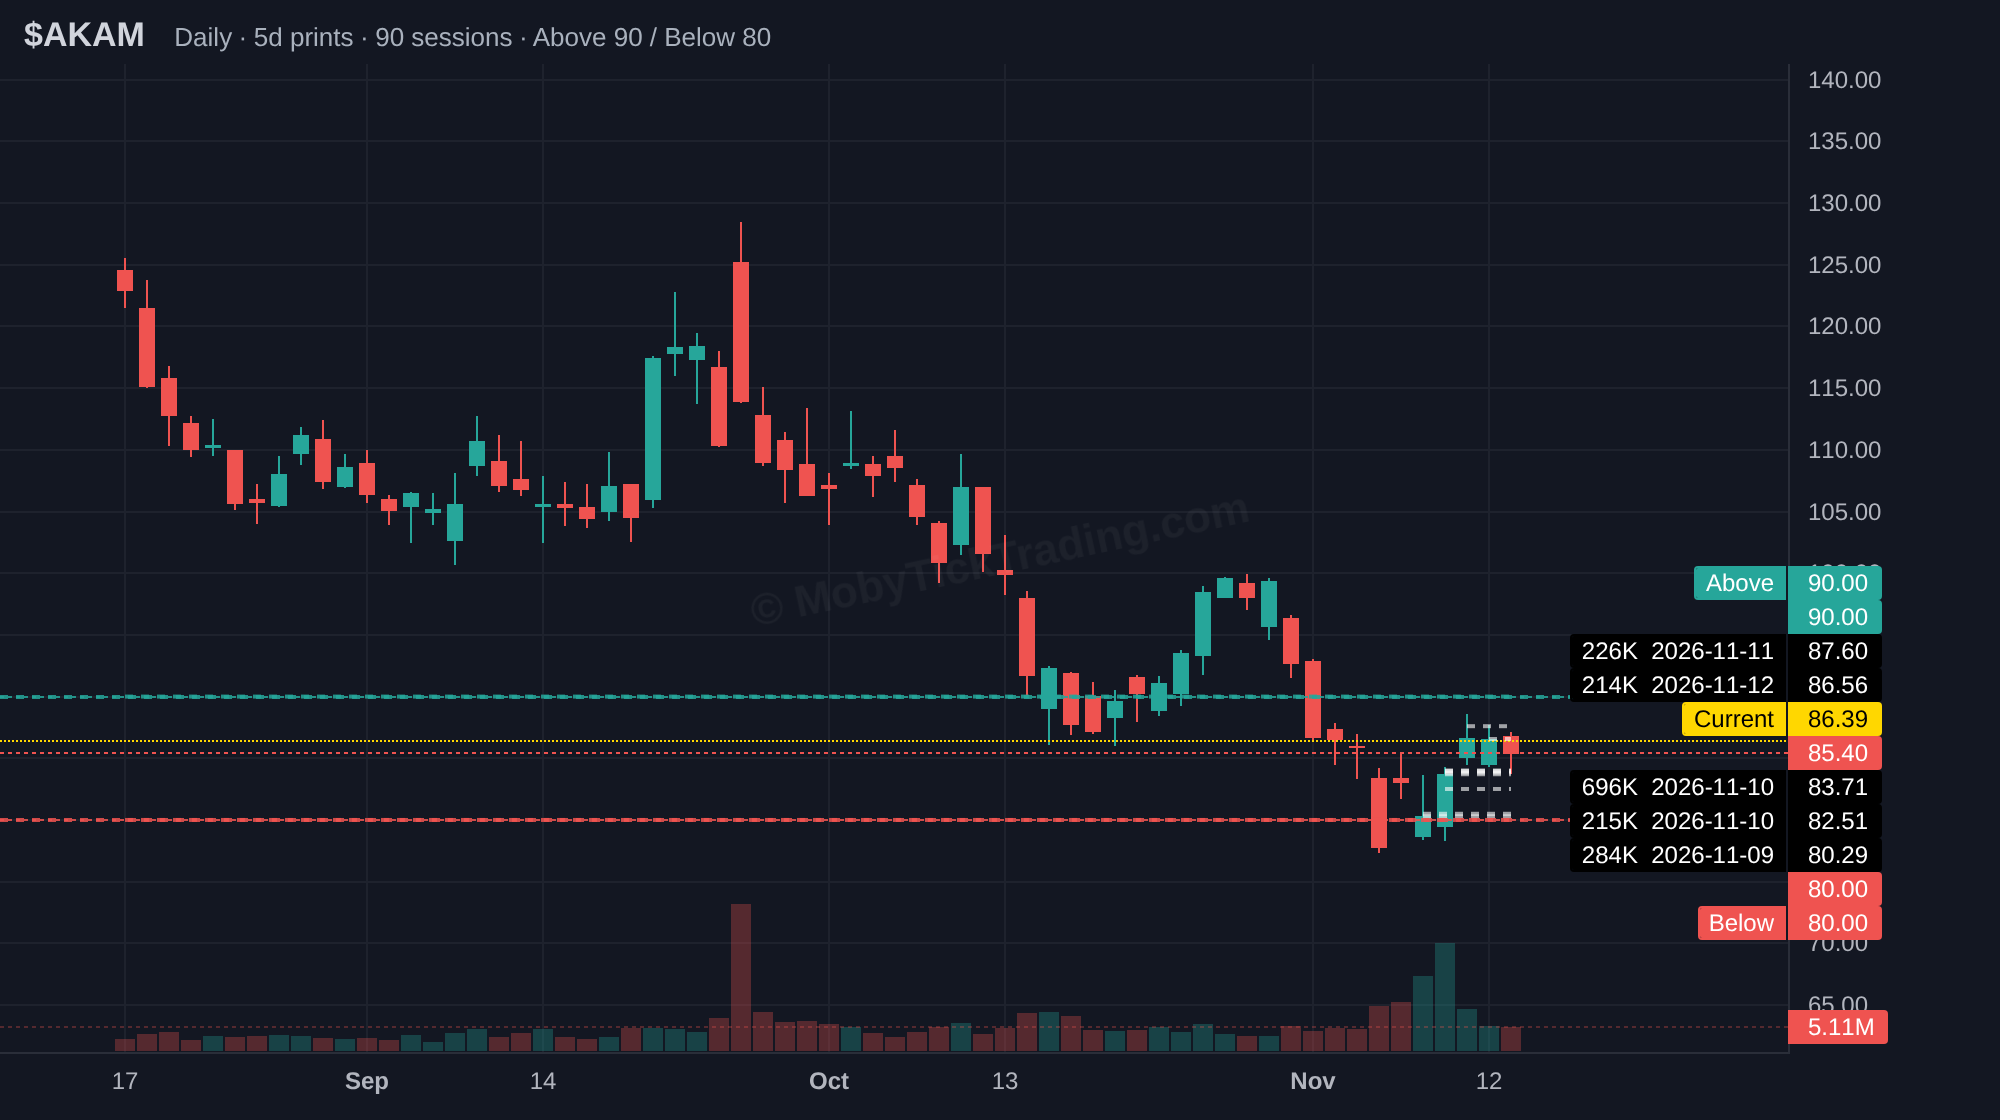
AKAM
Upper reference $90 → $92.5 → $95 → $97.50 → $99 → $100 → $102.5
Lower reference $80 → $77.5 → $75 → $72.5 → $70
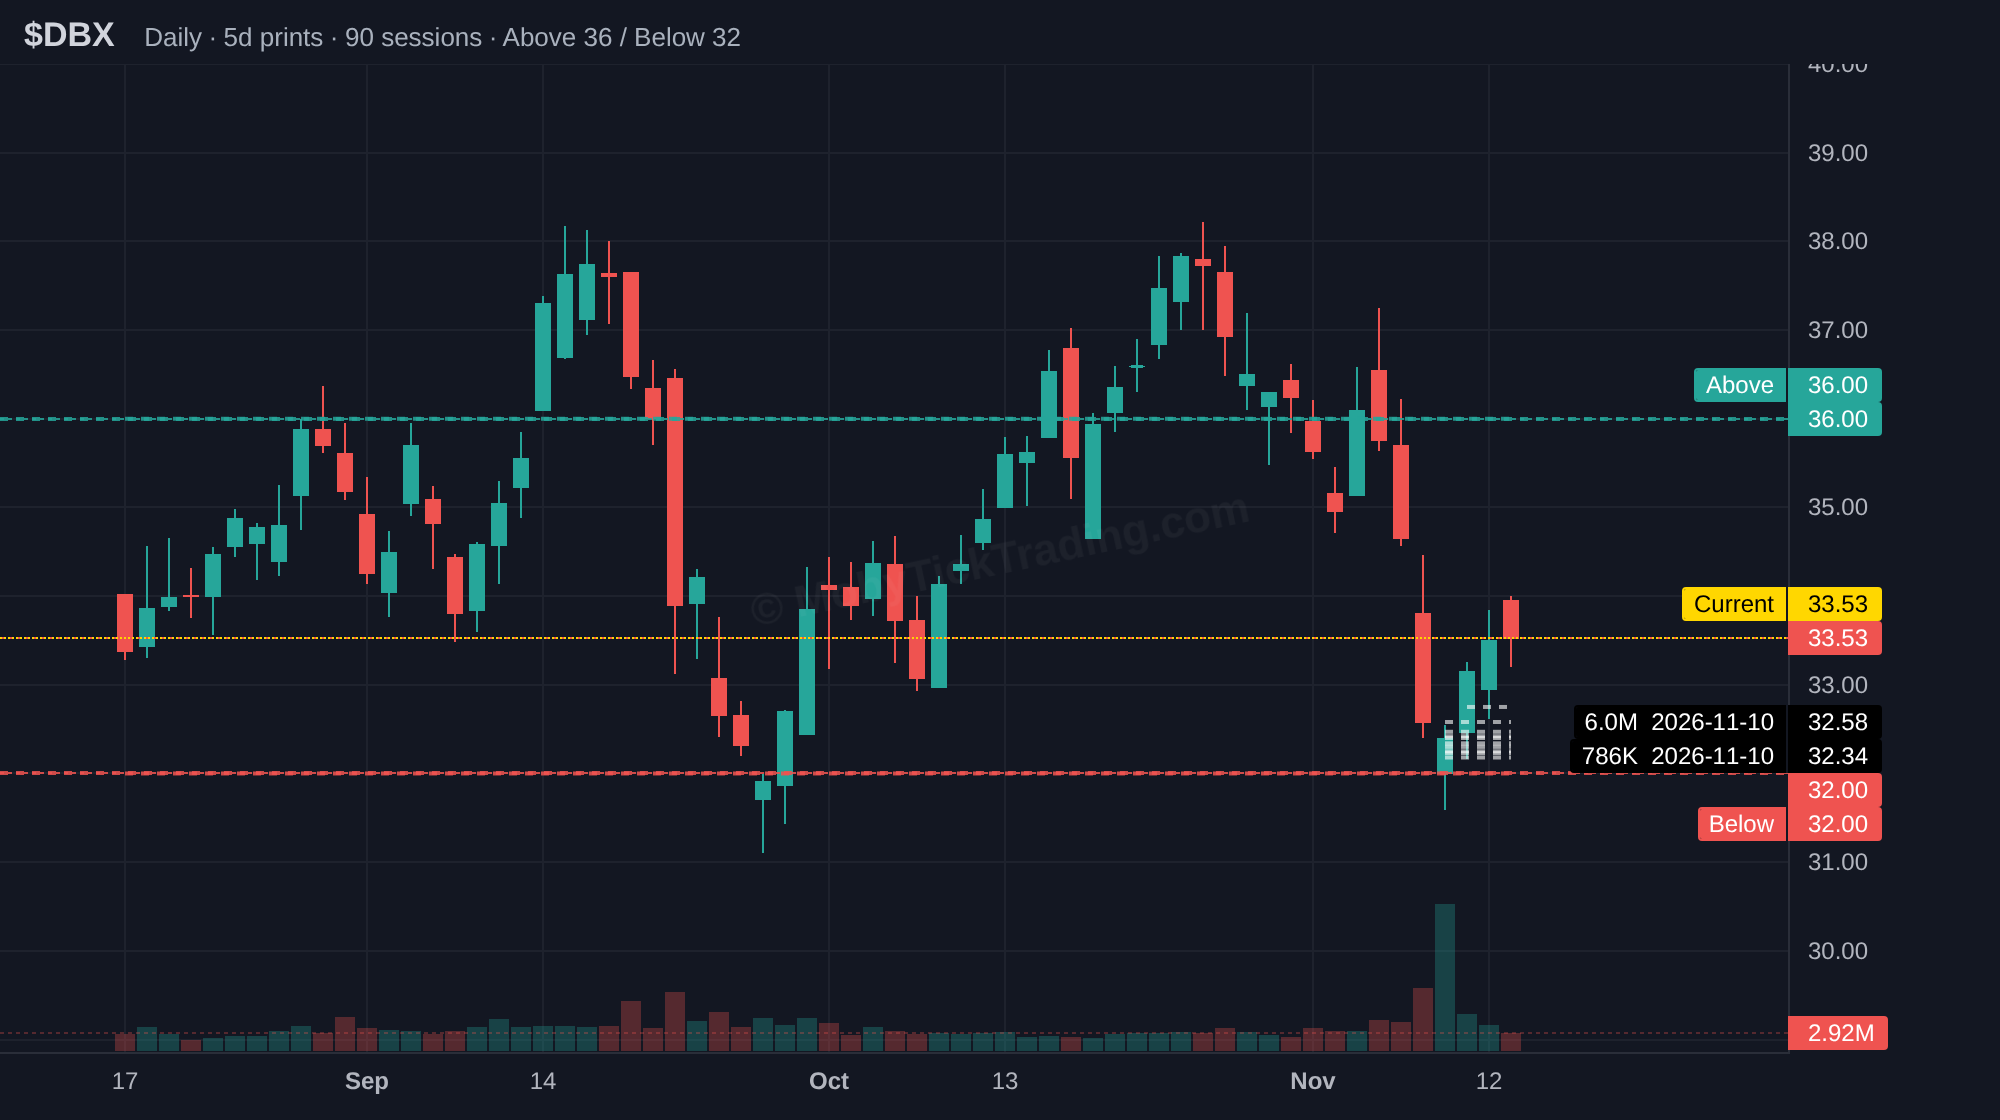
DBX
Upper reference $36 → $37 → $39 → $40
Lower reference $32 → $31 → $30 → $29 → $28 → $27.5
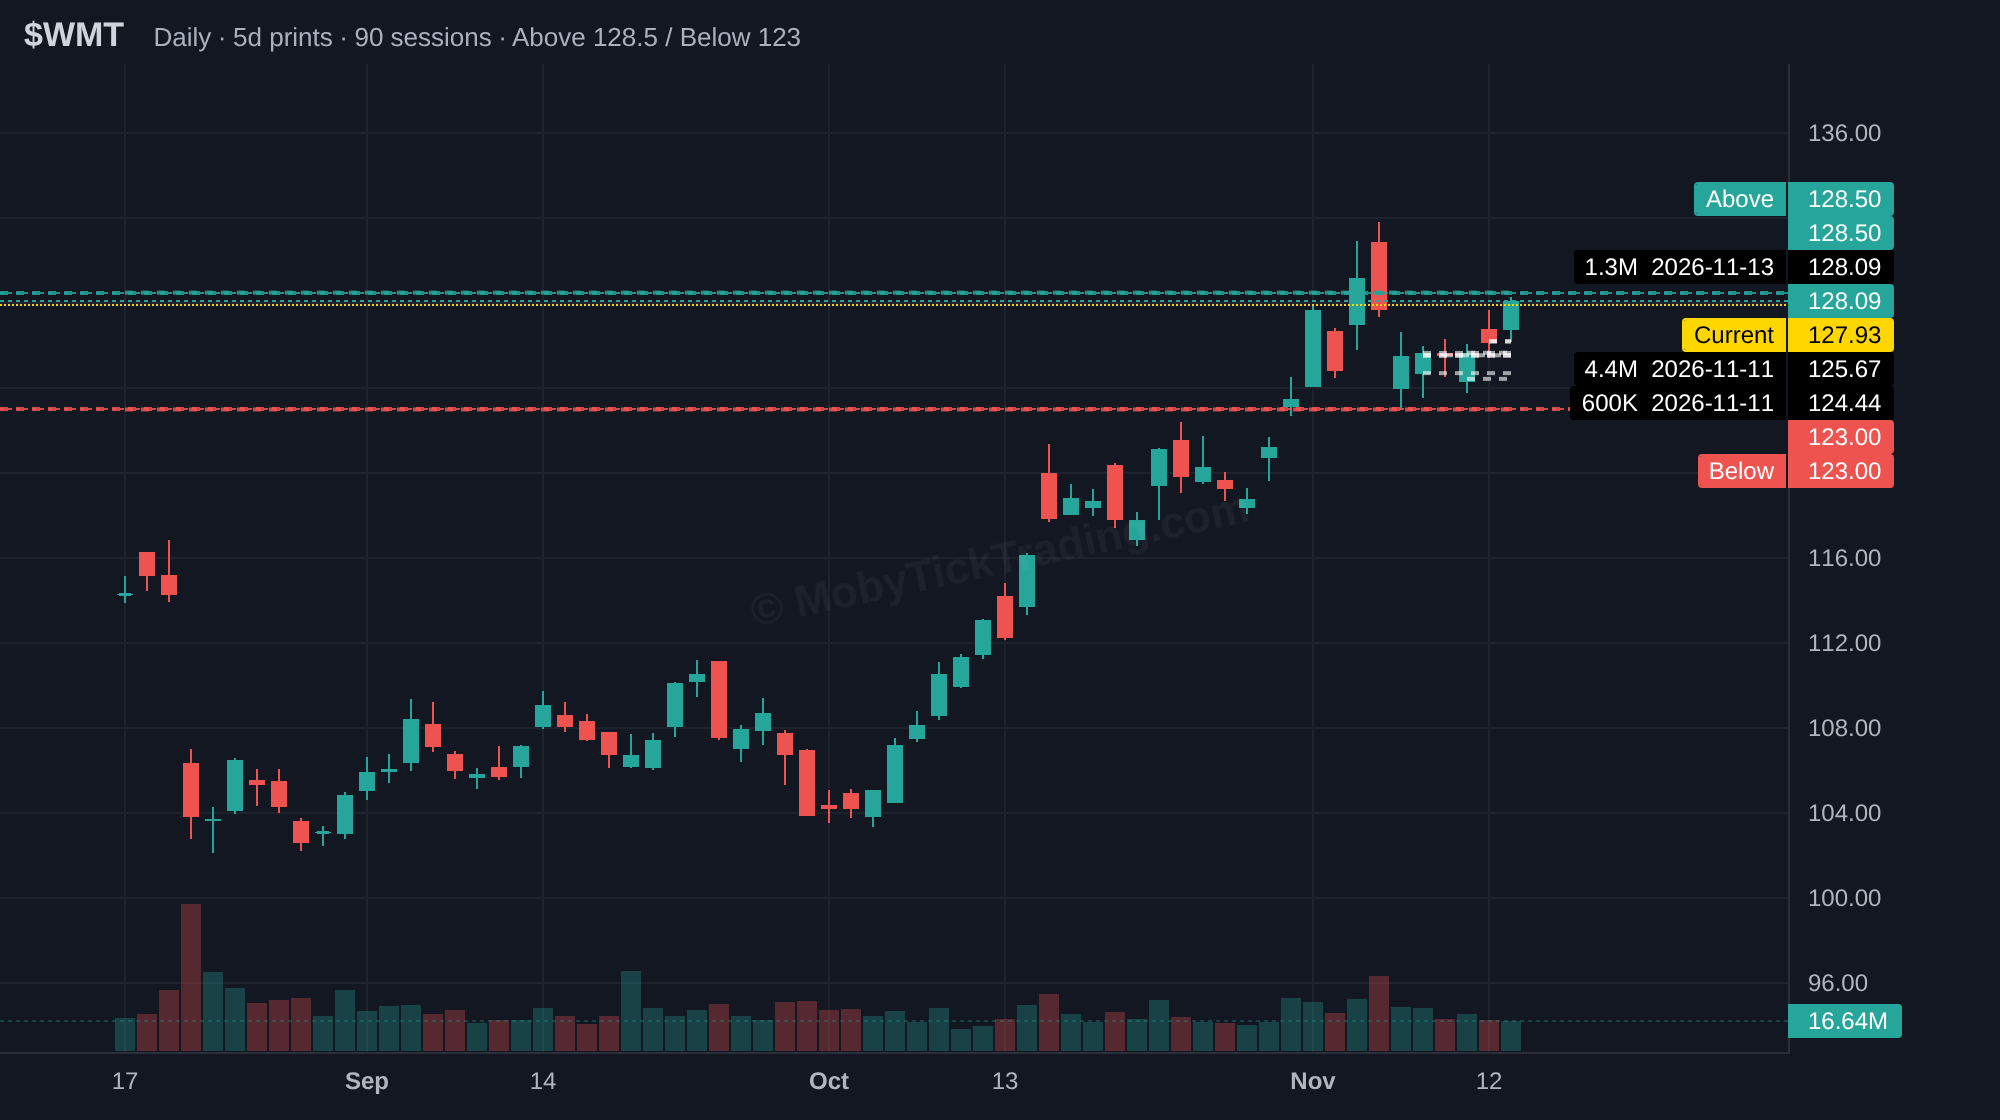
WMT
Upper reference $128.5 → $130 → $131.25 → $132.5 → $135 → $137.5
Lower reference $123 → $122 → $120.75 → $120 → $119 → $118 → $117
XLP
Upper reference $92.50 → $93.25 → $95 → $97.5 → $100
Lower reference $89 → $88 → $87 → $86 → $85 → $84
ETF Dark Pool Flow
Figures cover Monday 11/09 through Friday 11/13, as of the Friday close, and count validated MobyTick dark pool prints of 50,000 shares or more, with closing prints removed. “Flow VWAP” is the volume-weighted average price of those prints. These are block-print totals, not fund flows.
Broad-market ETFs printed $21.56B in block flow, about seven times the $3.01B in the eleven sector SPDRs. QQQ accounted for more than half of that on its own: $11.71B across 106 prints, at a flow VWAP of 682.60. It closed at 679.89, 0.40% under that level, after a +3.63% week in a 662.02-695.57 range. SPY followed with $3.38B over 30 prints and closed almost exactly on its flow VWAP (754.37 vs 754.30), up 2.59% on the week. IWM drew $2.72B over 71 prints and finished 1.08% below its 280.57 flow VWAP, the widest gap in the group. IVV ($1.95B) and VOO ($1.73B) closed slightly under theirs; DIA was smallest at $86M over three prints.
All eleven sectors finished the week higher. XLF was the largest by block flow at $1.08B over 53 prints, closing at 58.68 against a 58.30 flow VWAP. Seven of the eleven closed at or above their own flow VWAP; XLRE, XLK, XLB and XLY closed below.
| ETF | Block flow | Close vs VWAP | Week % |
|---|---|---|---|
| XLF | $1.08B | +0.65% | +2.66% |
| XLP | $434M | +1.37% | +2.52% |
| XLE | $388M | +3.19% | +5.42% |
| XLK | $227M | -0.28% | +3.36% |
| XLI | $221M | +0.11% | +3.76% |
| XLU | $189M | +0.35% | +2.11% |
| XLRE | $139M | -0.83% | +0.84% |
| XLV | $121M | +0.40% | +2.19% |
| XLB | $116M | -1.20% | +0.54% |
| XLY | $53M | -0.65% | +2.04% |
| XLC | $48M | +1.23% | +3.72% |
XLE was the best sector at +5.42%, closing at 64.96, 3.19% above its 62.95 flow VWAP. XLP closed at 92.35, the top of its week range.
Outside the SPDRs, SMH printed $2.25B over 22 prints at a 489.57 flow VWAP and closed at 486.75 (-0.58%) after a +4.91% week. GLD printed $1.69B over 30 prints; it fell 4.58% on the week and closed at 355.45, 0.62% under its 357.68 flow VWAP. GDX showed the widest gap: $242M over 23 prints at 87.21, with a Friday close of 81.64, 6.39% below that level, on a -6.80% week.
Education: When Dark Pool Levels Meet Options Expiration
*Dark Pool Weekly Report — Educational Section — Week of November 16, 2026*
Next Friday, November 20, is monthly options expiration (“opex”). It’s one of the few days each month when a second large force joins the dark pool money in deciding where price settles. If you know where both forces line up, you can usually tell which levels are likely to act as magnets or walls this week and which are only noise.
Two forces, one chart
Dark pool levels are the prices where institutions have already put serious money to work. When a fund buys or sells millions of dollars of stock at one price, it tends to defend that price, add to it, or come back to it. That’s why the levels in this report so often act as support and resistance.
Options strikes work differently. The force there comes from the market makers, the dealers who took the other side of all those contracts, rather than from the traders who bought them. Dealers hedge their exposure by buying and selling the underlying stock, and that hedging gets most intense in the days before expiration. Strikes with a lot of open contracts start to pull price toward them, or push it away. That’s the “pin” you sometimes see on expiration Friday, when a stock drifts to a round strike and stays there all afternoon.
Each force matters by itself. When both show up at the same price, it means two different groups of large players care about that exact level, and the level becomes much harder to ignore.
How to spot the overlap
- Start with this week’s dark pool levels. Use the Above/Below trigger levels and targets in this report.
- Check the strikes near those levels for the expiration that’s coming up. For this week, that means the Nov 20 contracts. Look for strikes with unusually heavy activity or open interest.
- Mark where they overlap. A dark pool level within a strike or two of a heavy options strike is a level to put alerts on this week.
- Watch how price behaves there, especially Wednesday through Friday. If price stalls and chops near the level, the pin may be in play. If price slices through with volume, the hedging can flip and speed the move up. That’s when a wall breaks.
Where the levels line up this week
SPY: the 750 / 740 zone
SPY closed the week near 754. Our below trigger is 750, with targets at 745 and 740. On Friday, the Nov 20 options flow was concentrated at exactly those strikes: thousands of contracts traded at the 750 and 751 puts, and more heavy blocks hit the 740 puts. Moby Tick’s institutional print levels also show support near 739.93. In other words, the 750 trigger and the 740 target both line up with heavy options activity and, in 740’s case, a dark pool support level. If SPY loses 750 this week, 740 is where we expect the real fight to happen.
NVDA: sitting right on the 160 line
NVDA closed near 162.85, just above our below trigger at 160. Friday’s Nov 20 flow was concentrated at that strike and the ones next to it: about 1,000 contracts in the 160 calls, nearly 1,850 in the 162.50 puts, and a large short-dated 160 put block on top. Above price, thousands of contracts traded at the 170 and 177.50 calls. NVDA is boxed in going into opex. 160 is the line the dark pool data and the options market both care about, and a clean break below it opens up our 155 and 152.50 targets.
What to remember
- Confluence isn’t a prediction. It tells you where a reaction is likely, not which direction it will go. Wait for price to show you what it’s doing at the level.
- Pins are strongest late in the week and fade quickly afterward. Once the Nov 20 contracts expire, the options pull at those strikes disappears. The dark pool level is still there.
- A broken wall can move fast. When price pushes through a heavy strike, dealers may have to chase the move, so breakouts during opex week can travel further than usual.
Go deeper
Our free options market structure series covers this in detail:
- Episode 6: Max Pain Myth vs. Pinning — Why Prices Stick at Strikes Near Expiry — [Watch on YouTube](https://youtu.be/g0BtR8rCswM)
- Episode 7: When Dark Pool Prints and Options Levels Agree — [Watch on YouTube](https://youtu.be/fq_f2sCAxAU)
New to the series? Start with Episode 1: Who Actually Takes the Other Side of Your Options Trade? — [Watch on YouTube](https://youtu.be/jcNpzDDulUw)
On Moby Tick, you can see dark pool prints alongside the options walls, GEX levels and max pain on the same chart, so you don’t need to compare them by hand. [Start your free trial](https://mobyticktrading.com/pricing).
*This section is for educational purposes only and isn’t financial advice. Options involve significant risk and aren’t suitable for every investor. Levels and flow are based on data as of the close on Friday, November 13, 2026.*
Ready to Trade with Whale-Level Insight?
Get institutional-grade dark pool intelligence delivered to your inbox every week.


Disclaimer: This newsletter is for informational and educational purposes only. It does not constitute financial advice, investment recommendations, or solicitation to buy or sell securities. Trading stocks, ETFs, and options involves substantial risk of loss. Past performance is not indicative of future results.