Market Overview
All four index ETFs finished the week lower. SPY closed at 735.29, down 2.70% for the week, and QQQ fell 4.98% to 656.10. IWM lost 2.03% to 273.67 and DIA slipped 0.95% to 512.22. Most of the week’s move came in a single session. Through Wednesday, all four had closed above their October 30 levels, with SPY at 766.81, QQQ at 691.95, IWM at 284.02 and DIA at 533.11. Thursday took all four below where they started the week.
| ETF | Open | High | Low | Close | Week % | Prior Close |
|---|---|---|---|---|---|---|
| SPY | 759.45 | 775.64 | 732.71 | 735.29 | -2.70% | 755.72 |
| QQQ | 695.32 | 701.45 | 647.05 | 656.10 | -4.98% | 690.49 |
| IWM | 281.64 | 286.17 | 270.23 | 273.67 | -2.03% | 279.33 |
| DIA | 520.89 | 536.60 | 508.66 | 512.22 | -0.95% | 517.13 |
On Thursday, November 5, SPY opened at 765.47, touched 765.97 and fell to a low of 732.71 before closing at 733.00, down 4.32% on the day. Volume reached 125.9M shares, compared with 50.8M on Monday. QQQ opened at 683.12, touched 683.65 and closed at 647.05, down 6.49%. That close was also the session low and the low for the week. QQQ volume was 130.7M shares, against 54.7M on Monday. IWM closed at 270.98, just above its 270.52 session low. DIA set its weekly high of 536.60 during the session and closed at 514.27.
Friday recovered part of that move for three of the four. QQQ gained 1.40%, from 647.05 to 656.10, and IWM added 0.99%. SPY rose 0.31%. DIA was the exception, down 0.40% to 512.22, its lowest close of the week.
| Sector ETF | Sector | Week % | Close |
|---|---|---|---|
| GDX | Gold Miners | +13.63% | 87.60 |
| KWEB | China Internet | +9.41% | 24.88 |
| XLC | Communication Services | +4.90% | 104.79 |
| XLRE | Real Estate | +1.92% | 44.00 |
| XLY | Consumer Discretionary | +1.91% | 117.58 |
| XLF | Financials | +1.15% | 57.16 |
| XLP | Consumer Staples | +0.74% | 90.08 |
| XLV | Health Care | -0.04% | 184.80 |
| XLU | Utilities | -0.69% | 43.13 |
| XLB | Materials | -1.50% | 51.95 |
| XLI | Industrials | -2.83% | 162.67 |
| XLK | Technology | -8.23% | 164.74 |
| SMH | Semiconductors | -11.20% | 463.96 |
| XLE | Energy | -12.00% | 61.62 |
What Led and What Lagged
The spread between sectors was wide. Five of the eleven sector funds finished higher and six finished lower. XLE fell 12.00% to 61.62, the largest decline in the group and more than four times SPY’s 2.70% weekly loss. SMH dropped 11.20% to 463.96, more than double QQQ’s 4.98% decline. XLK lost 8.23% and XLI 2.83%. XLB, XLU and XLV each finished within 1.50% of unchanged, with XLV off just 0.04%.
On the other side, XLC gained 4.90%, the best of the sector funds. It closed at 99.90 on October 30, opened at 103.39 on November 4 and at 107.14 on November 5, and ended the week at 104.79. XLRE added 1.92%, XLY 1.91%, XLF 1.15% and XLP 0.74%. Two funds outside the sector group finished well ahead of everything else. GDX rose 13.63% to 87.60 and KWEB gained 9.41% to 24.88.
Dark Pool Summary
MobyTick figures here exclude closing-cross volume. Dark pool notional across the flow set totaled $71.9B for the week. QQQ carried the largest share of any single ticker at $13.40B, and its weekly average print price was $662.67 against a $656.10 close. SPY printed $4.74B at an average of $740.05 against a $735.29 close. IWM printed $483.4M at an average of $281.06 against a $273.67 close. DIA had no qualifying flow.
Ten names carried $1B or more: QQQ at $13.40B, SPY at $4.74B, AAPL at $2.32B, GOOGL at $2.06B, META at $2.05B, NVDA at $1.79B, VOO at $1.37B, AVGO at $1.29B, MSFT at $1.27B and INTC at $1.27B.
What’s Next
Reference levels for the coming week are published in this newsletter’s callout section. They are based on MobyTick data from the week just ended.
QQQ fell 4.98% on the week. On Thursday alone it fell 6.49%.
Last Week’s Callout Performance
| Ticker | Upper Level | Lower Level | High | Low | Close | Observed Side | Reference Levels Reached |
|---|---|---|---|---|---|---|---|
| SPY | $765.00 | $750.00 | $775.64 | $732.71 | $735.29 | Upper & Lower | Upper 4 of 5 → R4 $775.00 · Lower 3 of 4 → R3 $735.00 |
| QQQ | $700.00 | $682.50 | $701.45 | $647.05 | $656.10 | Upper & Lower | Upper 0 of 5 · Lower 6 of 6 → R6 $661.48 |
| IWM | $285.25 | $276.50 | $286.17 | $270.23 | $273.67 | Upper & Lower | Upper 0 of 6 · Lower 2 of 5 → R2 $272.50 |
| CMCSA | $24.00 | $21.40 | $25.30 | $23.10 | $24.39 | Upper | Upper 2 of 6 → R2 $25.00 |
| NFLX | $65.00 | $60.00 | $67.49 | $61.71 | $63.41 | Upper | Upper 1 of 7 → R1 $66.50 |
| TSLA | $412.50 | $387.00 | $414.23 | $338.15 | $358.22 | Upper & Lower | Upper 0 of 5 · Lower 6 of 6 → R6 $360.00 |
| PLTR | $202.50 | $180.00 | $187.55 | $152.60 | $160.38 | Lower | Lower 5 of 5 → R5 $165.00 |
| MU | $985.00 | $855.00 | $892.08 | $650.00 | $690.00 | Lower | Lower 7 of 7 → R7 $700.00 |
| INTC | $70.00 | $64.00 | $65.72 | $51.51 | $56.28 | Lower | Lower 5 of 6 → R5 $52.50 |
| XOM | $188.50 | $177.50 | $184.59 | $163.51 | $165.87 | Lower | Lower 3 of 3 → R3 $170.00 |
| V | $417.00 | $400.00 | $442.23 | $412.75 | $422.65 | Upper | Upper 4 of 4 → R4 $430.00 |
| XLE | $70.25 | $67.00 | $69.14 | $61.20 | $61.62 | Lower | Lower 5 of 6 → R5 $62.00 |
| META | $645.00 | $610.00 | $643.09 | $583.80 | $610.15 | Lower | Lower 1 of 5 → R1 $600.00 |
Upper-side observations: 7 · Lower-side observations: 10 · No crossing recorded: 0
Tickers reaching ≥1 reference level: 13 · Total reference levels reached: 54
This Week’s Callouts — Upper Reference Levels
| Ticker | Upper Reference | Reference Levels |
|---|---|---|
| SPY | $750.00 | $752.50 → $755.00 → $760.00 → $765.00 → $769.00 |
| QQQ | $662.50 | $665.00 → $670.00 → $680.00 → $685.00 → $690.00 |
| IWM | $284.00 | $286.00 → $288.00 → $290.00 → $292.50 → $295.00 |
| NVDA | $210.00 | $214.00 → $217.50 → $220.00 → $225.00 → $228.00 → $230.00 |
| INTC | $66.50 | $70.00 → $75.00 → $80.00 → $85.00 → $89.50 |
| META | $645.00 | $660.00 → $680.00 → $700.00 |
| GOOGL | $295.00 | $300.00 → $305.00 → $310.00 → $315.00 → $320.00 |
| XOM | $170.00 | $172.50 → $175.00 → $177.50 → $180.00 |
| RKT | $15.50 | $16.00 → $17.00 → $18.00 → $19.00 → $20.00 |
| IONQ | $34.50 | $37.00 → $38.25 → $40.00 |
| GDX | $90.00 | $91.25 → $92.50 → $95.00 → $96.25 → $97.50 → $100.00 |
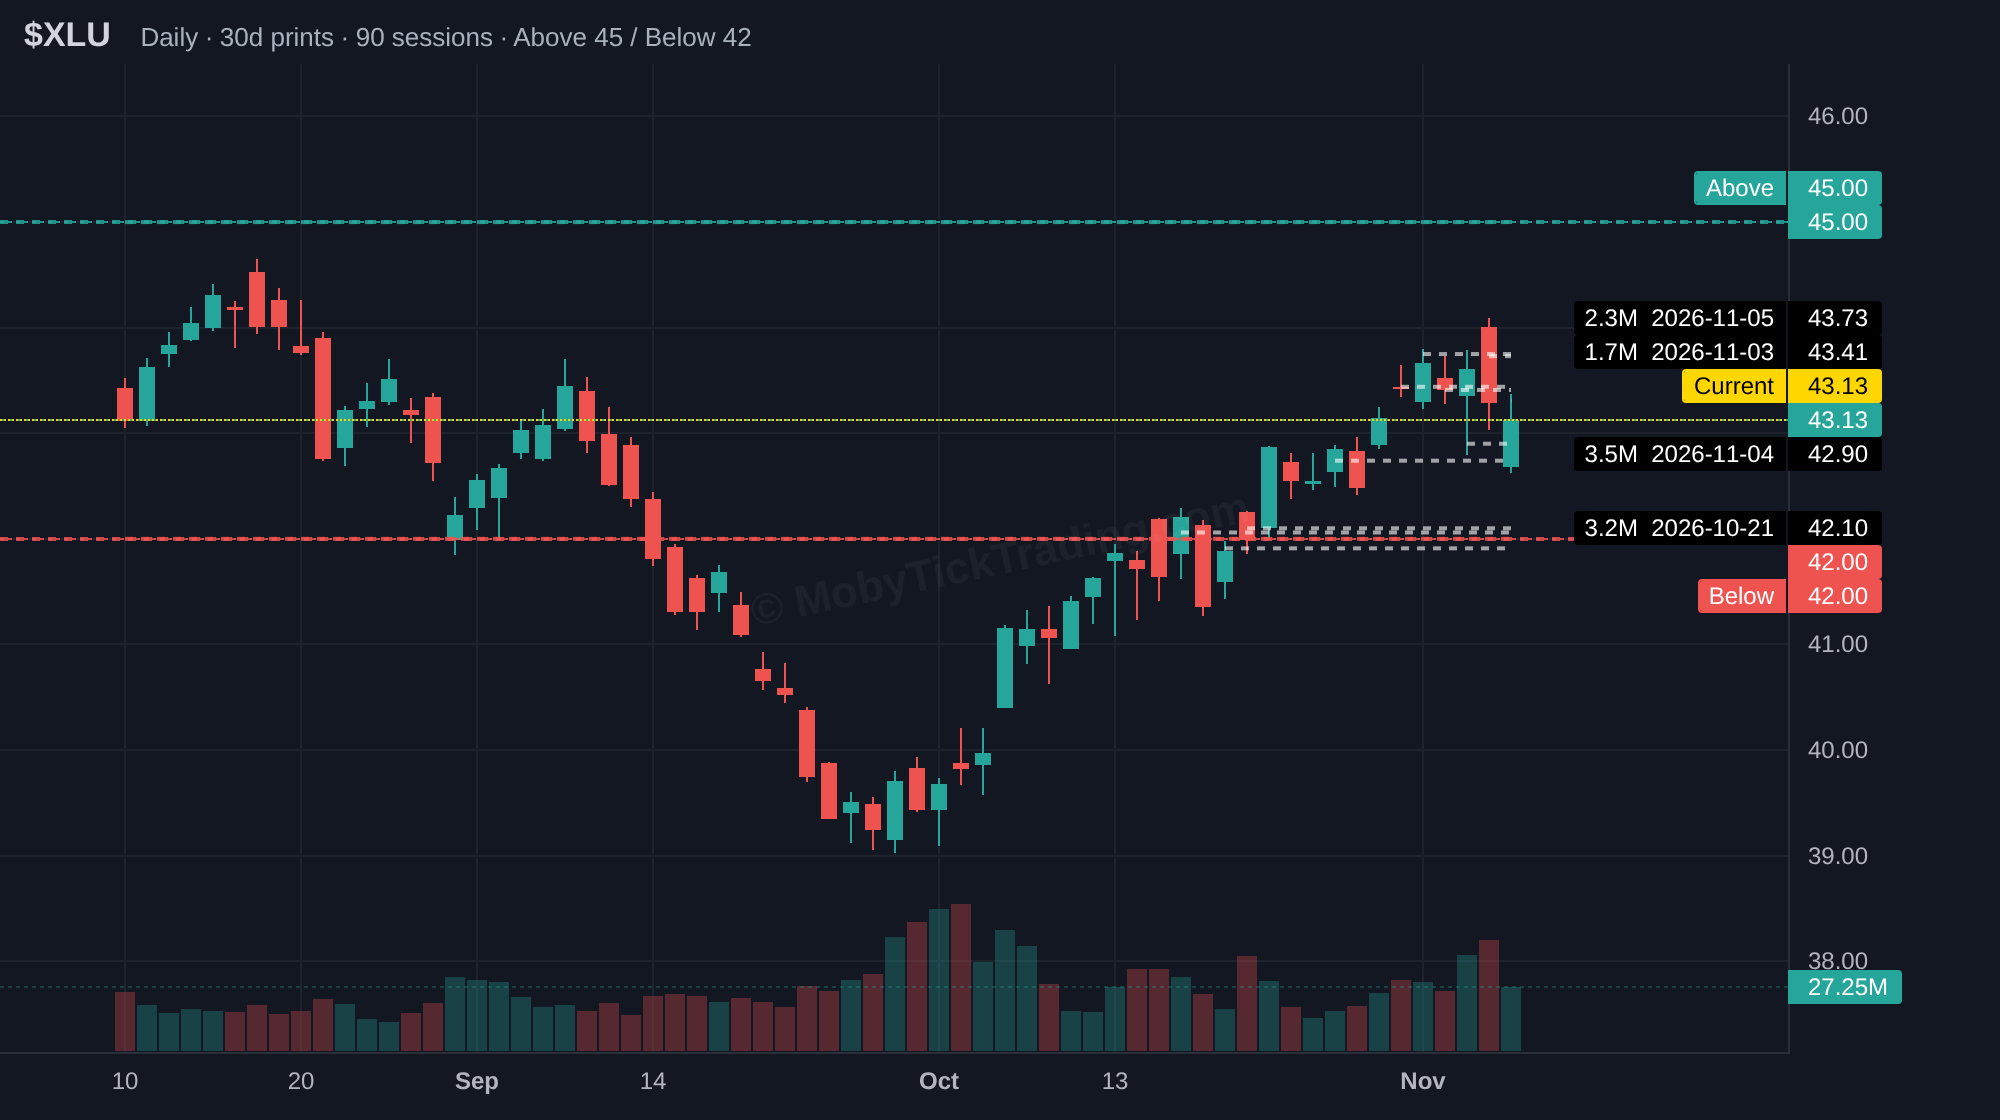
| XLU | $45 | $45.50 → $46 → $47 → $48 → $49 → $50 |
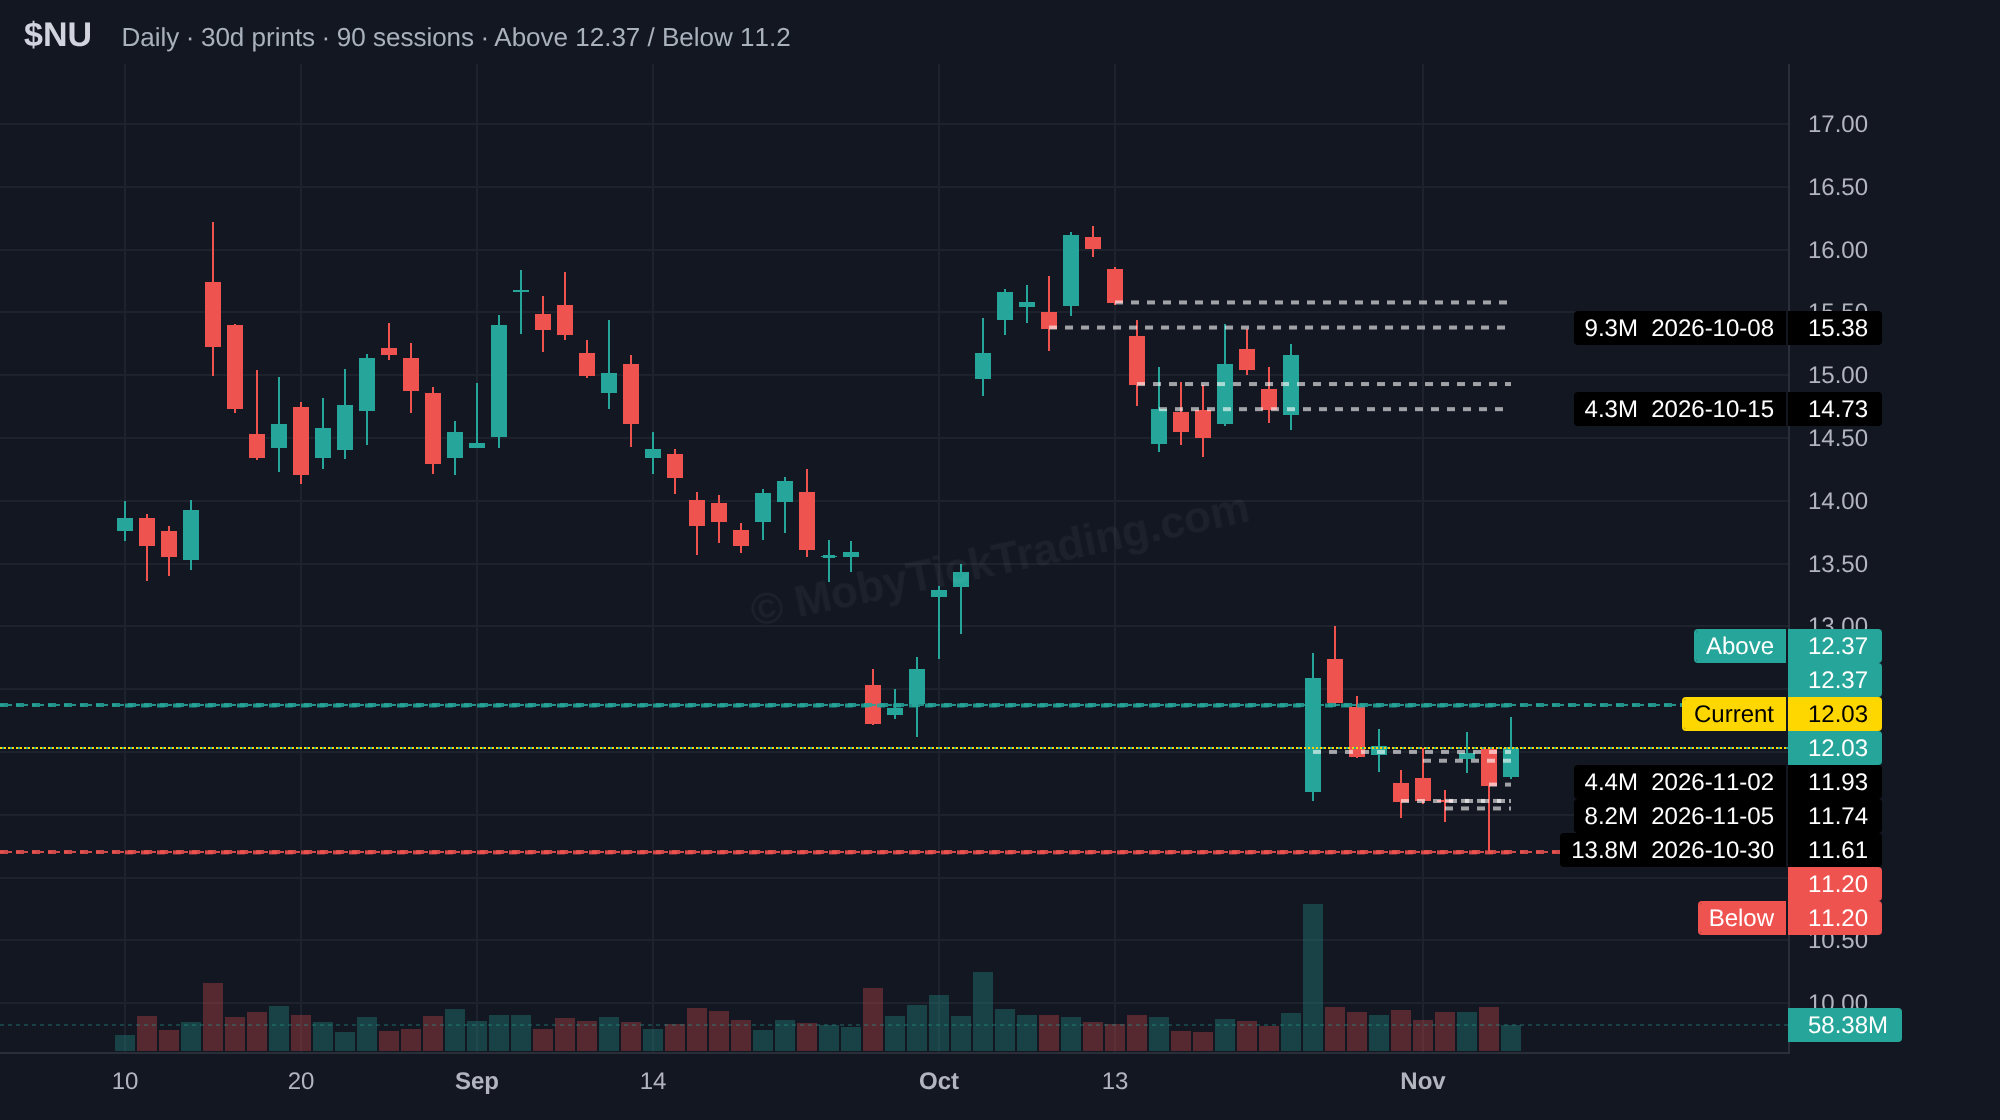
| NU | $12.37 | $13 → $13.5 → $14 → $14.50 → $14.73 |
This Week’s Callouts — Lower Reference Levels
| Ticker | Lower Reference | Reference Levels |
|---|---|---|
| SPY | $730.00 | $727.50 → $725.00 → $720.00 → $715.00 → $710.00 |
| QQQ | $647.00 | $640.00 → $630.00 → $620.00 |
| IWM | $270.00 | $265.00 → $262.50 → $260.00 → $255.00 → $252.50 |
| NVDA | $181.00 | $177.50 → $175.00 → $170.00 → $165.00 |
| INTC | $51.50 | $50.00 → $46.00 → $42.50 → $40.00 |
| META | $582.50 | $570.00 → $556.00 → $550.00 → $525.00 |
| GOOGL | $275.00 | $270.00 → $265.00 → $260.00 → $255.00 → $250.00 |
| XOM | $162.50 | $160.00 → $157.50 → $155.50 |
| RKT | $13.75 | $13.00 → $12.00 → $11.50 → $11.00 |
| IONQ | $24.87 | $24.00 → $23.00 → $22.00 → $20.00 |
| GDX | $82.50 | $81.00 → $80.00 → $77.50 → $75.00 → $72.50 |
| XLU | $42. | $41 → $40 → $39.5 |
| NU | $11.2 | $11 → $10 → $9.20 → $9 |
This Week’s Callouts — Ticker Detail
Each card below shows dark pool flow data for the past week, along with reference levels for the upcoming week. Dark pool statistics are sourced from MobyTick’s proprietary analytics.
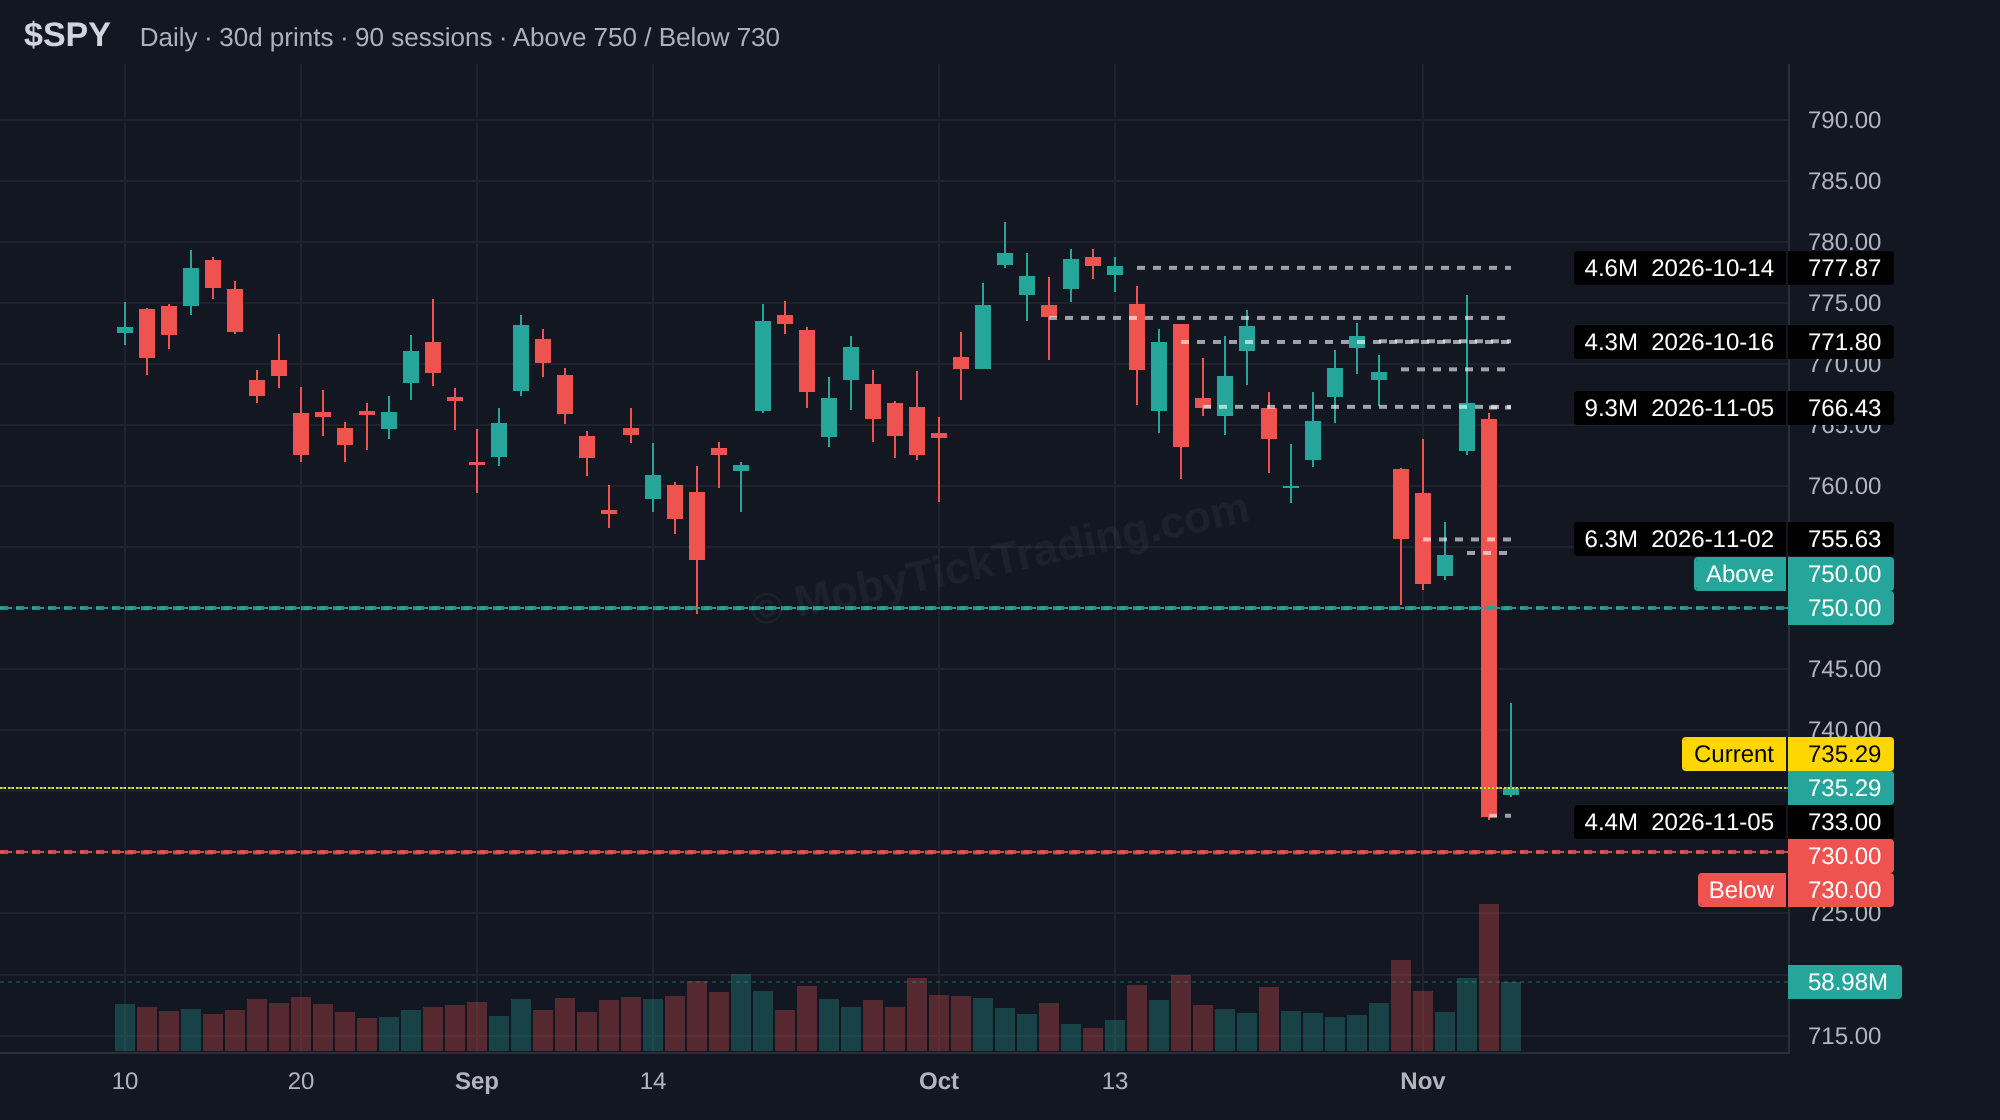
SPY
Upper reference $750.00 → $752.50 → $755.00 → $760.00 → $765.00 → $769.00
Lower reference $730.00 → $727.50 → $725.00 → $720.00 → $715.00 → $710.00
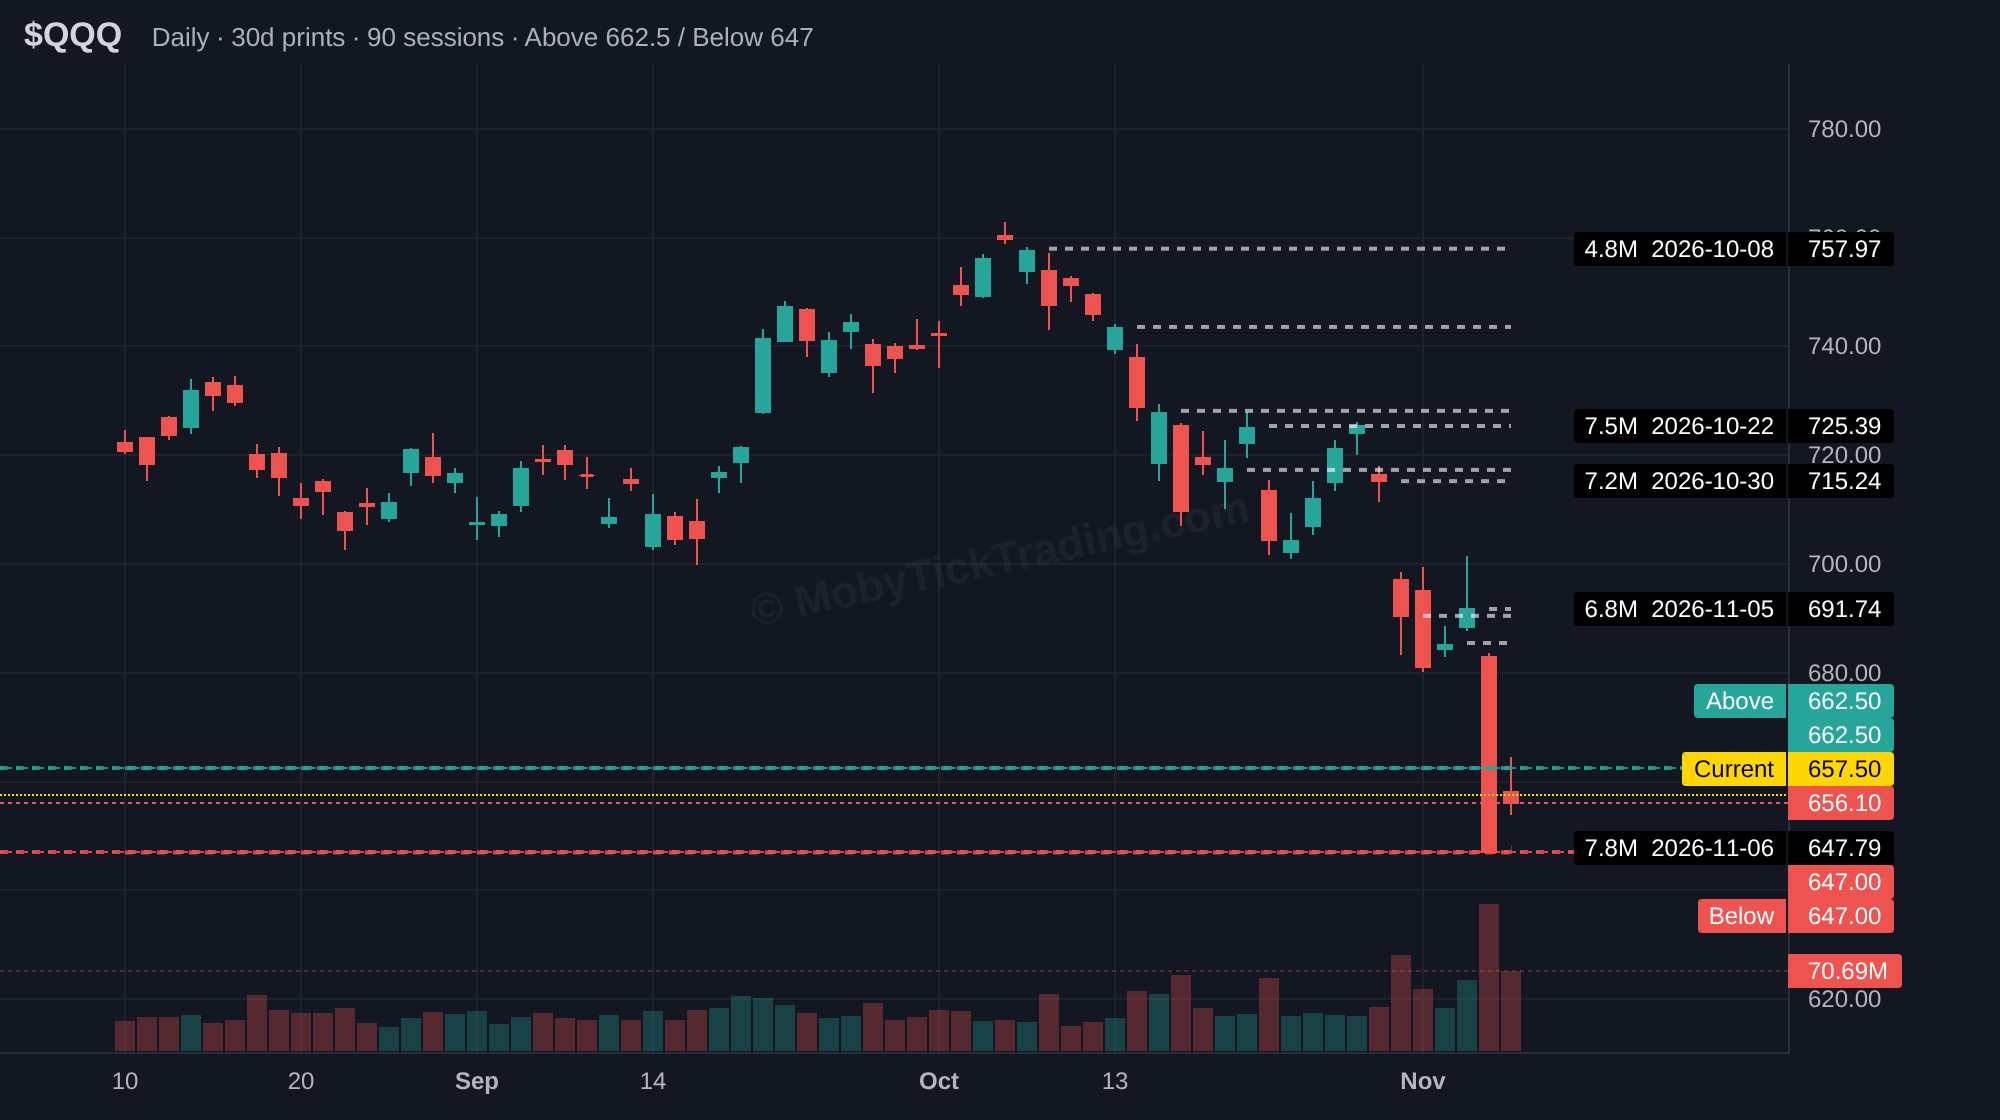
QQQ
Upper reference $662.50 → $665.00 → $670.00 → $680.00 → $685.00 → $690.00
Lower reference $647.00 → $640.00 → $630.00 → $620.00
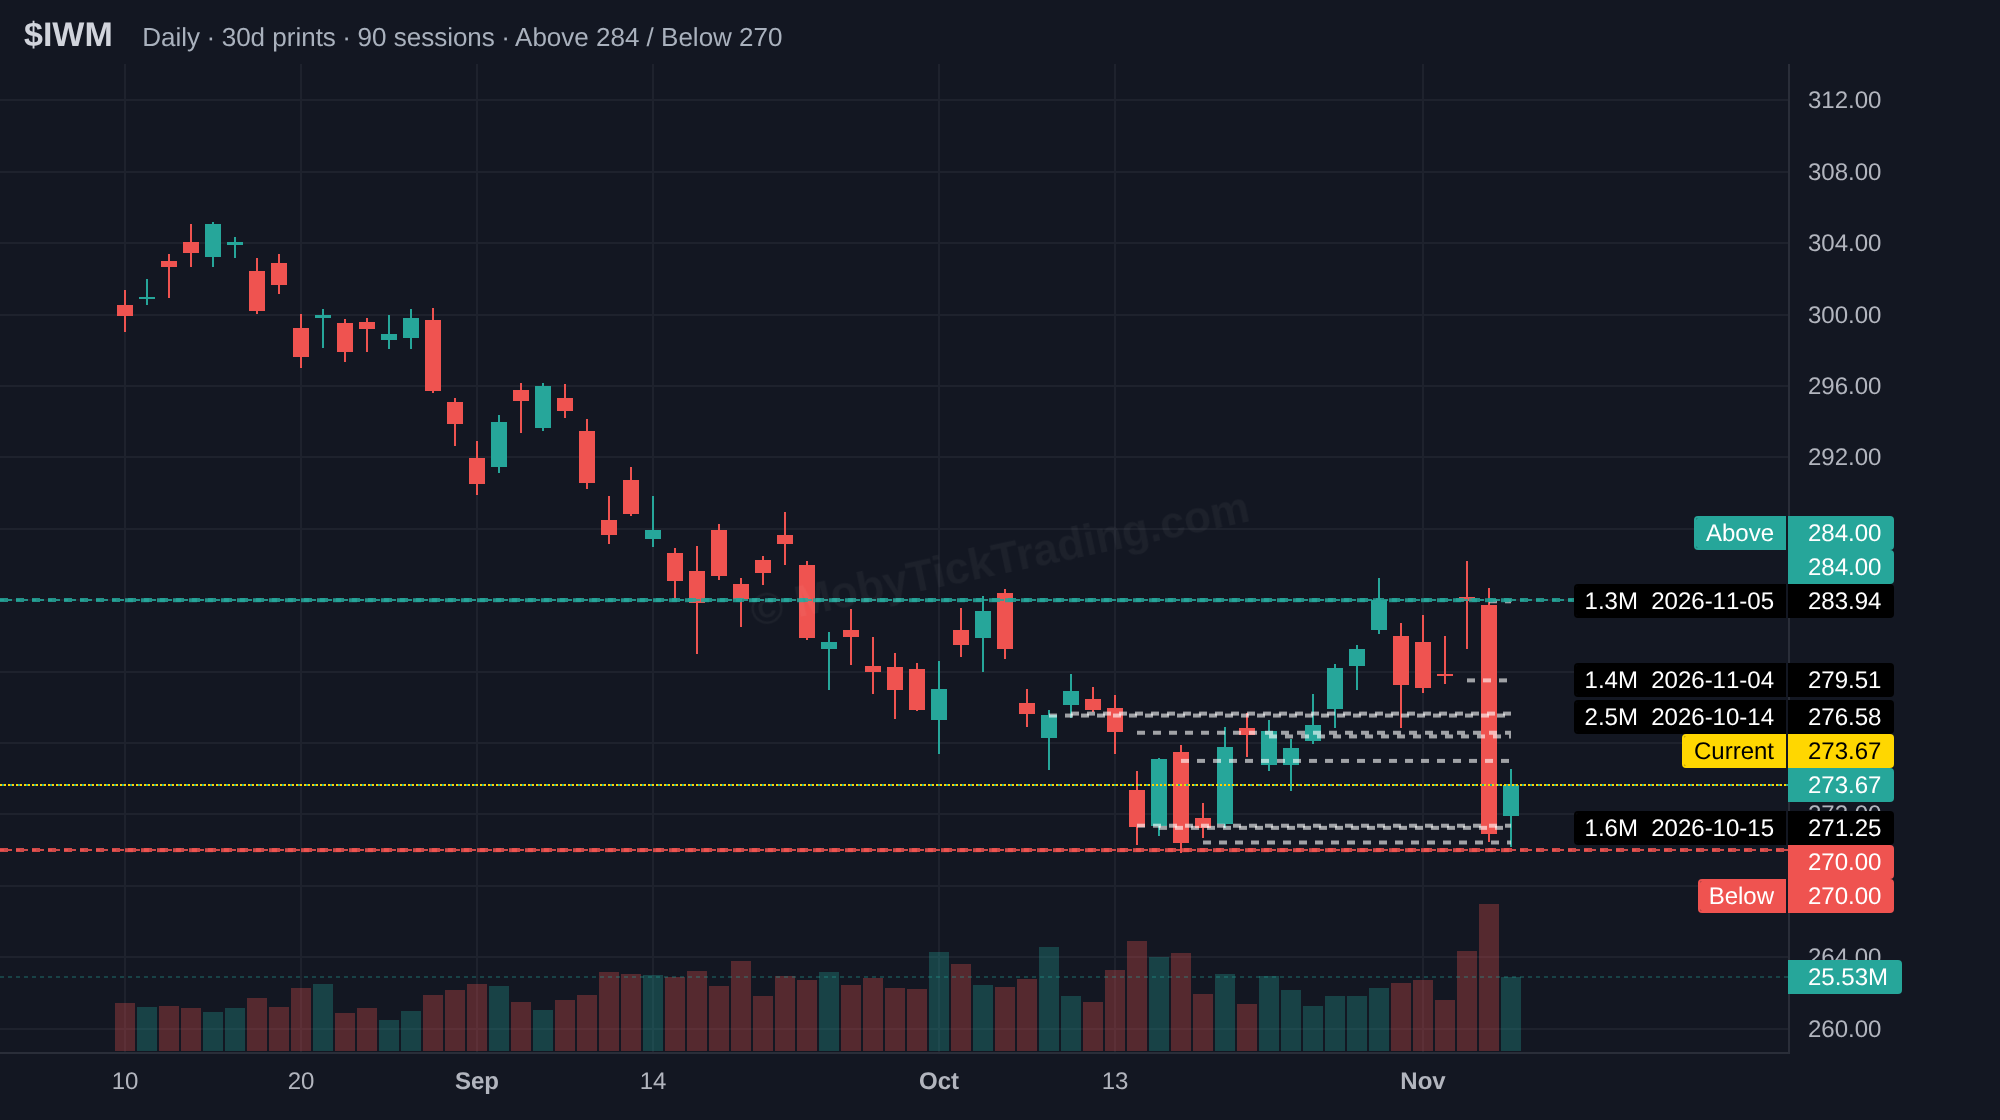
IWM
Upper reference $284.00 → $286.00 → $288.00 → $290.00 → $292.50 → $295.00
Lower reference $270.00 → $265.00 → $262.50 → $260.00 → $255.00 → $252.50
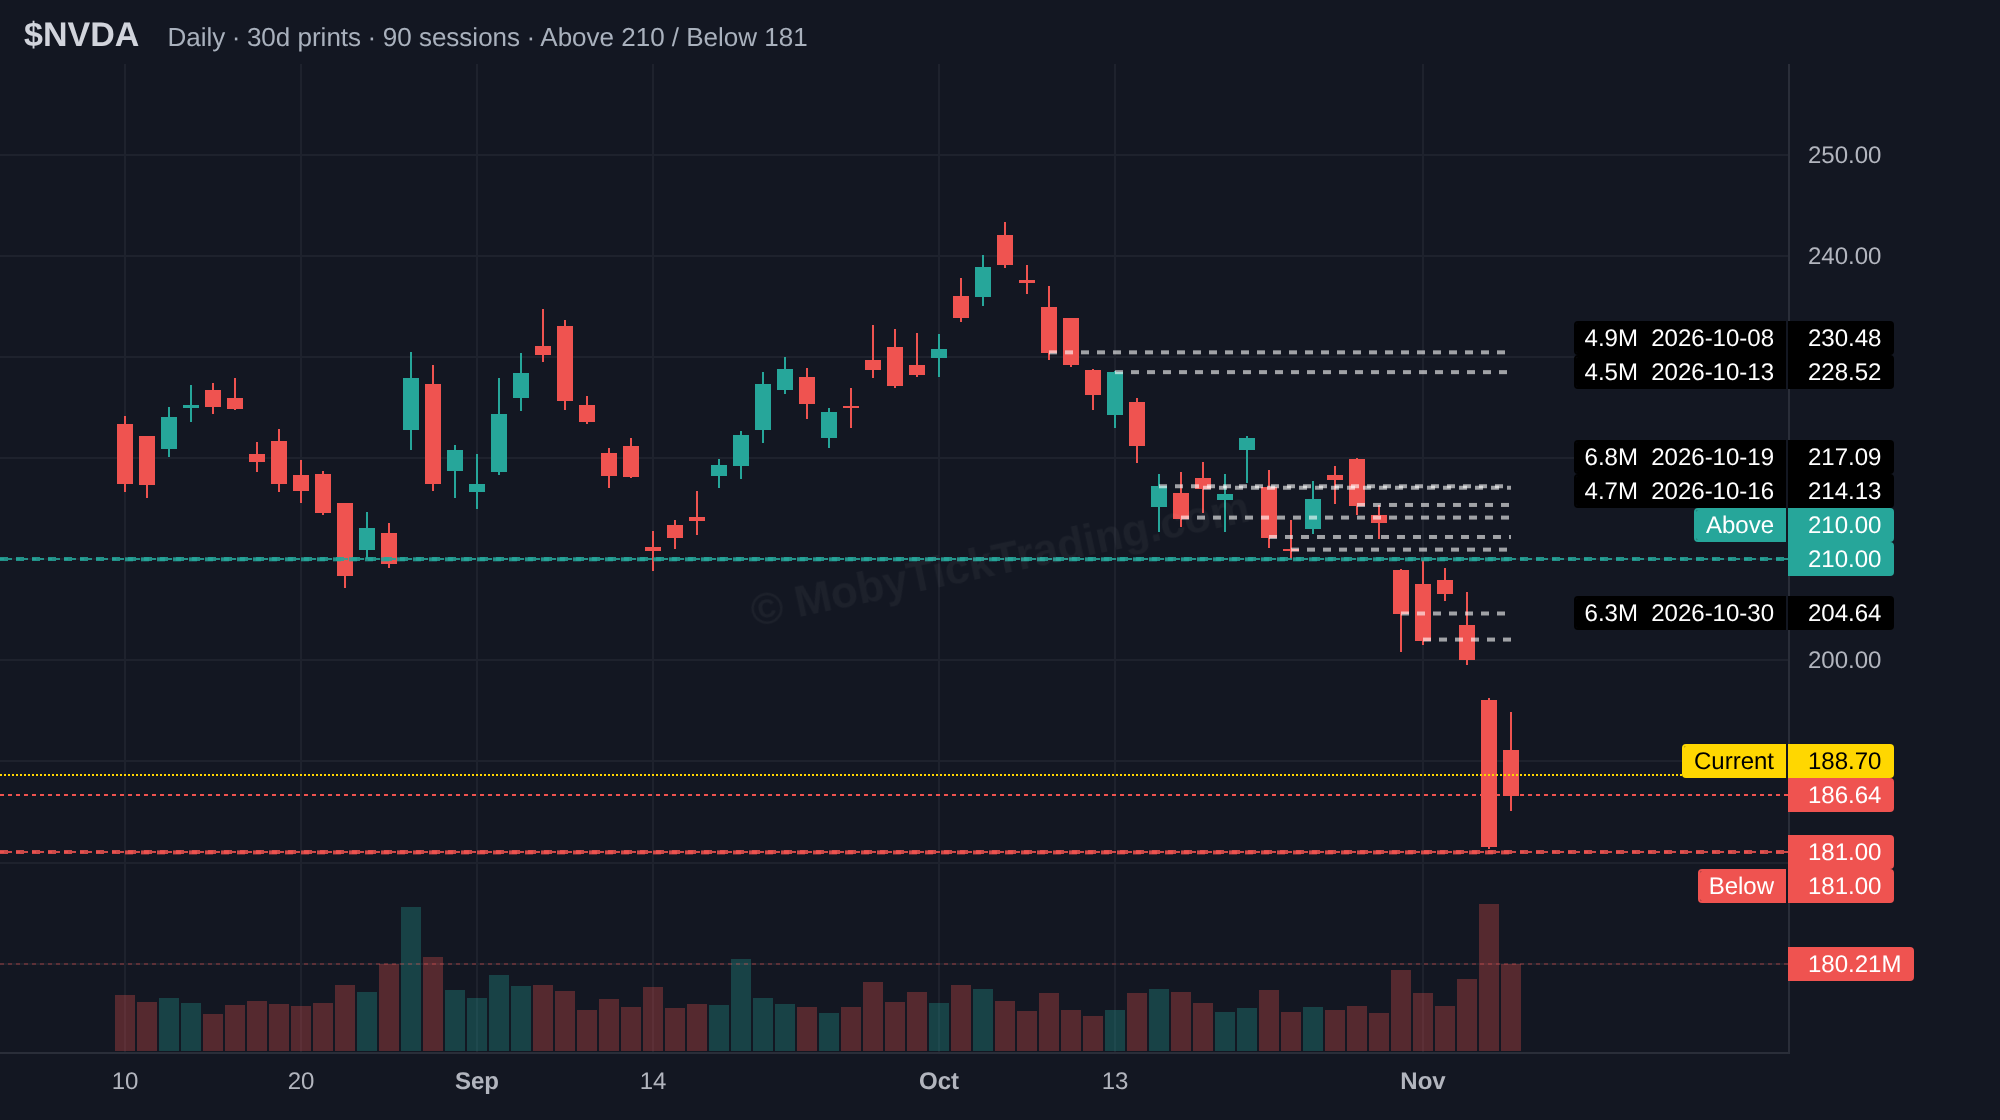
NVDA
Upper reference $210.00 → $214.00 → $217.50 → $220.00 → $225.00 → $228.00 → $230.00
Lower reference $181.00 → $177.50 → $175.00 → $170.00 → $165.00
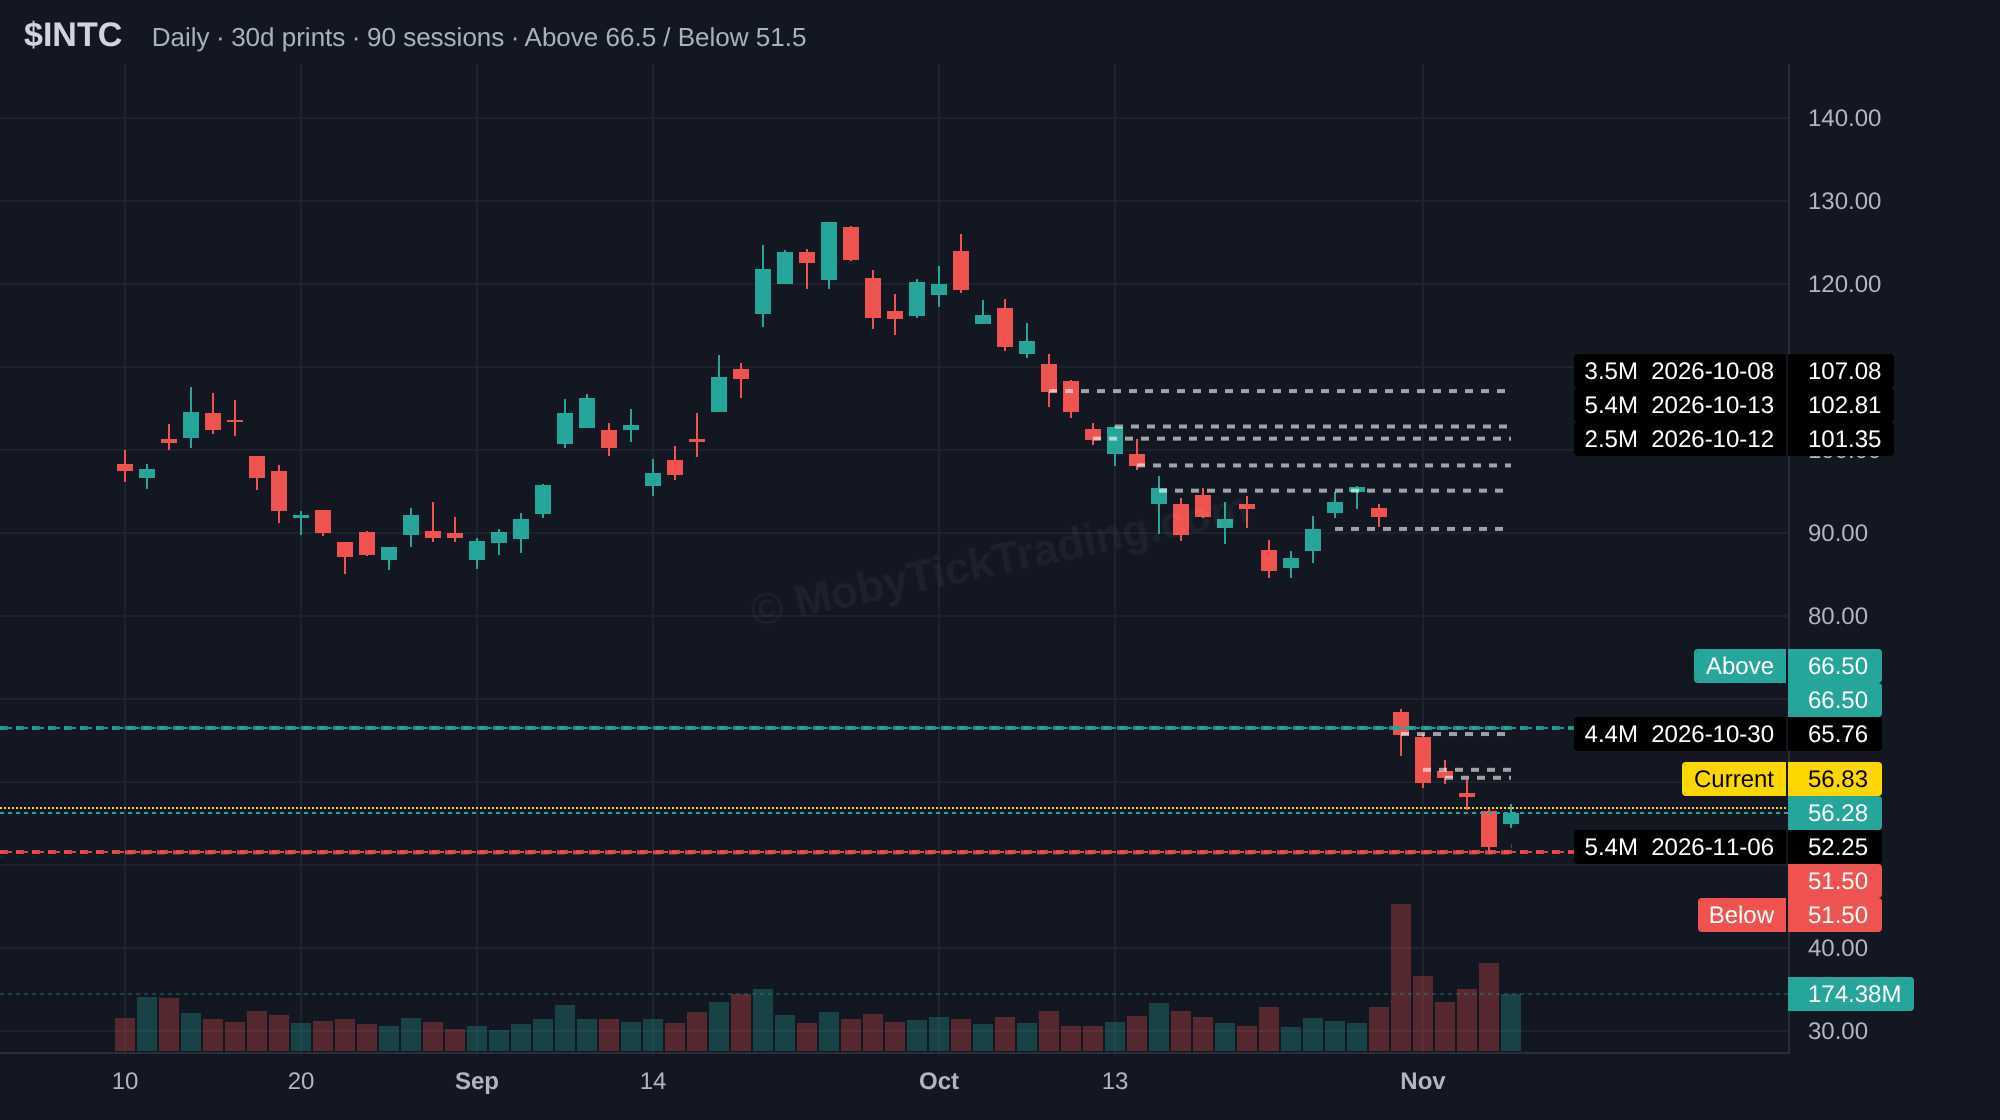
INTC
Upper reference $66.50 → $70.00 → $75.00 → $80.00 → $85.00 → $89.50
Lower reference $51.50 → $50.00 → $46.00 → $42.50 → $40.00
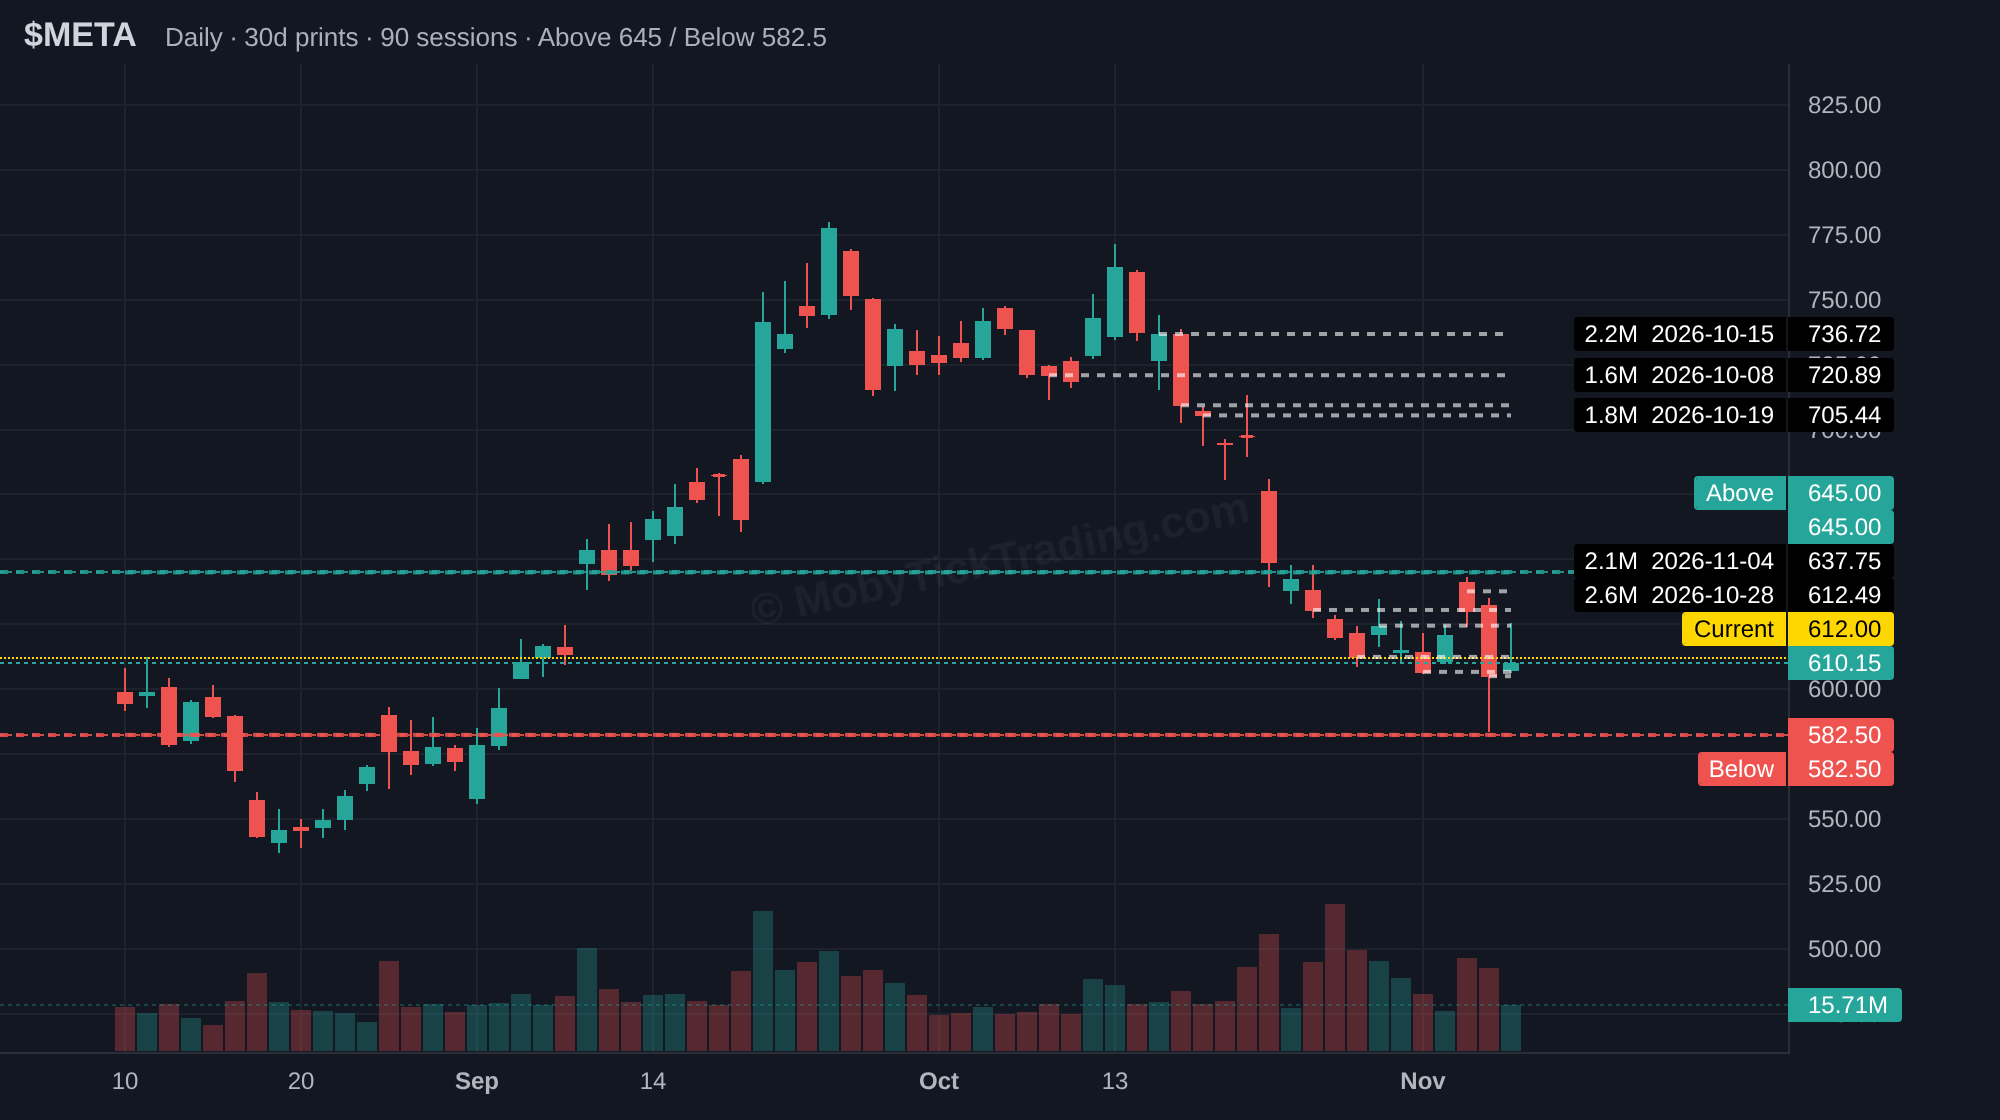
META
Upper reference $645.00 → $660.00 → $680.00 → $700.00
Lower reference $582.50 → $570.00 → $556.00 → $550.00 → $525.00
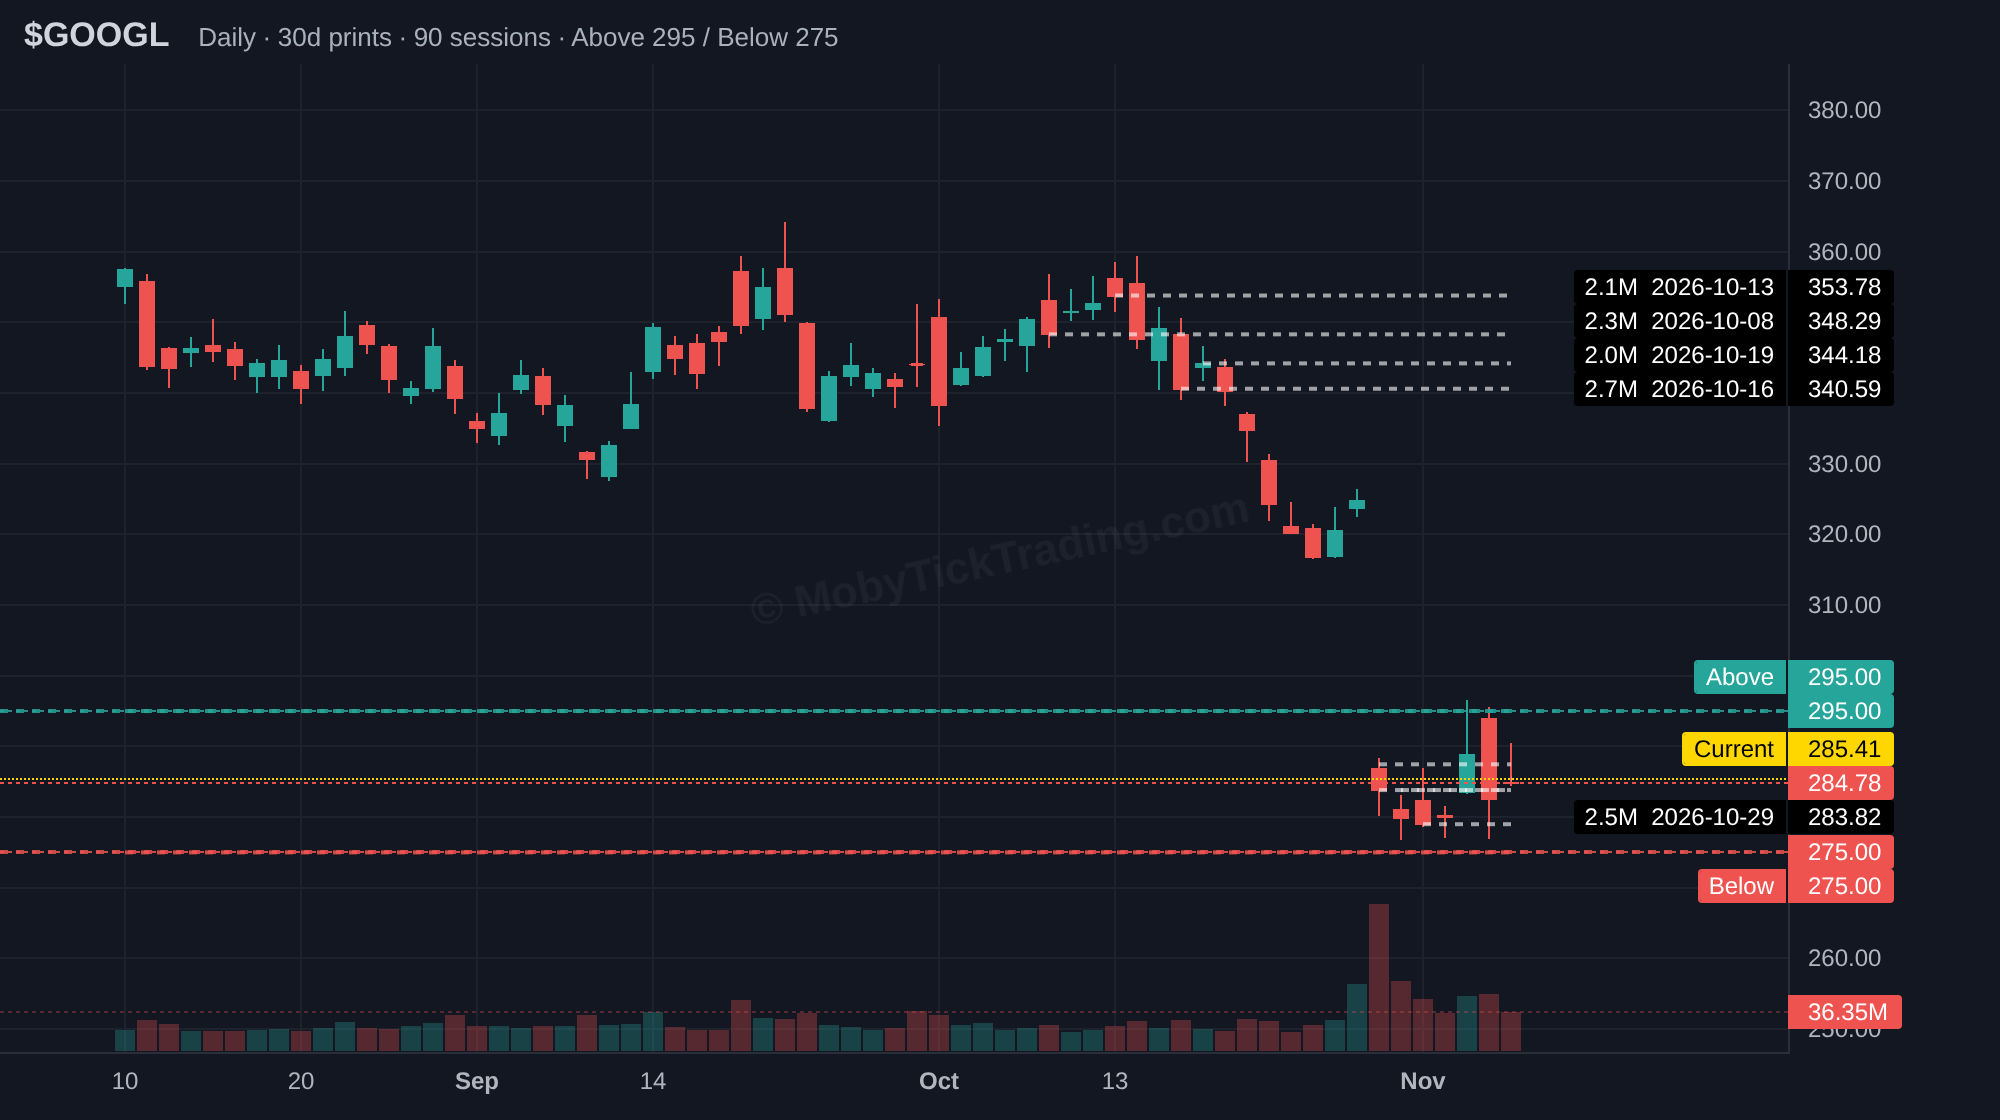
GOOGL
Upper reference $295.00 → $300.00 → $305.00 → $310.00 → $315.00 → $320.00
Lower reference $275.00 → $270.00 → $265.00 → $260.00 → $255.00 → $250.00
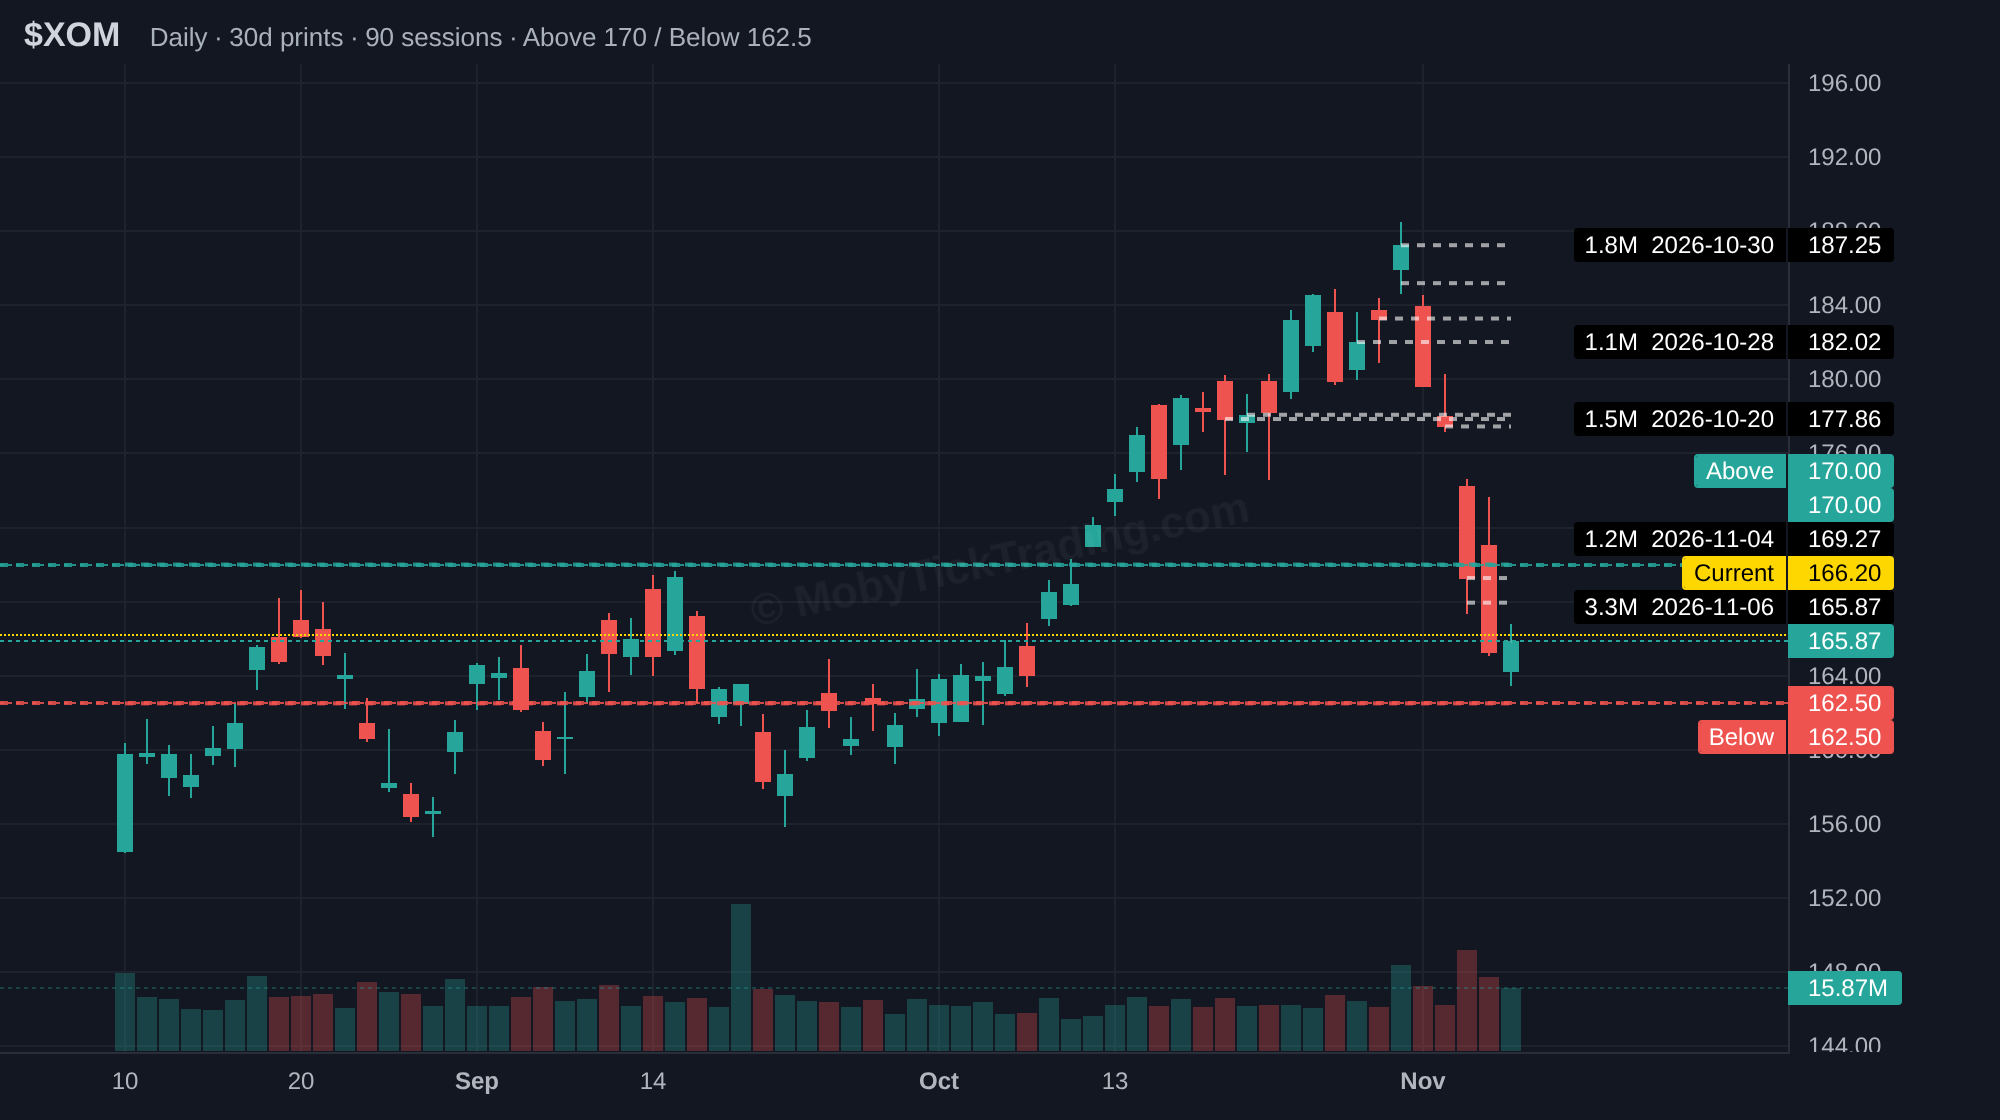
XOM
Upper reference $170.00 → $172.50 → $175.00 → $177.50 → $180.00
Lower reference $162.50 → $160.00 → $157.50 → $155.50
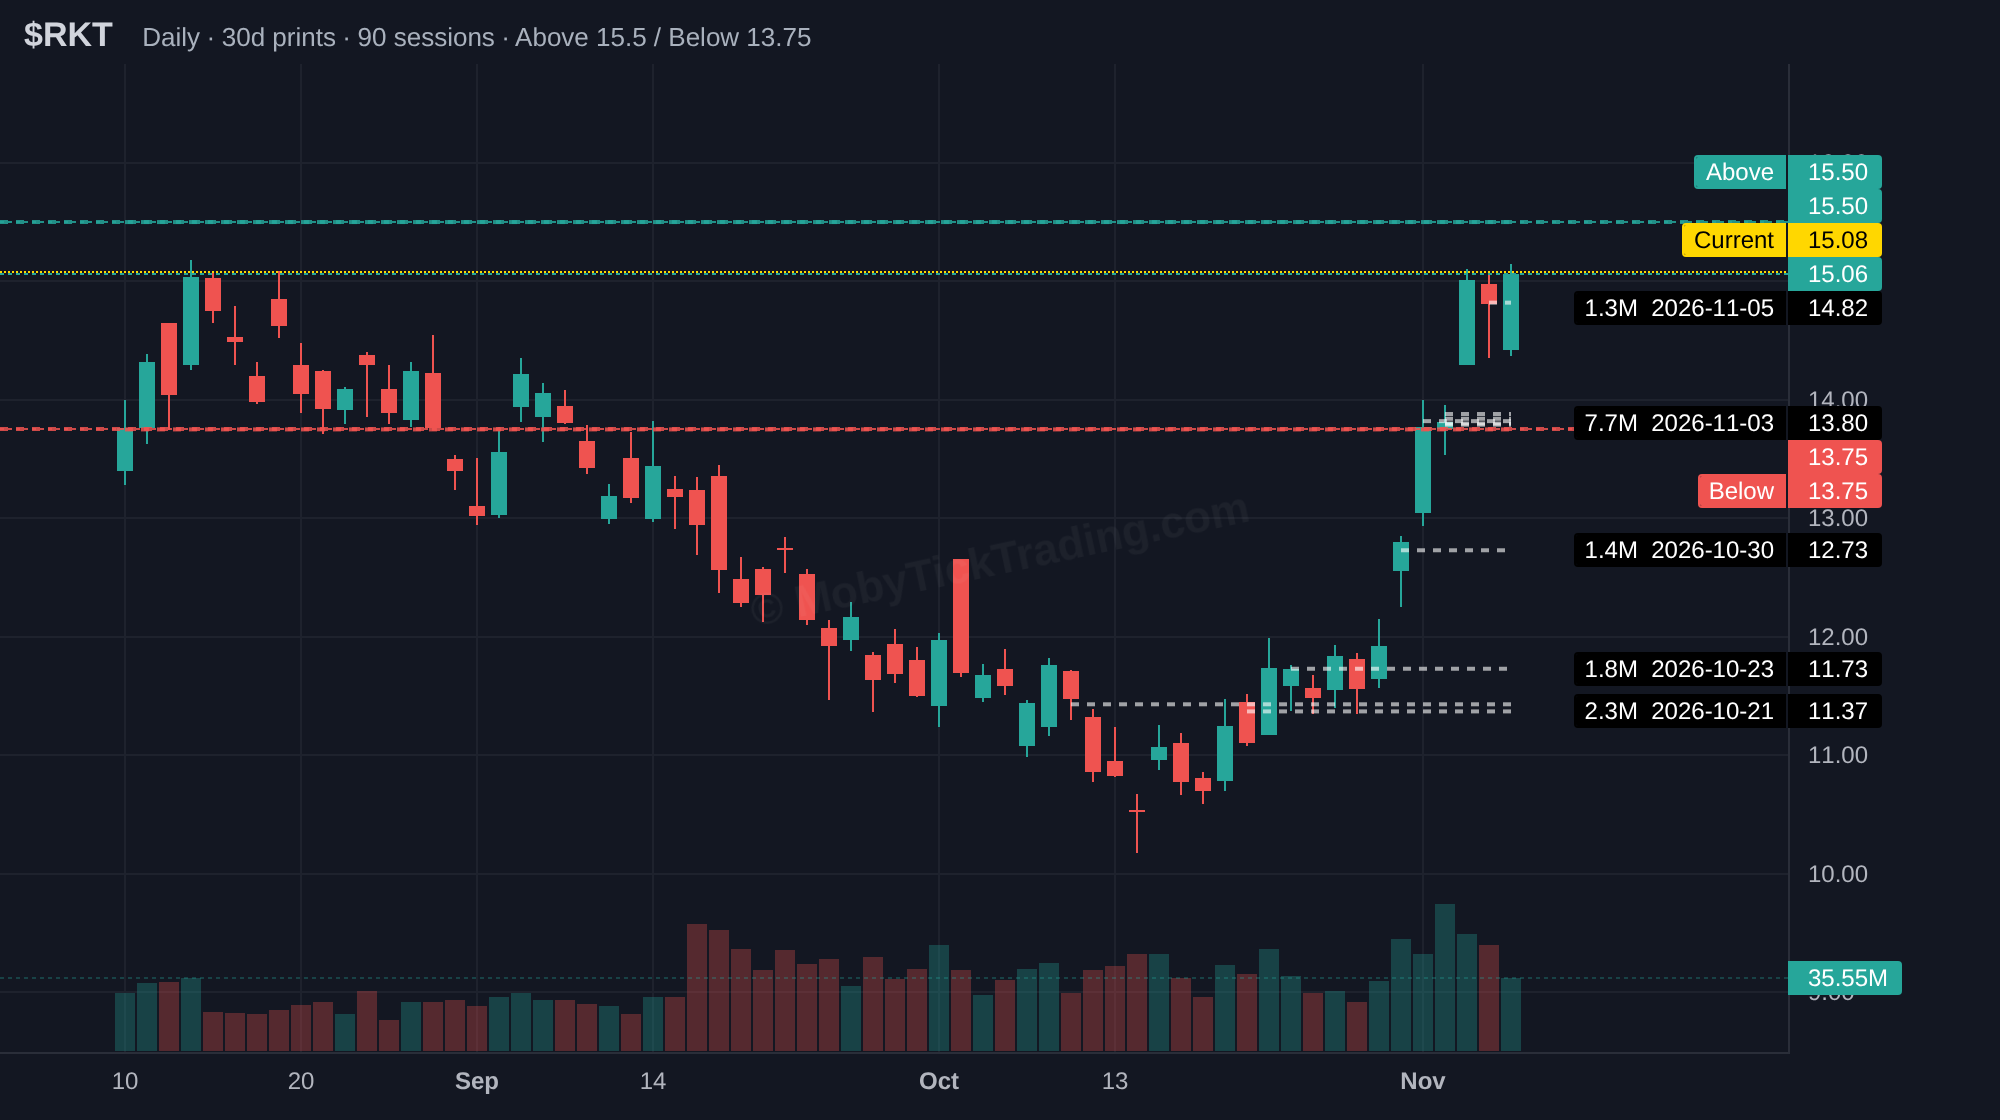
RKT
Upper reference $15.50 → $16.00 → $17.00 → $18.00 → $19.00 → $20.00
Lower reference $13.75 → $13.00 → $12.00 → $11.50 → $11.00
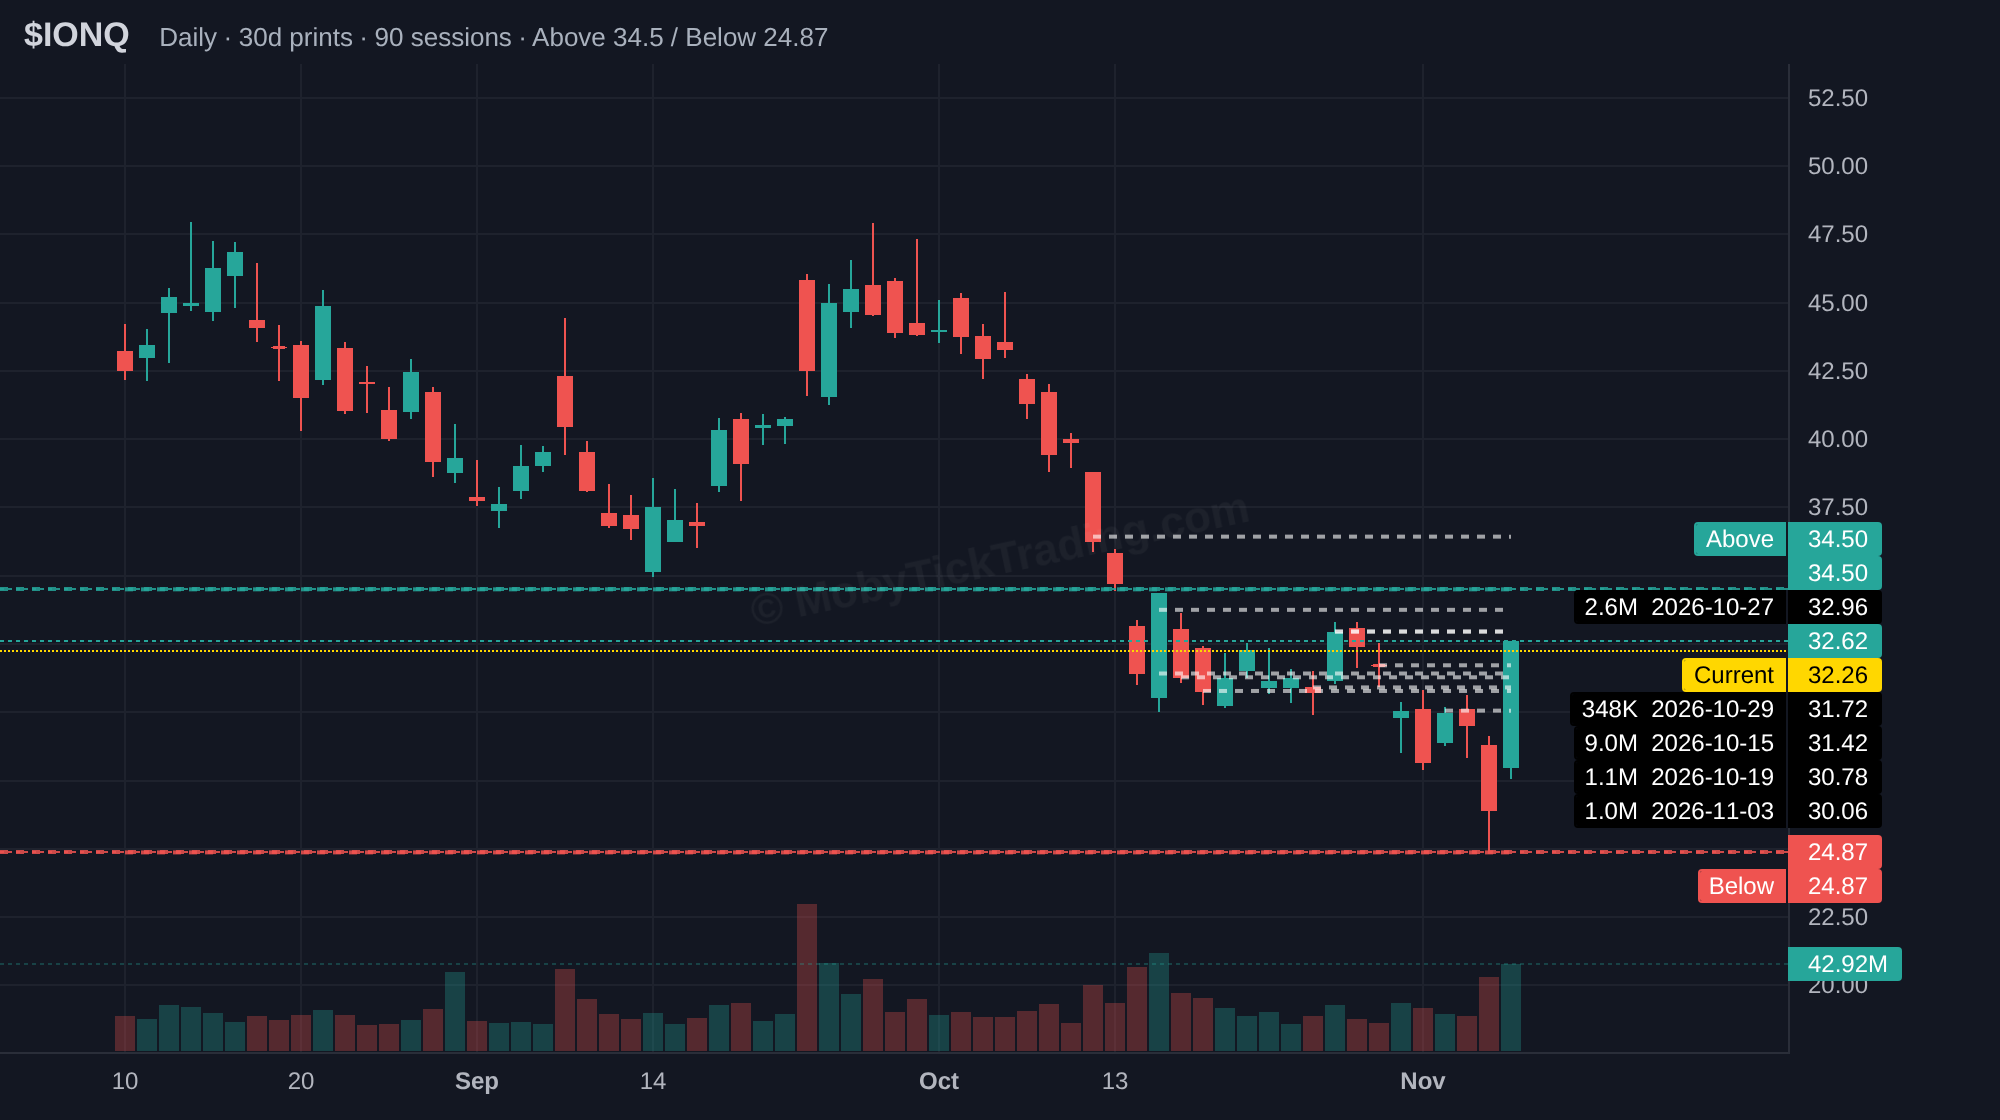
IONQ
Upper reference $34.50 → $37.00 → $38.25 → $40.00
Lower reference $24.87 → $24.00 → $23.00 → $22.00 → $20.00
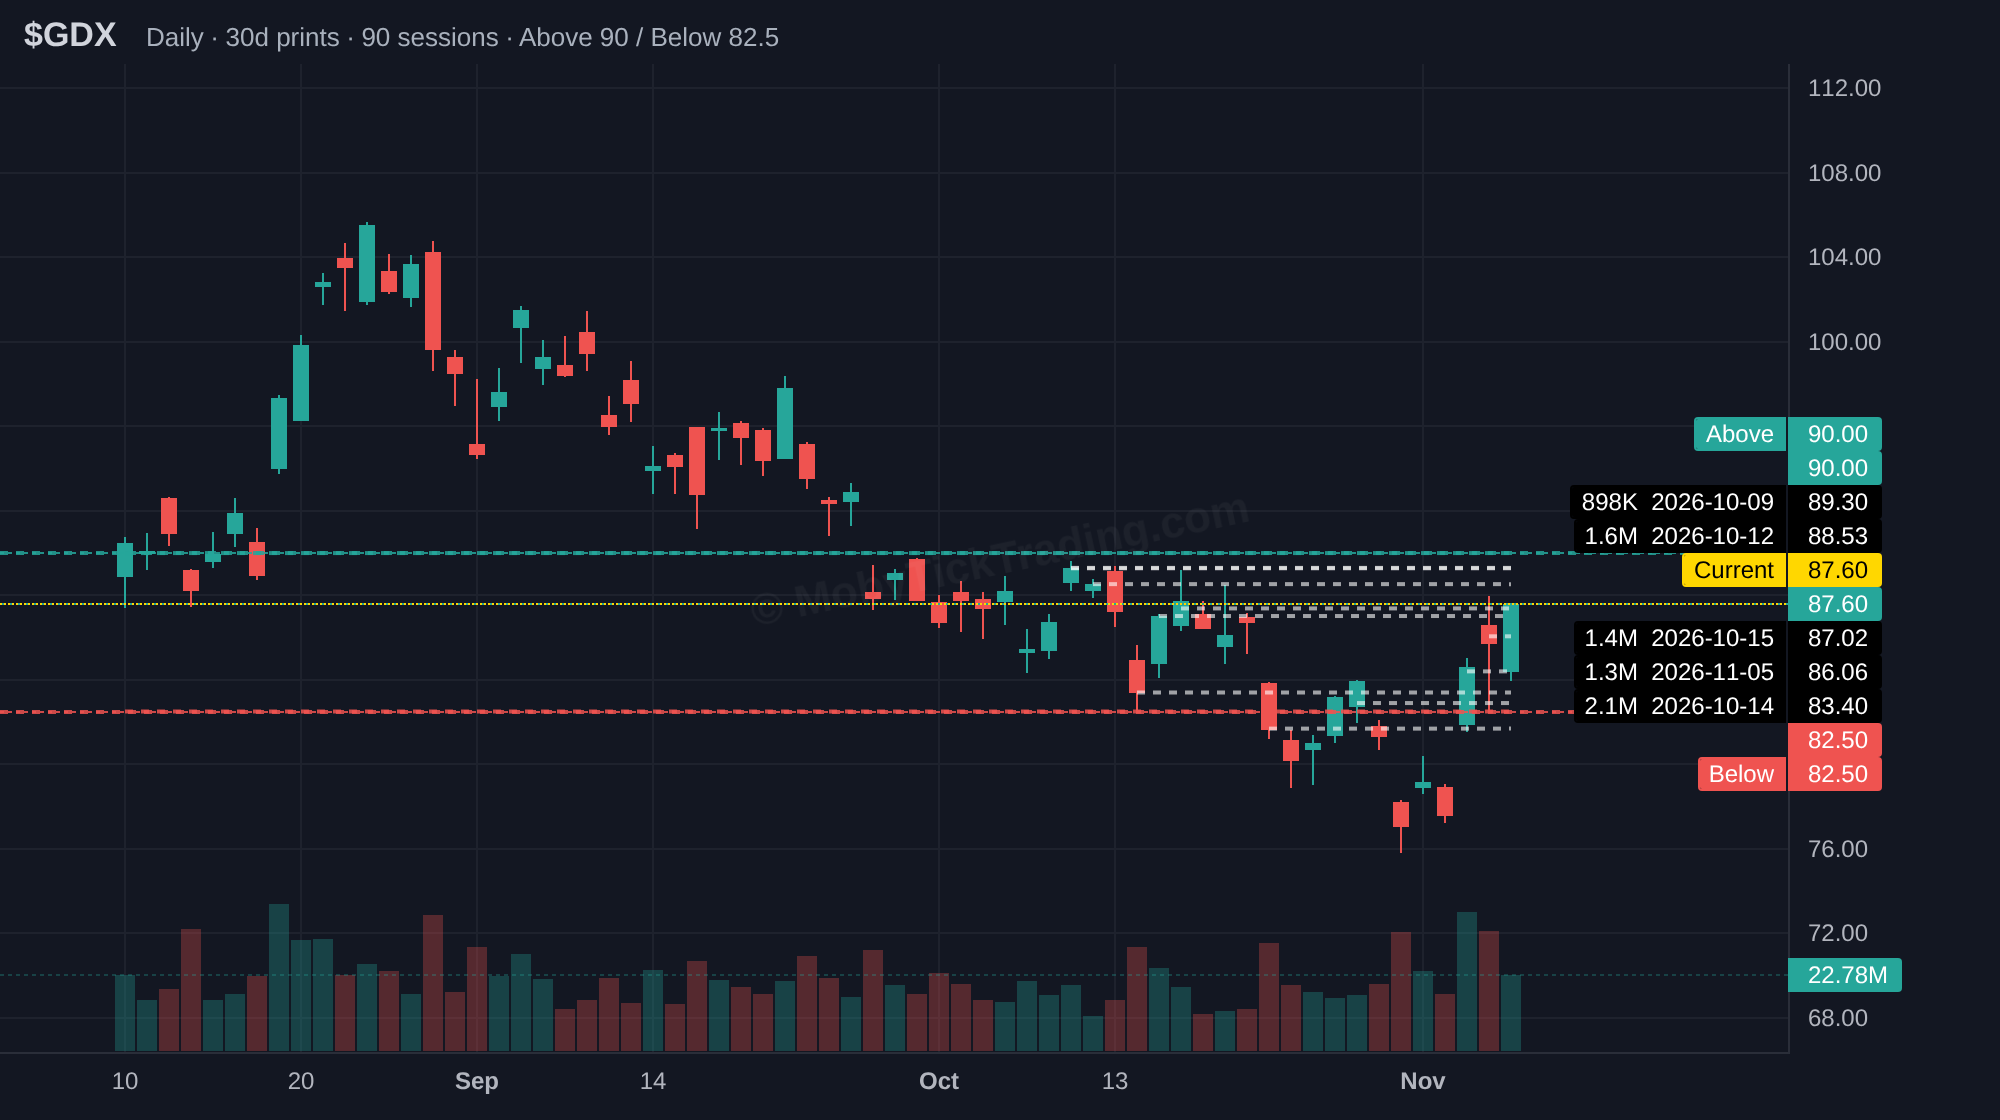
GDX
Upper reference $90.00 → $91.25 → $92.50 → $95.00 → $96.25 → $97.50 → $100.00
Lower reference $82.50 → $81.00 → $80.00 → $77.50 → $75.00 → $72.50
XLU
Upper reference $45 → $45.50 → $46 → $47 → $48 → $49 → $50
Lower reference $42. → $41 → $40 → $39.5
NU
Upper reference $12.37 → $13 → $13.5 → $14 → $14.50 → $14.73
Lower reference $11.2 → $11 → $10 → $9.20 → $9
ETF Dark Pool Flow
The four index ETFs printed outsized late-print clusters at the November 4 close, reported in the following session. Those four clusters totalled $13.24B, with DIA contributing $992.8M on 1,863,051 shares, or 16.27% of that session’s volume.
Index ETFs
| ETF | Late print at the Nov 4 close | Single-print blocks (≥400K sh) | Close | Week % |
|---|---|---|---|---|
| SPY | 9,339,556 sh @ 766.43 = $7.16B | $4.74B | 735.29 | -2.70% |
| QQQ | 6,831,035 sh @ 691.74 = $4.73B | $13.4B | 656.10 | -4.98% |
| DIA | 1,863,051 sh @ 532.88 = $992.8M | — | 512.22 | -0.95% |
| IWM | 1,266,006 sh @ 283.94 = $359.5M | $483.4M | 273.67 | -2.03% |
DIA does not produce many prints, but its November 4 close attracted the third-largest late print of the four, ahead of IWM. QQQ’s single-print blocks were the largest of any ticker in the flow set at $13.40B, and its weekly average print price of 662.67 sat $6.57 above the Friday close of 656.10. SPY’s average print price of 740.05 was $4.76 above its 735.29 close, and IWM’s 281.06 was $7.39 above its 273.67 close.
Sector and Thematic ETFs
| ETF | Group | Single-print blocks | Prints | Close | Week % |
|---|---|---|---|---|---|
| SMH | Semiconductors | $546.8M | 2 | 463.96 | -11.20% |
| XLU | Utilities | $441.5M | 7 | 43.13 | -0.69% |
| XLF | Financials | $418.2M | 8 | 57.16 | +1.15% |
| XLV | Health Care | $402.4M | 3 | 184.80 | -0.04% |
| KRE | Regional Banks | $299.3M | 2 | 72.20 | +0.26% |
| XLY | Consumer Discretionary | $286.3M | 1 | 117.58 | +1.91% |
| KWEB | China Internet | $272.0M | 4 | 24.88 | +9.41% |
| XLB | Materials | $258.9M | 6 | 51.95 | -1.50% |
| GDX | Gold Miners | $257.3M | 4 | 87.60 | +13.63% |
| XLP | Consumer Staples | $242.1M | 5 | 90.08 | +0.74% |
| XLE | Energy | $240.6M | 6 | 61.62 | -12.00% |
| XLK | Technology | $99.6M | 1 | 164.74 | -8.23% |
XLF printed on all five sessions, the most sustained sector tape of the week, and XLU printed on four. SMH’s $546.8M was the largest sector total, carried on two prints. XLE’s $240.6M accompanied the widest sector decline of the week at -12.00%, while GDX’s $257.3M came with the widest gain at +13.63%.
Two layers of tape
These are two different measurements of the same market, and they are not additive.
The late-print layer aggregates many slices of a single position into one reported event. A 7.76 million share QQQ late print, for example, was assembled from individual trades of roughly 103,000 shares each. No single slice of that size clears a 400,000-share floor, so a scan built on large single prints does not see it at all. That is why DIA shows a $992.8M late print and no qualifying single-print blocks in the same week.
The single-print layer counts blocks of 400,000 shares or more that executed inside the regular session. It captures large individual transactions and excludes both the sliced late-print events and any print that executed at a session’s closing price. Across the full flow set, prints at closing prices accounted for $61.8B of the raw feed and are excluded from every single-print figure above.
All figures are sourced from MobyTick.
$22 Billion in QQQ Late Prints: Reading the Institutional Tape Through the November Selloff
QQQ closed at $725.61 on October 28. Six sessions later, on November 5, it closed at $647.05, a drop of 10.8%, finishing that day right on its low. Most traders watched it happen on a price chart.
The Late Prints table told a different story, and it was telling it before the worst of the selling. In the closes leading into the biggest down days, institutions moved outsized blocks of QQQ, and those blocks hit the tape as late prints.
This piece walks through exactly what the data showed, how to read it correctly, and the traps that catch most traders when they look at late prints for the first time.
If you’re new to late prints, start with our [complete guide to late prints in dark pool data](https://mobyticktrading.com/blogs/2026/05/19/late-prints-dark-pool-data). The short version: late prints are real dark pool trades on SPY, QQQ, IWM and DIA that are reported after the fact. The trade is real. The timing of the report is delayed.
The Data: Late Prints, October 21 – November 6
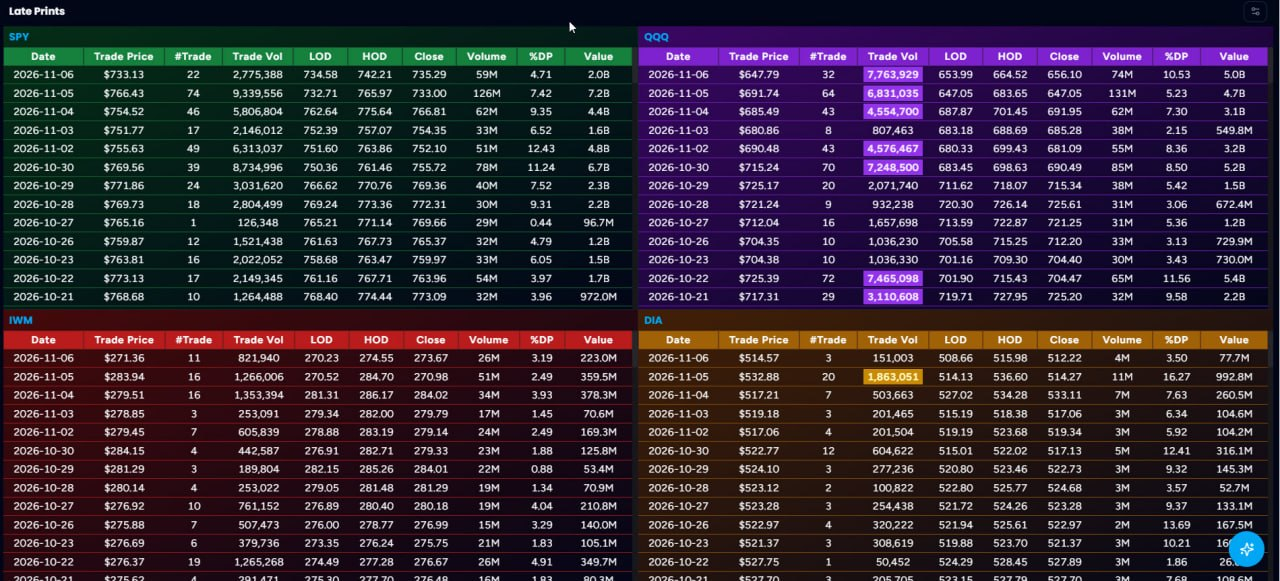
Here’s how to read each row:
- Date – the day the late print was reported, not necessarily the day it executed.
- Trade Price – the price the aggregated late-print event traded at.
- #Trade / Trade Vol – how many individual prints made up the event and the total shares.
- LOD / HOD / Close / Volume – the low, high, close and total volume for the report date.
- %DP – the late-print volume as a share of that day’s total volume.
- Value – the dollar value of the event.
- Highlighted cells – unusually large late-print volume for that ETF.
Look at the QQQ panel. Seven highlighted days in thirteen sessions, and they cluster around the selloff.
Lesson 1: Compare the Price to the Previous Close, Not Today’s Range
This is the single most common mistake with late prints.
On November 5, QQQ fell 6.5%. Its high that day was $683.65. Yet the late-print table shows 6.83 million shares at $691.74, more than $8 above anything QQQ traded all day.
Did someone pay up $8 above the market in the middle of a crash? No. Look at the prior close: $691.95 on November 4. That block executed at the November 4 close and was reported on November 5.
Here is the whole QQQ window:
| Report Date | Late Print Price | Previous Close | Difference | Inside That Day’s Range? |
|---|---|---|---|---|
| Nov 6 | $647.79 | $647.05 | +$0.74 | No – below the low |
| Nov 5 | $691.74 | $691.95 | –$0.21 | No – above the high |
| Nov 4 | $685.49 | $685.28 | +$0.21 | No – below the low |
| Nov 3 | $680.86 | $681.09 | –$0.23 | No – below the low |
| Nov 2 | $690.48 | $690.49 | –$0.01 | Yes |
| Oct 30 | $715.24 | $715.34 | –$0.10 | No – above the high |
| Oct 29 | $725.17 | $725.61 | –$0.44 | No – above the high |
| Oct 28 | $721.24 | $721.25 | –$0.01 | Yes |
| Oct 27 | $712.04 | $712.20 | –$0.16 | No – below the low |
| Oct 26 | $704.35 | $704.40 | –$0.05 | No – below the low |
| Oct 23 | $704.38 | $704.47 | –$0.09 | Yes |
| Oct 22 | $725.39 | $725.20 | +$0.19 | No – above the high |
Every QQQ late print in this window landed within $0.75 of the previous session’s close. Nine of the twelve sat completely outside the range of the day they were reported.
If you read those prints against the current day’s chart, you would conclude institutions were paying wild prices far from the market. Read against the prior close, they make perfect sense: large blocks transacting at or near the closing price, reported the next day.
This is a rule of thumb, not a law. The price is usually around the previous close, but not always. When a late print lands meaningfully away from the prior close, that’s a reason to dig deeper, not to ignore it.
Lesson 2: Signature Share Sizes – The Fingerprint Inside the Late Print
The Late Prints table rolls many individual trades into a single event. On November 6, the QQQ event was 32 trades totaling 7.76 million shares at $647.79. Drill into the individual prints and you can see how that event was built.
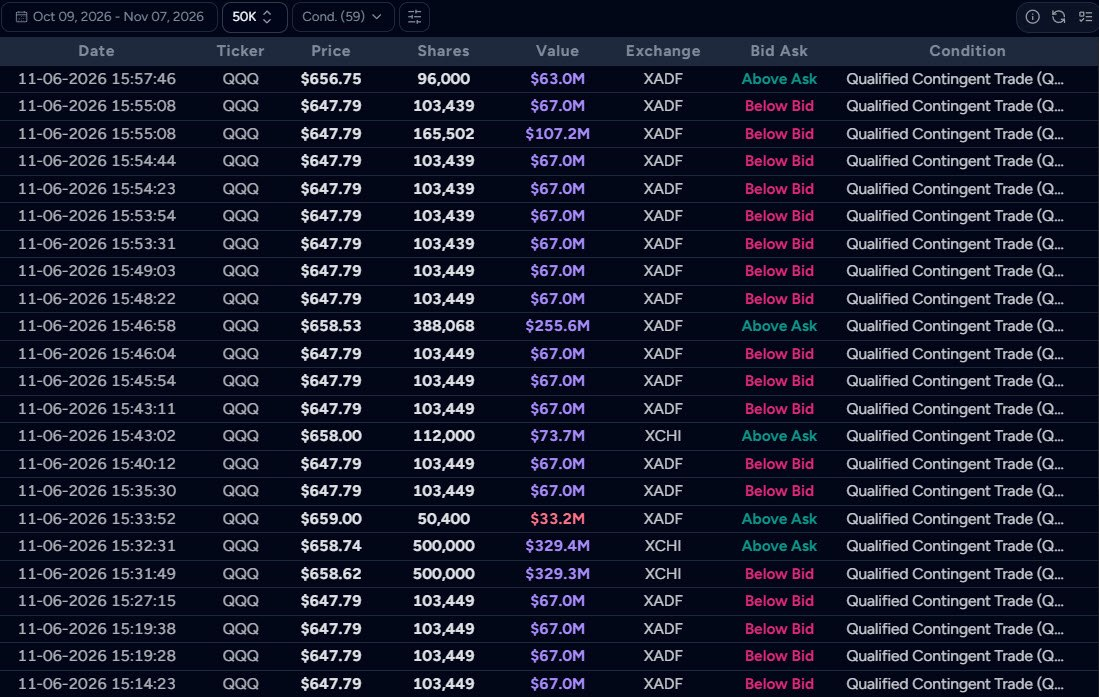
In roughly 20 minutes on Friday afternoon, between 3:35 and 3:55 PM, these QQQ prints at $647.79 crossed the tape:
- 103,449 shares, seven times, about $67 million each
- 103,439 shares, five times, about $67 million each
- 165,502 shares, once, $107.2 million
That repeating share count is a signature share size. An institution working a large position doesn’t dump it in one piece. It slices it into near-identical chunks and feeds them through, over and over. The sizes aren’t always exactly the same, as 103,449 versus 103,439 shows, but the fingerprint is unmistakable.
Once you recognize a signature share size, you can follow it. The same size at the same price, again and again, tells you you’re looking at one participant’s program, not random flow from thousands of traders.
One more thing this screenshot teaches
The live market was somewhere else. Mixed in with the $647.79 prints are real-time trades at $656.75, $658.00 and $658.53, including a 388,068-share block worth $255.6 million. That’s where QQQ was actually trading on Friday afternoon, roughly $10 above the late prints. The real-time blocks show what’s happening now. The late prints show what happened at Thursday’s close.
You’ll also see these prints carry the Qualified Contingent Trade (QCT) condition. A QCT is the stock leg of a paired transaction, executed together with a related position such as a derivative hedge. It’s one more sign you’re looking at structured institutional flow, not retail.
Lesson 3: The Size Showed Up at the Closes Before the Biggest Down Days
Line up the largest QQQ late prints with the session that followed the close they executed at:
| Executed at the Close of | Closing Price | Late Print Volume | Value | Next Session |
|---|---|---|---|---|
| Oct 21 | $725.20 | 7.47M | $5.4B | Oct 22: –2.86% |
| Oct 29 | $715.34 | 7.25M | $5.2B | Oct 30: –3.47% |
| Nov 4 | $691.95 | 6.83M | $4.7B | Nov 5: –6.49% |
| Nov 5 | $647.05 | 7.76M | $5.0B | Nov 6: +1.40% |
In the quieter stretch of late October, a typical QQQ late-print day was 0.9 to 2 million shares. The three largest QQQ late prints before the low each executed at a close that was immediately followed by a significant down day. The fourth, the largest of all, executed at the low.
It wasn’t just QQQ. At the November 4 close, the day before the biggest drop:
- SPY: 9.34 million shares, $7.2 billion, the largest SPY late print in the entire window
- DIA: 1.86 million shares, 16.27% of the day’s volume, the largest DIA late print in the window by a wide margin
- QQQ: 6.83 million shares, $4.7 billion
- IWM: 1.27 million shares, $360 million
That’s roughly $13.2 billion across the four index ETFs at a single close, right before QQQ dropped 6.5% and SPY dropped 4.4%.
Zoom out and the pattern is just as clear. In the six sessions from October 30 to November 6, QQQ late prints totaled 31.8 million shares and about $21.7 billion. In the six sessions before that, the total was about 14.2 million shares and $10.2 billion. Late-print activity more than doubled as the selloff unfolded.
Our read: this was distribution, and it was bearish
A single print on its own doesn’t stamp “buy” or “sell” on the tape. That’s why you read the print together with what price does next. And here, price answered the question three times in a row.
Massive late prints hit the close on October 21, October 29 and November 4. Each time, QQQ sold off hard the very next session, and it never recovered back to those levels. If those blocks had been institutional buying, they would have acted as support. Instead, price fell straight through every one of them and left them overhead.
That is what distribution looks like. Institutions were unloading long exposure, or putting on shorts and hedges, in size, at the closes, before the selling hit the broader market. By the time the price chart showed the damage, the big money had already moved. The positioning was done, and the late prints were the receipt.
This is the most important habit in reading late prints: the size tells you where institutions acted, and the price action that follows tells you which side they were on.
Lesson 4: The $647 Level – The Biggest Block Printed at the Low
On November 5, QQQ closed at $647.05, which was also its low of the day. That close attracted the largest QQQ late print of the entire window: 7.76 million shares at $647.79, worth $5.0 billion.
Three details make this one stand out:
- It printed at the low of the selloff. Not in the middle of the decline, but at the closing low after a 10.8% drop.
- QQQ outsized SPY. That day’s QQQ late print ($5.0B) was 2.5 times the SPY late print ($2.0B), even though SPY is the larger fund. QQQ’s late print was 10.53% of the day’s volume, versus 4.71% for SPY. The institutional focus was squarely on the Nasdaq.
- The next session never went back. On November 6, QQQ traded between $653.99 and $664.52. Its entire range held above the $647.79 level.
If this pattern looks familiar, it should. It’s the same footprint we documented at the [SPY $632 low in March](https://mobyticktrading.com/blogs/2026/05/19/late-prints-dark-pool-data): a massive late print at a level the next session didn’t revisit, followed by more size stacking nearby.
How you’ll know the bottom is in
The selloff pattern was massive late prints followed by lower prices. A bottom is the mirror image of that: massive late prints at the low, followed by a bounce that holds.
Here’s what to look for:
- Massive late prints at or near the low. Well above the normal flow, and ideally a large share of the day’s volume.
- A bounce the next session. Price lifts off the level instead of slicing through it.
- The level holds on any retest. Pullbacks stay at or above the late-print price.
- More size stacks nearby. Additional late prints at or above the level show institutions adding, not one-and-done. That’s the accumulation pattern from the SPY $632 low.
As of November 6, QQQ has checked the first two boxes. It printed the biggest late print of the selloff at the low, $5.0 billion at $647.79, then bounced 1.4% without ever trading back down to it. That’s the first bullish late-print signal since the selling started. Boxes three and four are what turn it from a bounce into a bottom.
QQQ late-print levels to watch
| Level | What Printed There | Combined Value |
|---|---|---|
| ~$647–648 | 7.76M shares at the Nov 5 closing low | $5.0B |
| ~$690–692 | 4.58M (Nov 2) + 6.83M (Nov 5) | $7.9B |
| ~$715 | 7.25M shares (Oct 30) | $5.2B |
| ~$725 | 7.47M (Oct 22) + 2.07M (Oct 29) | $6.9B |
The way to use these: if QQQ holds above $647 and starts stacking new late-print size nearby, that’s the accumulation pattern. If it loses $647 on volume, the biggest late print of the selloff has failed as support, and that’s information too. Overhead, the $690–692 zone, where nearly $8 billion changed hands, is the first area where the selloff’s positioning comes back into play.
A Late Print Checklist
Use this every time you look at the Late Prints table:
- Check the price against the previous close. If it matches, the trade belongs to the prior session. Don’t read it against today’s range.
- Compare the volume to the normal flow. One to two million QQQ shares is routine. Seven million stands out.
- Drill into the individual prints. Look for signature share sizes, the same share count repeating at the same price. That’s one institution’s program at work.
- Check across all four ETFs. One ETF printing big is interesting. SPY, QQQ, IWM and DIA all printing big at the same close is a market-wide repositioning.
- Note the %DP. A late print above 10% of daily volume is a meaningful share of everything that traded.
- Mark the level. The price where the size changed hands becomes a reference for future support and resistance.
- Let the next session tell you the direction. Big size followed by lower prices is distribution, which is bearish. Big size at a low followed by a bounce that holds is accumulation, which is bullish.
Key Takeaways
- Late prints usually execute at or near the previous session’s close. Every QQQ late print in this window was within $0.75 of the prior close, and most landed outside the day they were reported.
- Signature share sizes are the institution’s fingerprint. The $647.79 prints repeated at 103,449 and 103,439 shares, one program slicing a large position into near-identical pieces.
- The size showed up before the biggest down days, and it was bearish. The largest late prints executed at the October 21, October 29 and November 4 closes. Each was followed by a sharp decline, and price never reclaimed those levels. That’s institutional distribution.
- The largest late print hit the low, and that’s the first bullish signal. 7.76 million shares at $647.79, followed by a bounce that never traded back down to it.
- The bottom is in when massive late prints hit the low and the bounce holds. Size at the low, a bounce, a successful retest, and more size stacking nearby.
- Size tells you where; price tells you which side. Read every late print with the session that follows it.
The institutions were positioned before this selloff started. The traders who read the late prints saw it before the price chart did.
See the full Late Prints table, live, for SPY, QQQ, IWM and DIA at [Moby Tick Trading](https://mobyticktrading.com/features/late-prints).
Disclaimer: This content is for educational and informational purposes only. It does not constitute financial advice, trading recommendations, or a solicitation to buy or sell securities. Past performance and historical data are not indicative of future results. Always conduct your own due diligence before making trading decisions.
Ready to Trade with Whale-Level Insight?
Get institutional-grade dark pool intelligence delivered to your inbox every week.


Disclaimer: This newsletter is for informational and educational purposes only. It does not constitute financial advice, investment recommendations, or solicitation to buy or sell securities. Trading stocks, ETFs, and options involves substantial risk of loss. Past performance is not indicative of future results.