
Quick Answer: Whale Watching Stocks Explained
“Whale watching” in the stock market refers to monitoring the trading activity of large institutional investors — pension funds, hedge funds, mutual funds, and other entities that trade massive positions. These “whales” execute trades so large they can influence market prices and liquidity. This guide explains how to track institutional trading activity and what it tells you about the market.
Key Insight: Institutional investors account for the majority of trading volume in U.S. equity markets. When they move capital, they leave footprints in dark pool data that can reveal support levels, accumulation patterns, and sector rotation — information invisible to standard charting platforms.
Why Whale Watching Matters
When institutions move capital, they leave signals that can reveal:
- Support and resistance levels: Price points where large positions exist
- Accumulation patterns: Areas where institutions are building positions over time
- Sector rotation: Capital flowing between industries
- Institutional price levels: Where real money — not just chart patterns — has been committed
For retail traders, whale watching provides a window into the 30-40% of trading activity that happens off public exchanges — in dark pools and Alternative Trading Systems (ATS).
Where Whales Trade: Understanding Dark Pools
Dark pools are private exchanges where institutional investors execute large orders without displaying their intentions. These venues allow whales to trade millions of shares without alerting other traders who might front-run their orders.
Why Institutions Use Dark Pools
When a pension fund wants to buy 5 million shares of a stock, executing on a public exchange creates problems:
- Price impact: The order itself would move the market against them
- Information leakage: Other traders would see the order and adjust
- Execution risk: They’d pay progressively worse prices as the order filled
Dark pools solve these problems by matching orders privately. The trades still get reported to FINRA (within 10 seconds under current rules), but without pre-trade visibility.
What This Means for Whale Watchers
The key insight: dark pool trades represent executed orders, not pending orders. When you see a whale trade in dark pool data, that institution already has a position at that level. The data shows where capital was committed, not what’s going to happen next.
Real Whale Trades: Verified Dark Pool Data
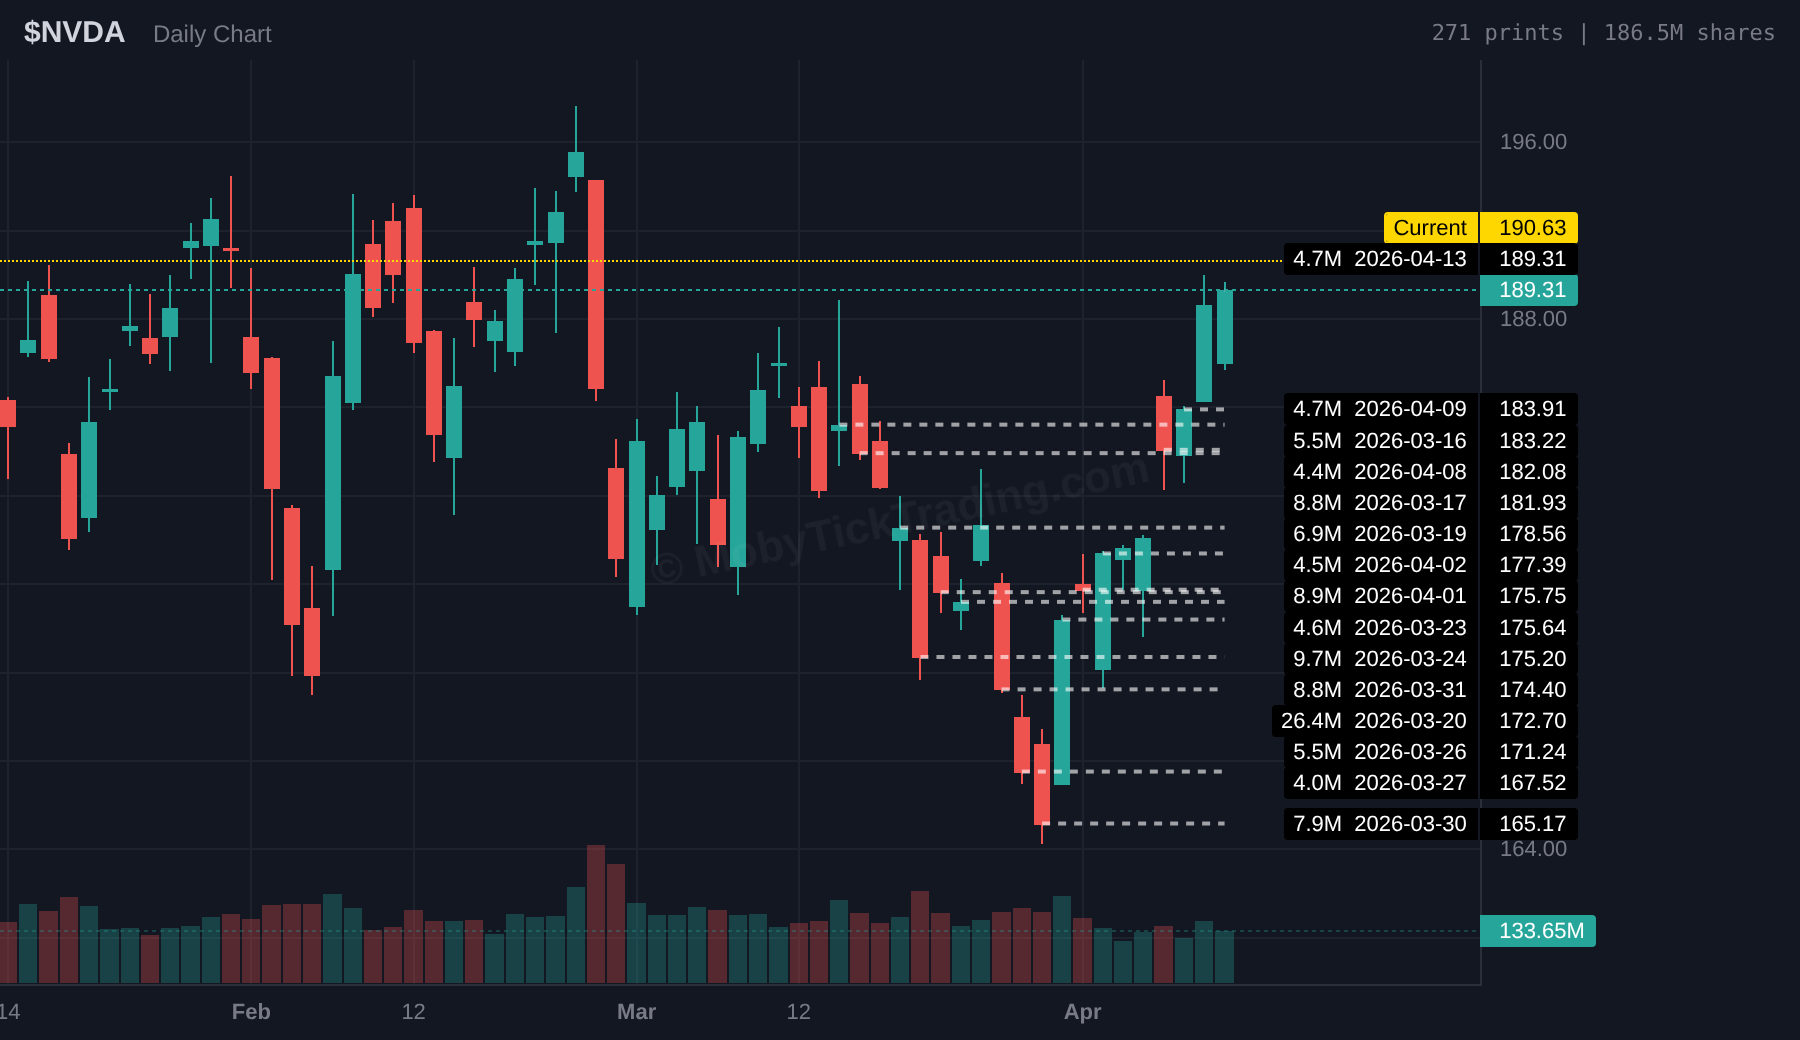
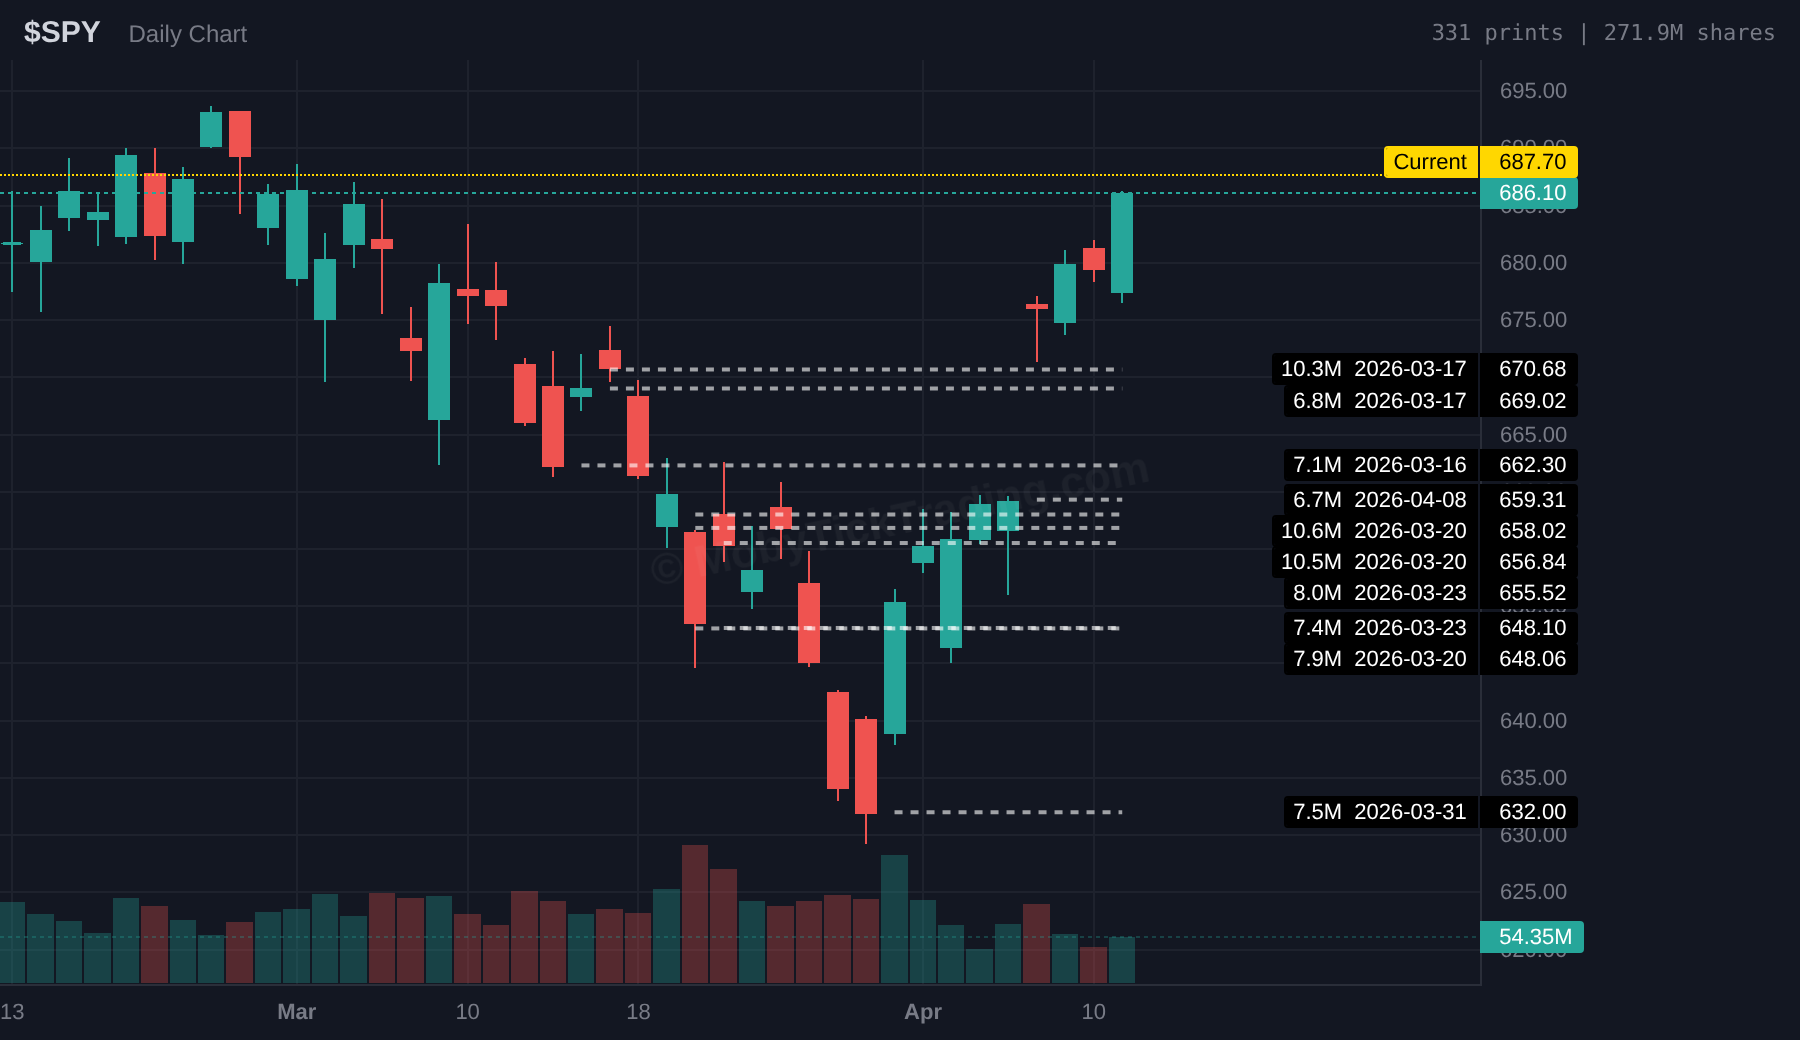
Here’s actual institutional trading activity from the week of March 16-24, 2026, verified through the MobyTick API:
The Giants: Multi-Billion Dollar Positions
| Ticker | Shares | Price | Dollar Value | Date | Significance |
|---|---|---|---|---|---|
| NVDA | 26.4M | $172.70 | $4.55B | March 20 | Largest 90-day print |
| SPY | 10.6M | $658.02 | $6.96B | March 20 | Largest 90-day print |
| AAPL | 15.8M | $251.64 | $3.98B | March 24 | Largest 30-day print |
| MSFT | 7.3M | $381.87 | $2.77B | March 20 | Largest 30-day print |
| AVGO | 8.2M | $322.79 | $2.64B | March 17 | Largest 30-day print |
| MU | 4.5M | $422.90 | $1.92B | March 20 | Largest 30-day print |
Five of these six stocks had their largest dark pool prints of the tracked period on the same two days — March 20 and March 24. That clustering of institutional activity across multiple names is the kind of signal whale watching reveals.
Sector Rotation Signals
Beyond individual stocks, dark pool data reveals capital flowing into specific sectors:
Technology / Semiconductors:
- NVDA: $4.55B at $172.70 (March 20)
- MSFT: $2.77B at $381.87 (March 20)
- AVGO: $2.64B at $322.79 (March 17)
- MU: $1.92B at $422.90 (March 20)
Financials:
- JPM: $1.12B at $286.56 (March 20)
- BAC: $634M at $47.16 (March 20)
The semiconductor sector showed over $12 billion in verified dark pool prints across four stocks within a single week — concentrated institutional activity that no public chart makes visible.
How Whale Watching Works in Practice
1. Identify Price Levels Where Whales Are Positioned
When multiple large prints cluster at a specific price, that level becomes significant. Institutions have positions there.
Example: The $172.70 level in NVDA saw a $4.55 billion dark pool print on March 20 — the largest print in the 90-day tracked period. As of April 14, NVDA trades at $190.63, above this zone. The dark pool data shows where institutional money was positioned during the March weakness.
2. Track Accumulation Over Time
A single large print could be a one-time rebalancing. Consistent prints at similar prices over weeks indicate systematic position building.
Signs of accumulation:
- Multiple prints at the same price level across different days
- Gradual increase in print size over time
- Prints occurring at similar prices even as price moves
3. Watch for Outliers
Some whale trades stand out even among institutional activity. The NVDA $4.55 billion print represents a single institution’s (or coordinated group’s) conviction at a specific level — on a day when the broader market was under pressure.
4. Cross-Reference With Price Action
Dark pool data shows where institutions positioned, not when price will move. The edge comes from combining whale watching with technical analysis, volume context, and other research tools.
What to Look for in a Dark Pool Scanner
| Feature | Why It Matters |
|---|---|
| Coverage | More stocks = more whale sightings. MobyTick tracks 10,000+ tickers. |
| Historical Data | Back-test whether whale levels correlated with subsequent price action. MobyTick has 6+ years. |
| Real-Time Alerts | Know immediately when whales execute large trades. |
| Opening/Closing Filters | Distinguish genuine institutional positioning from mechanical index rebalancing. |
MobyTick for Whale Watching
MobyTick provides the coverage and depth needed for serious whale watching:
- 10,000+ stocks tracked: More than any competitor
- 6+ years of historical data: See how whale positions evolved over time
- Real-time alerts: Get notified when large prints execute
- 91% accuracy rate: On trade callouts using dark pool support/resistance levels (based on backtesting 2020-2026)
- Opening/closing filters: Focus on real institutional intent vs. index rebalancing
- Starting at $19.99/month: Institutional-quality data at retail prices
Common Questions About Whale Watching
Can retail traders actually profit from whale watching?
Whale watching provides information about where institutions are positioned, not directional signals. Knowing where whales have positions helps identify significant price levels that may act as support or resistance.
How quickly are dark pool trades reported?
FINRA requires trades to be reported within 10 seconds of execution under current rules.
What counts as a “whale” trade?
There’s no official threshold, but common definitions include: 100,000+ shares per trade, $200,000+ notional value, or 5%+ of average daily volume.
Do whale trades predict market direction?
No. A large print shows execution, not intent. Clustering of prints at specific levels — combined with accumulation patterns — can indicate institutional conviction at those prices.
Is dark pool data legal?
Yes. All dark pool trades are reported to FINRA and become public record.
The Bottom Line
Whale watching gives retail traders visibility into the 30-40% of market activity that standard platforms miss. It’s not about following institutional trades blindly — it’s about understanding where institutional capital is concentrated, at what levels, and in what concentrations.
The largest players in the market leave footprints. Learning to read those footprints — through dark pool data, block trade tracking, and accumulation analysis — provides an edge that traditional technical analysis alone cannot offer.
See today’s institutional trading activity for free at DarkPoolHeatmap.com — or start a MobyTick trial for real-time alerts, historical analysis, and accumulation signals across 10,000+ stocks.
Get weekly dark pool insights delivered to your inbox. Subscribe to the free MobyTick weekly report.
Data verified against MobyTick API as of April 14, 2026. All dollar values represent aggregate dark pool print values from FINRA Trade Reporting Facility data.