

🐋 The Whale Playbook Weekly
Week of May 18–22, 2026
Follow the Money. See What Others Can’t.
This WordPress draft turns the weekly newsletter into a blog-ready article. It includes the corrected scorecard, market overview, institutional ETF flow, full bullish and bearish setup ladders, 13 chart sections, and the webinar recap Dave wanted featured.
Last Week’s Scorecard Review
Market Overview
Market Overview
The major U.S. index ETFs finished the May 11–15 week mixed to softer after early-week strength, which matches the tighter trigger ladders in this issue. SPY closed Friday at 739.17 after trading a weekly range of 731.83 to 749.53. QQQ closed at 708.93 with a weekly range of 696.64 to 722.03. IWM closed at 277.60 and continued to lag the large-cap complex, while DIA finished at 495.37.
On a week-over-week basis, SPY moved +0.37%, QQQ moved -0.20%, IWM moved -2.57%, and DIA moved -0.09%. The broad-market tape still carried heavy institutional participation, but the week ended with less extension than the prior issue and a more cautious setup profile.
Broad-market ETF dark pool flow still dominated at $20.7B across SPY, QQQ, IWM, VOO, and IVV. Sector SPDR flow totaled $2.3B, with XLV leading the group. The heaviest single-stock names were MSFT ($11.0B), AAPL ($7.3B), NVDA ($5.7B), INTC ($2.8B), and MU ($2.8B).
The practical read for this newsletter is straightforward: institutions were still active, but the week looked more like consolidation and repositioning than straight-line expansion. That is why the callout sheet sits closer to current structure instead of assuming the same kind of extension we saw in the previous issue.
Where the Smart Money Moved
Where the Smart Money Moved
• SPY led broad ETF flow with $11.0B. QQQ followed with $4.3B and IWM added $1.7B.
• Outside the broad-market trio, VOO printed $1.8B and IVV printed $2.0B. Passive index exposure stayed active even as the tape cooled.
• On the sector side, XLV showed the largest footprint, while several sectors stayed quiet. That concentration suggests selective rotation rather than a broad all-sector push.
Bullish Setups
Bearish Setups
Trade Setups — May 18–22, 2026
$SPY — SPDR S&P 500 ETF Trust
Dark Pool Context: $11.0B total flow | 14.84M shares | 18 prints | Avg print $740.54
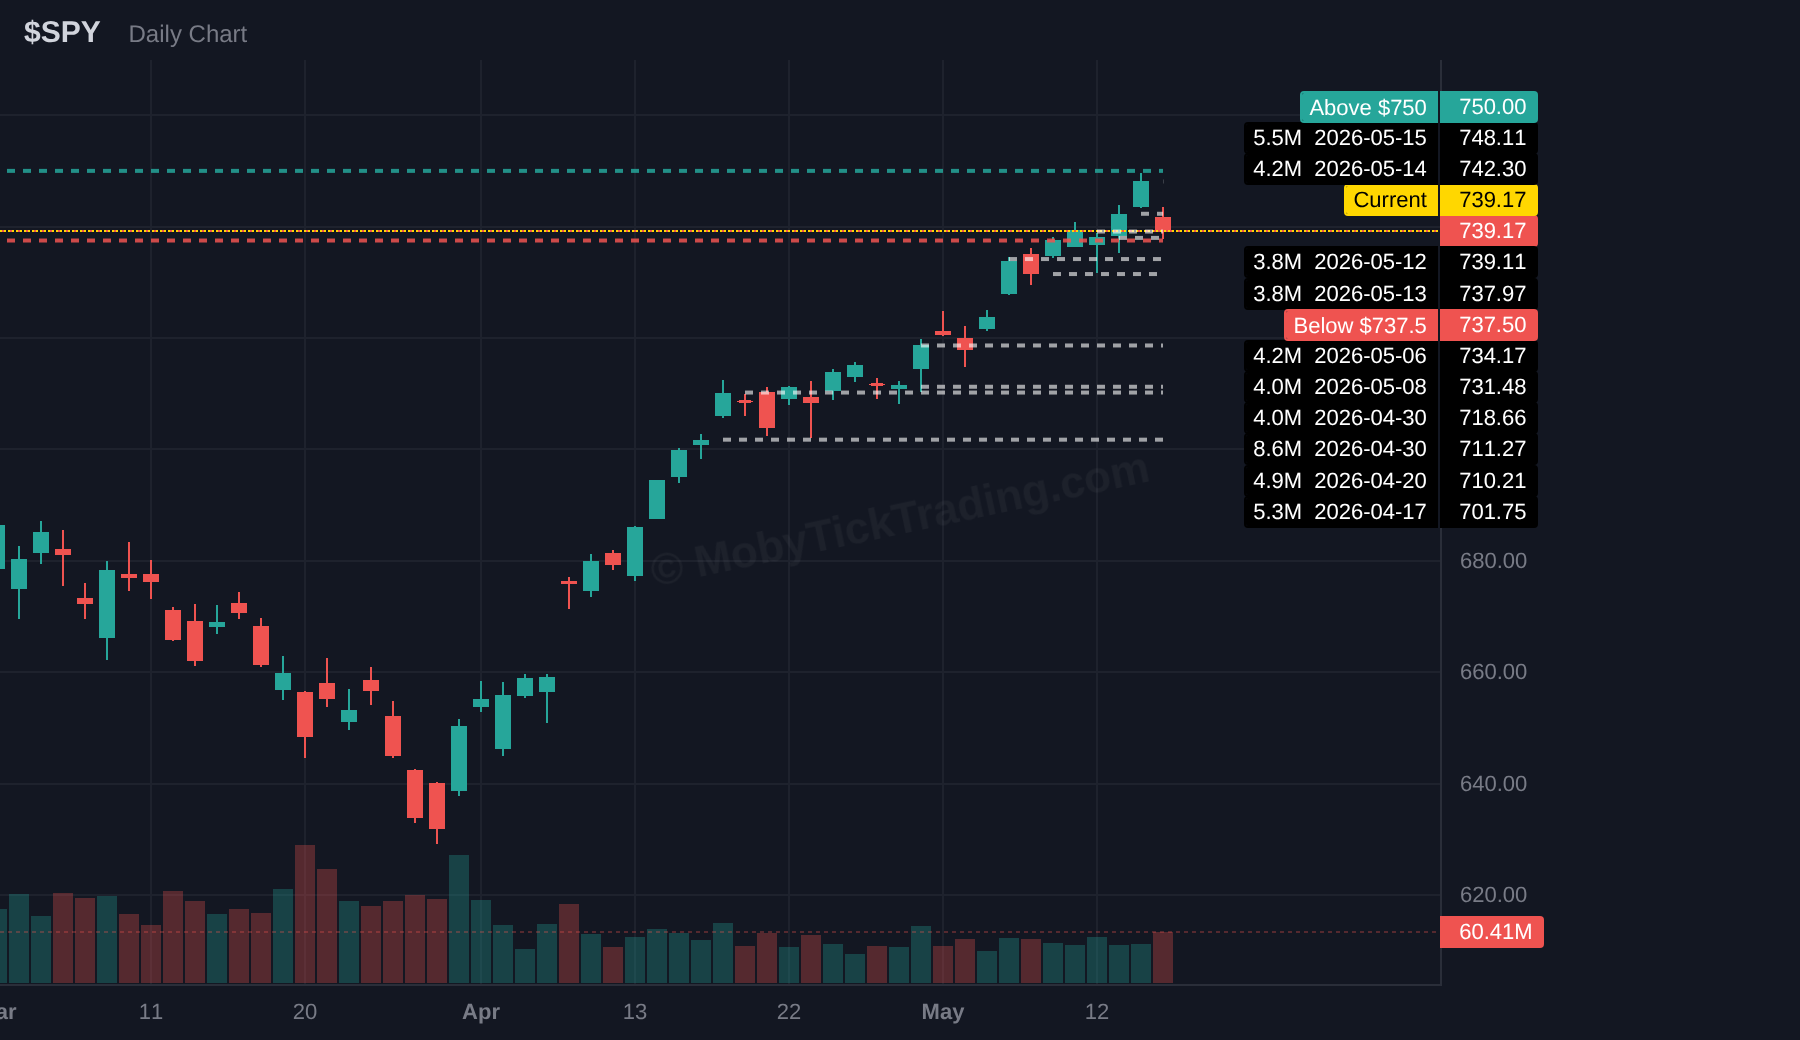
Above $750.00 — $752.50, $755.00, $760.00, $762.50
Below $737.50 — $735.00, $732.50, $730.00, $725.00, $720.00
$QQQ — Invesco QQQ Trust
Dark Pool Context: $4.3B total flow | 6.00M shares | 7 prints | Avg print $712.86
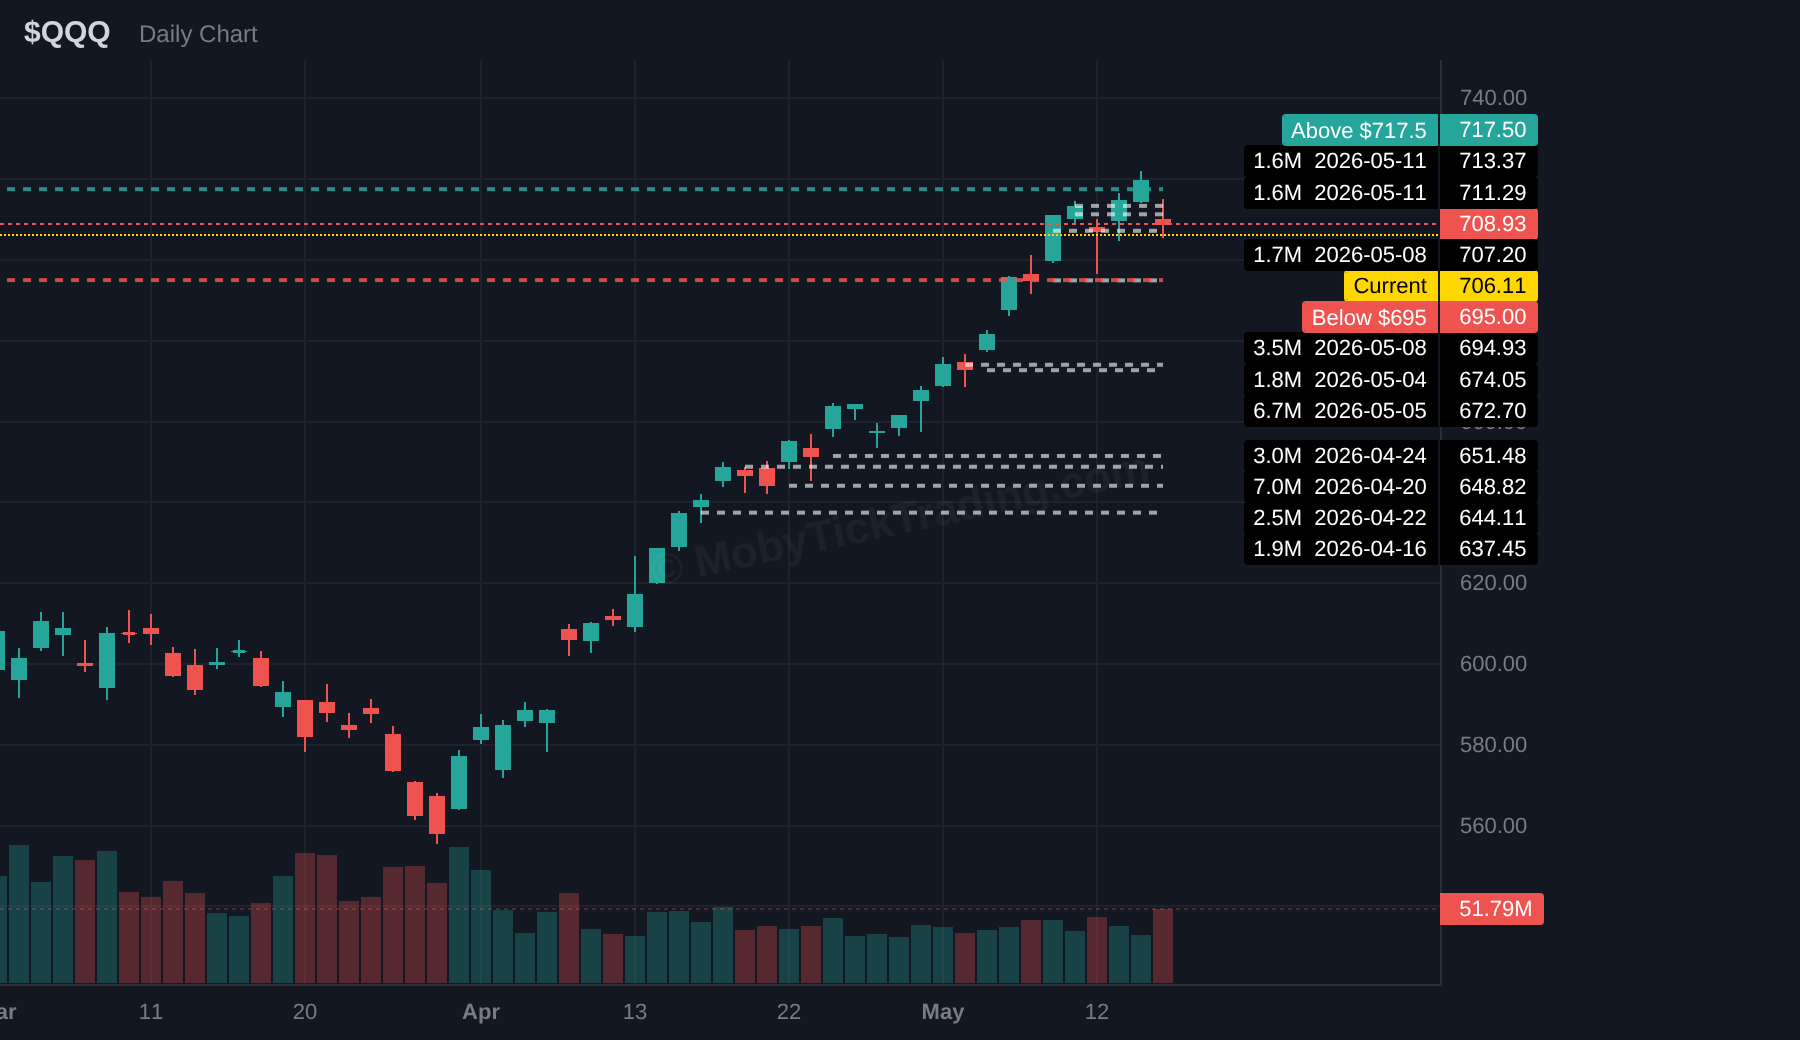
Above $717.50 — $720.00, $722.50, $725.00, $730.00, $735.00, $740.00
Below $695.00 — $692.50, $690.00, $685.00, $680.00, $675.00
$IWM — iShares Russell 2000 ETF
Dark Pool Context: $1.7B total flow | 5.99M shares | 8 prints | Avg print $281.93
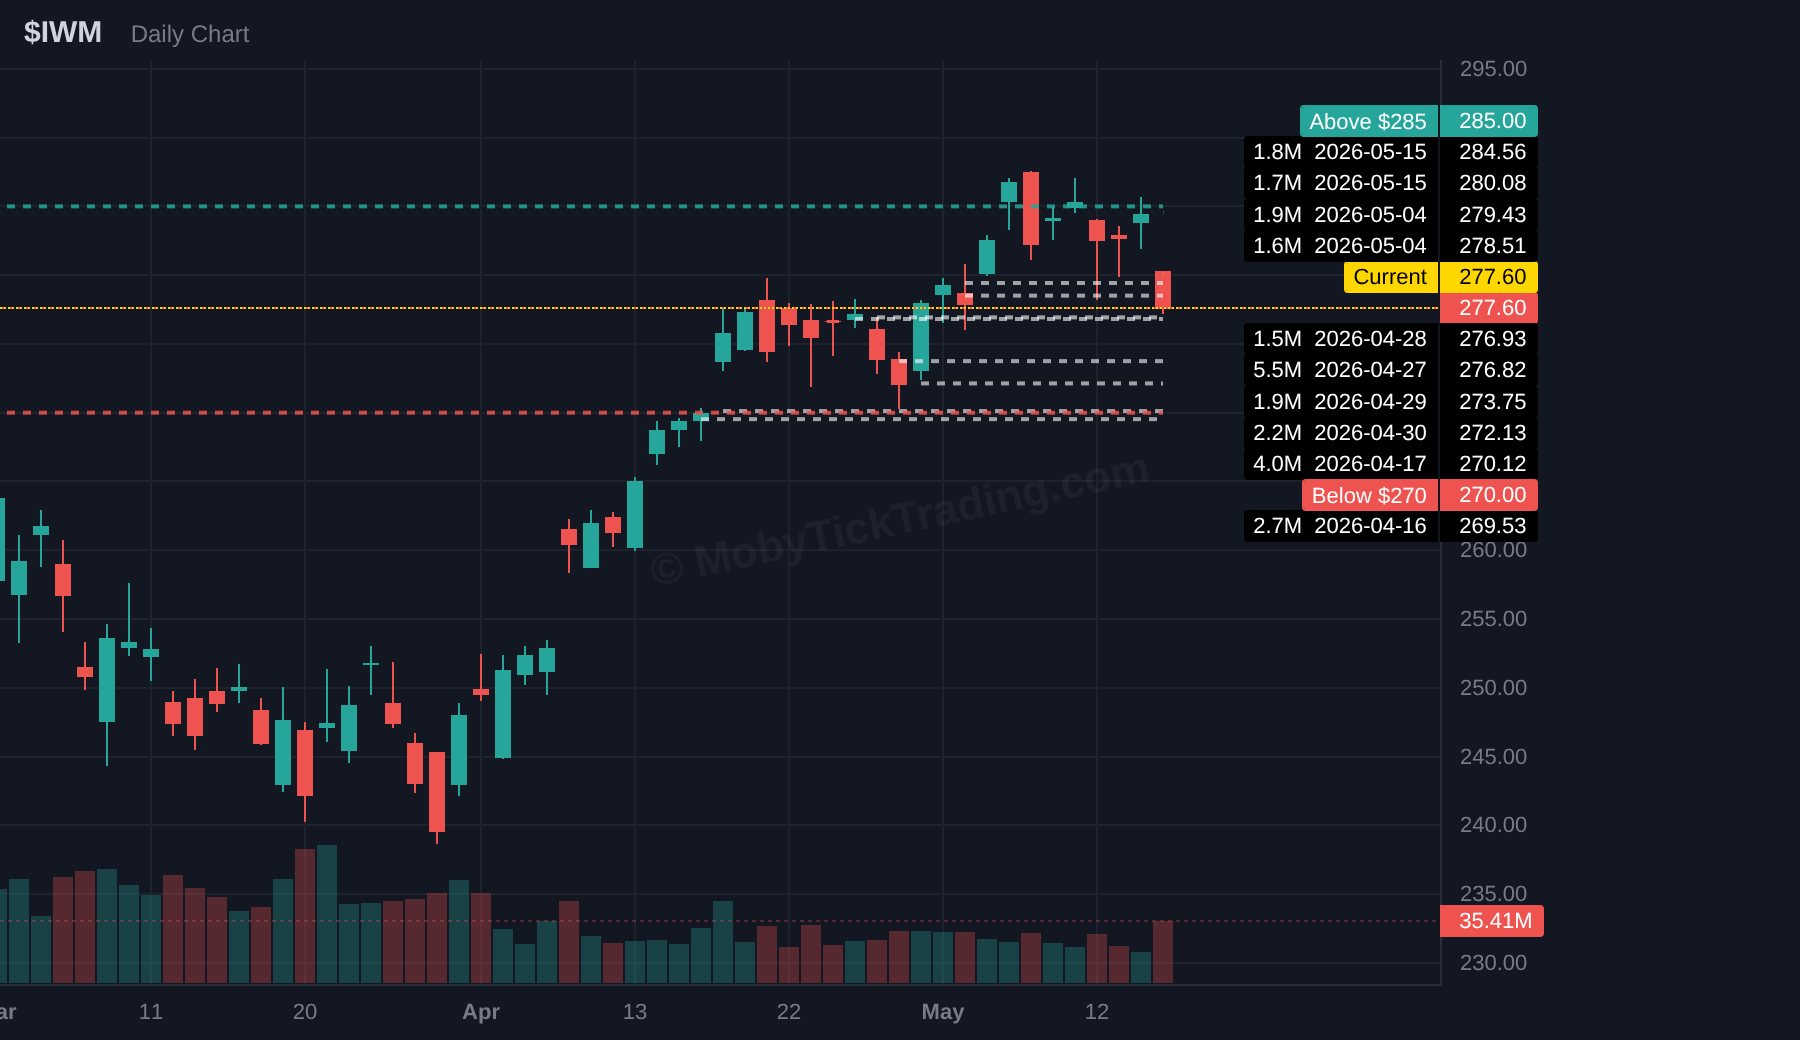
Above $285.00 — $287.50, $290.00, $292.50, $295.00
Below $270.00 — $267.50, $265.00, $262.50, $260.00, $255.00
$MSFT — Microsoft
Dark Pool Context: $11.0B total flow | 26.84M shares | 10 prints | Avg print $410.40
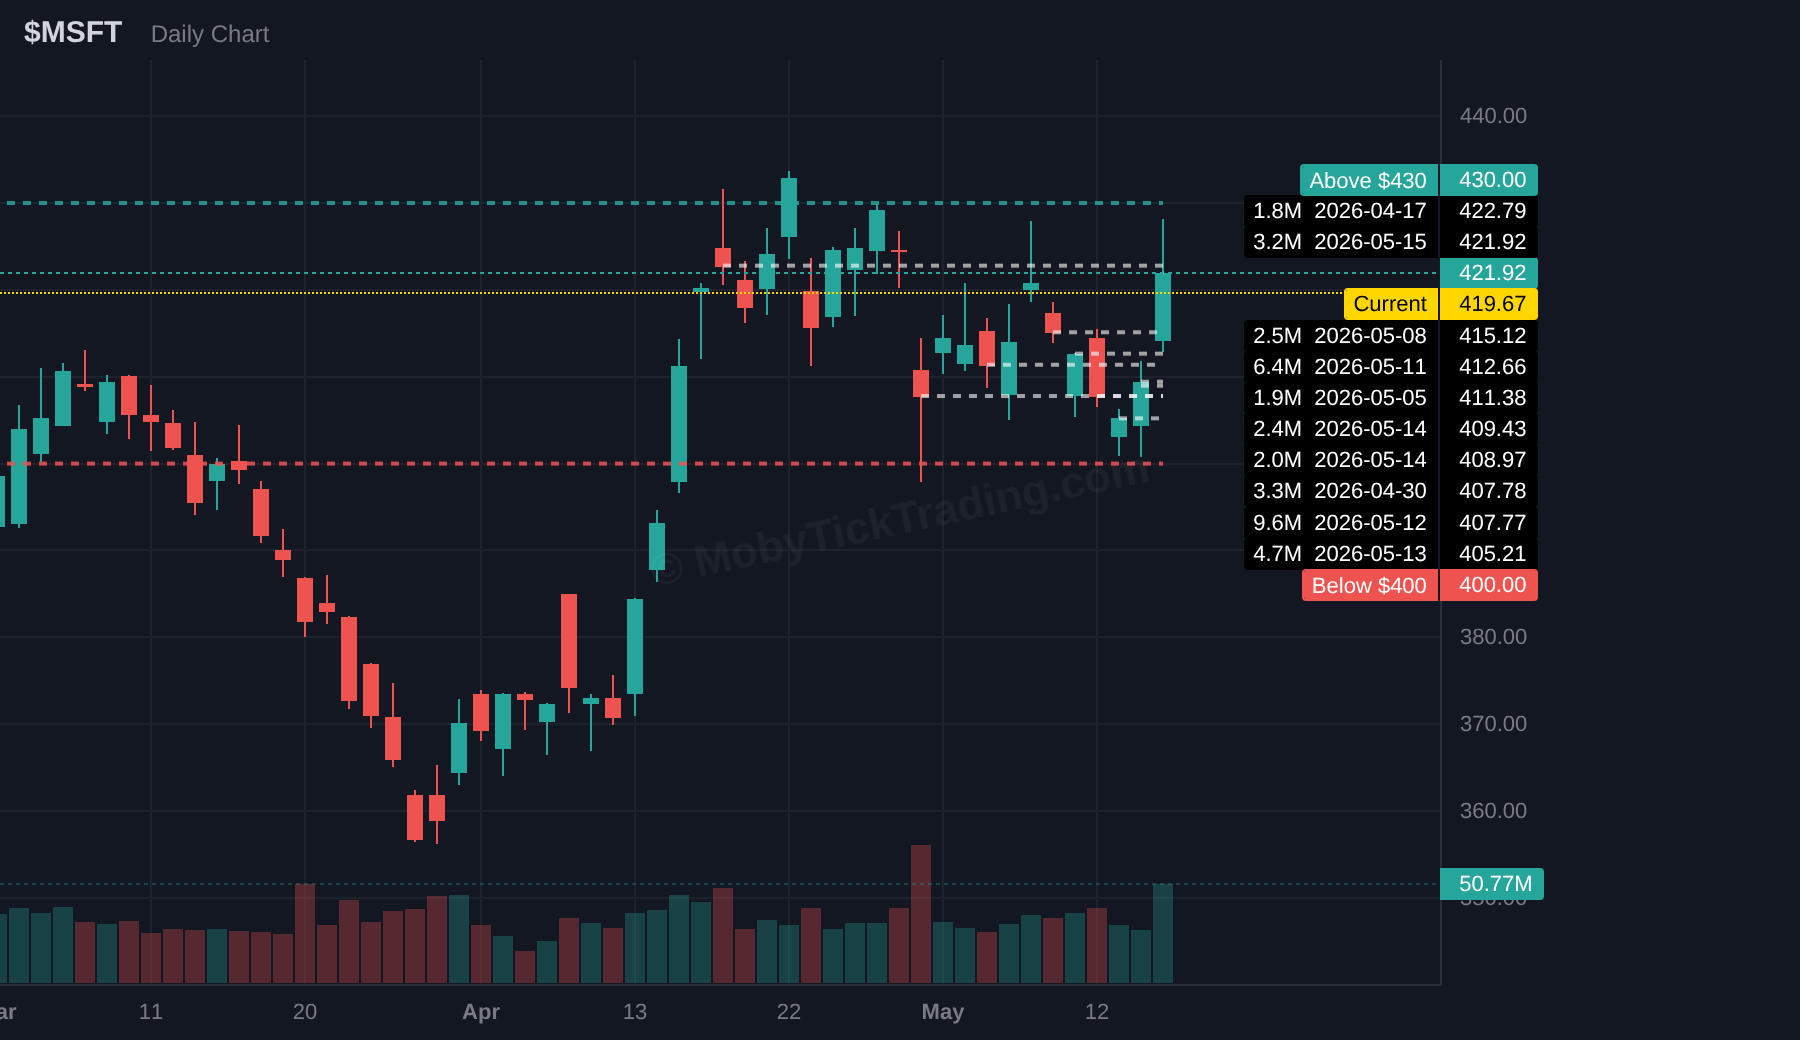
Above $430.00 — $432.50, $435.00, $440.00, $445.00, $450.00, $460.00
Below $400.00 — $395.00, $390.00, $385.00, $380.00, $375.00
$AAPL — Apple
Dark Pool Context: $7.3B total flow | 24.43M shares | 13 prints | Avg print $297.40
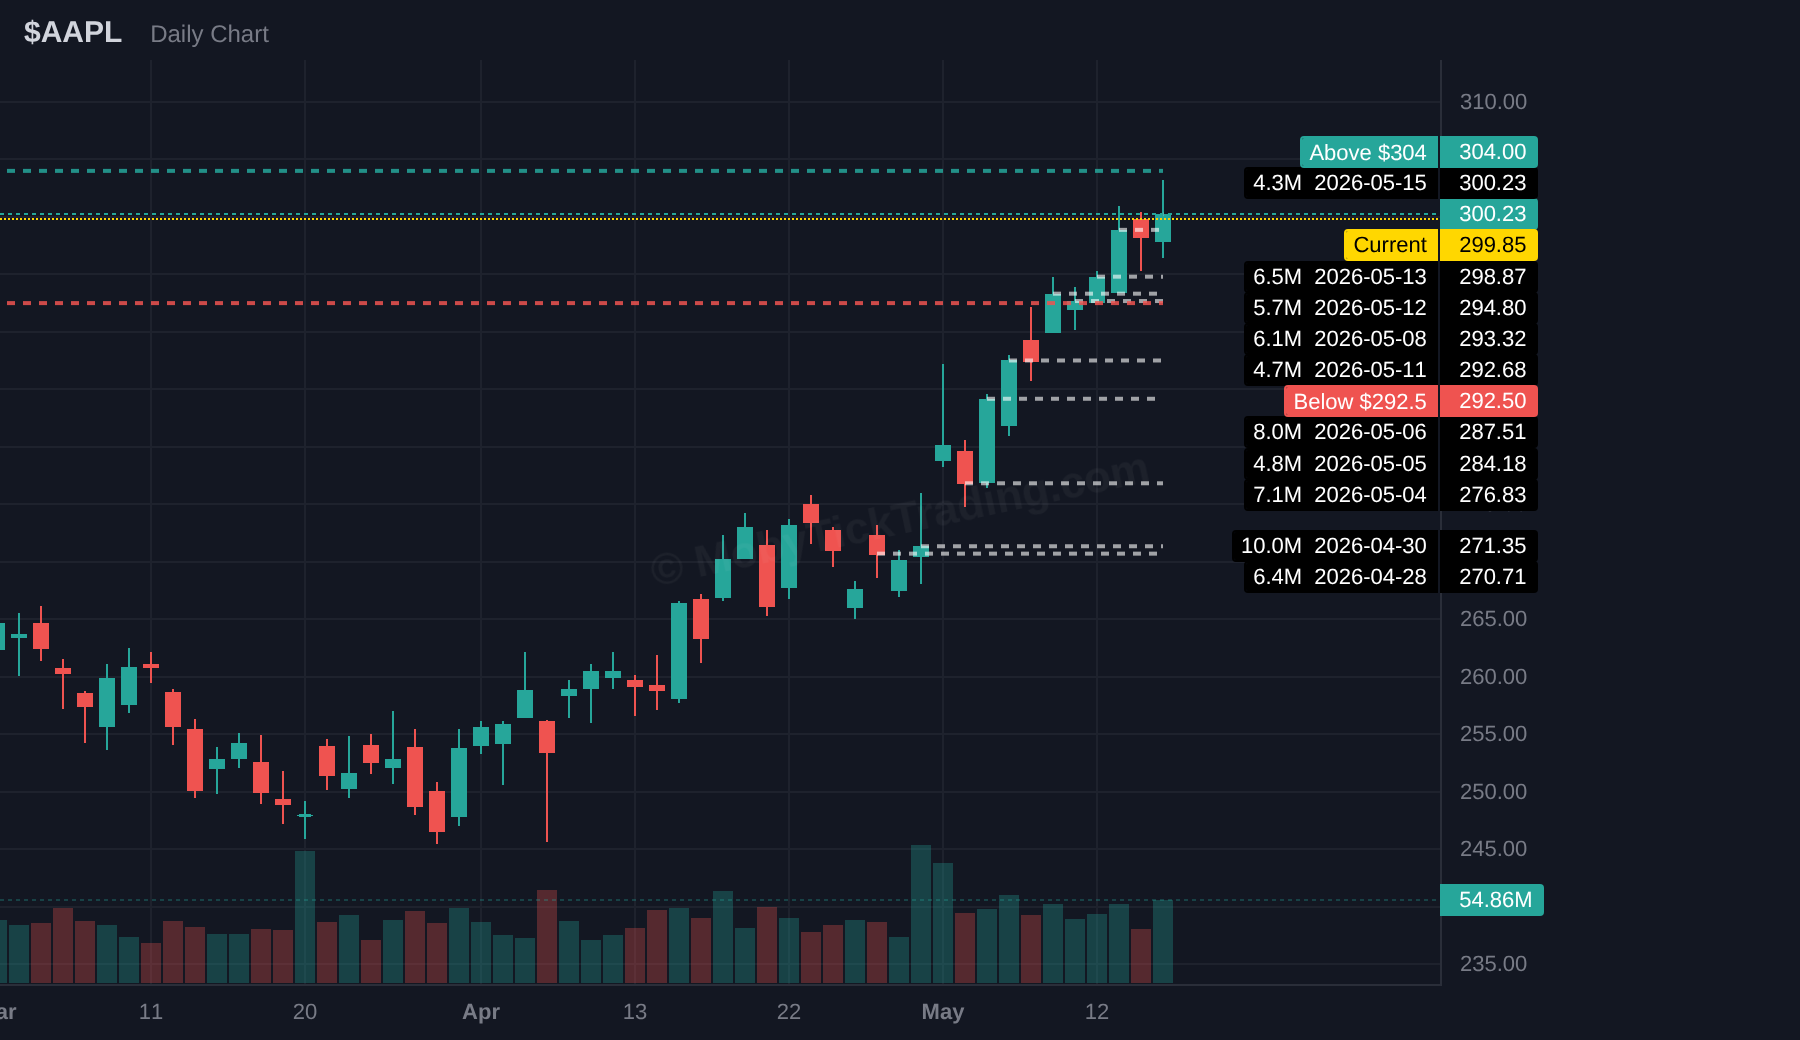
Above $304.00 — $305.00, $306.25, $307.50, $310.00, $312.50
Below $292.50 — $290.00, $287.50, $285.00, $282.50, $280.00
$NVDA — NVIDIA
Dark Pool Context: $5.7B total flow | 25.48M shares | 12 prints | Avg print $223.85
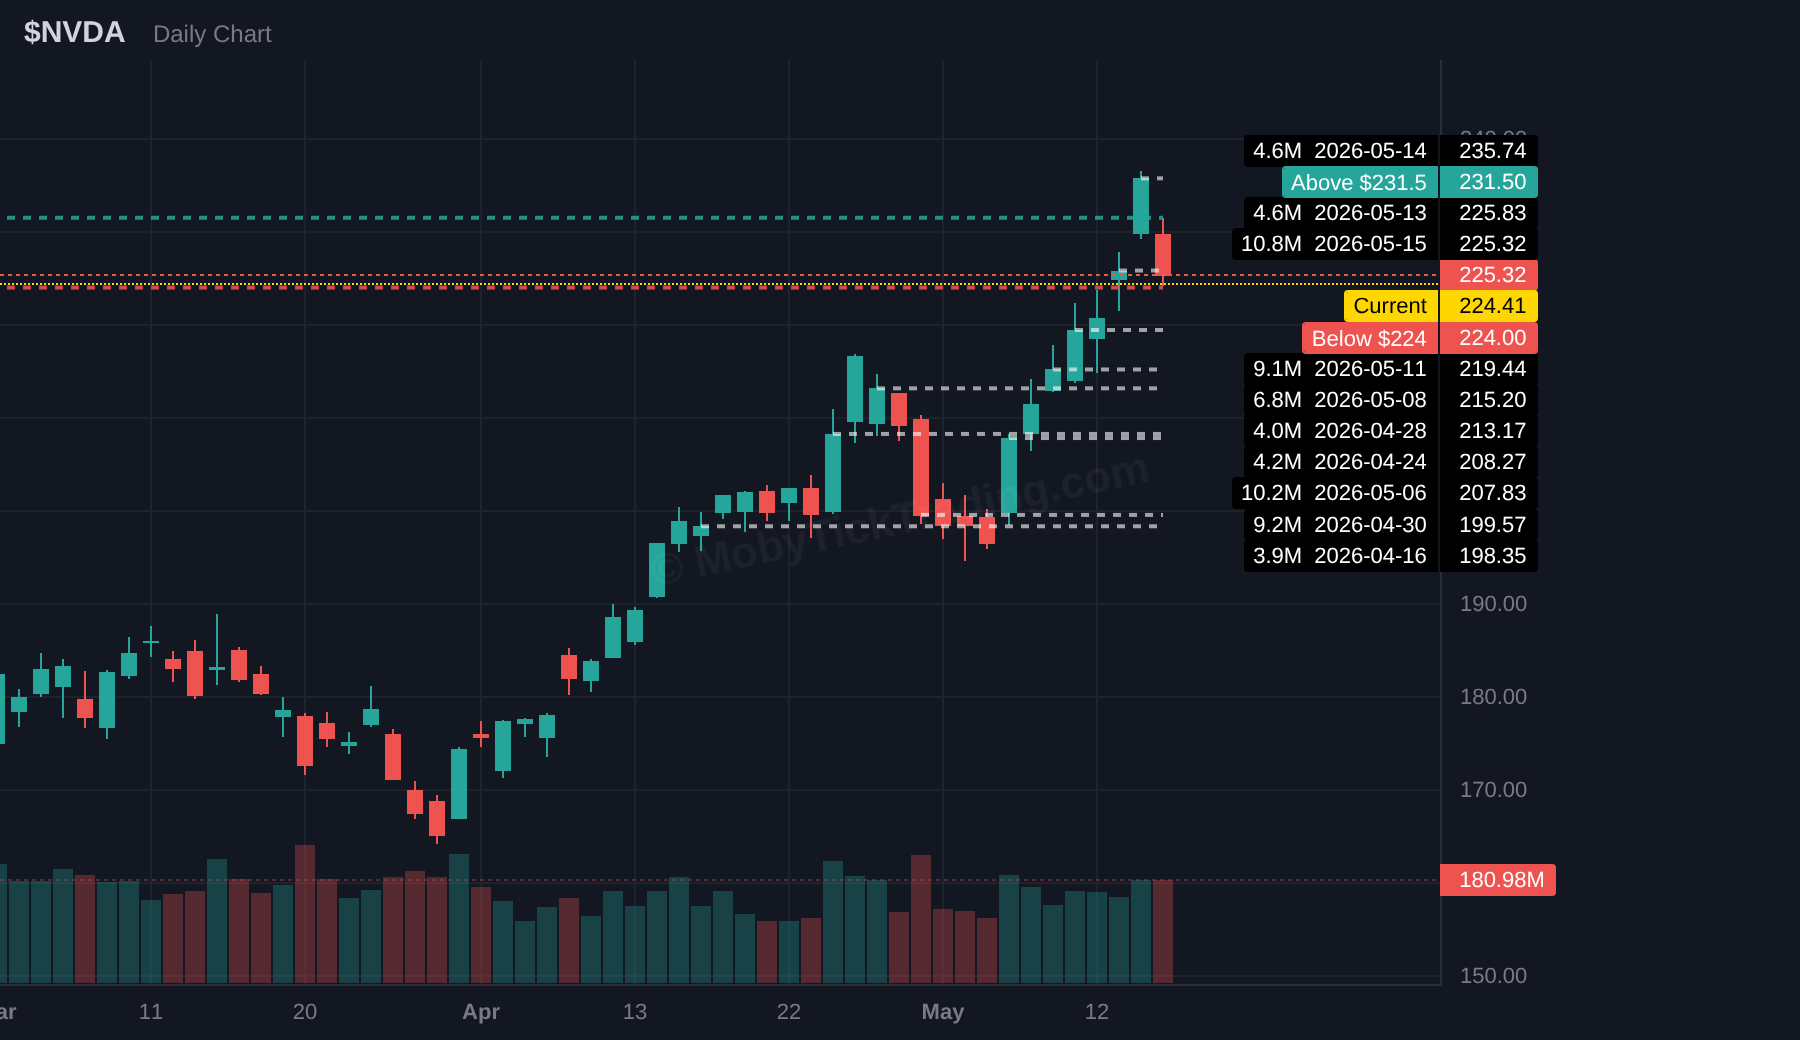
Above $231.50 — $235.00, $237.50, $240.00, $245.00, $250.00
Below $224.00 — $222.50, $220.00, $217.50, $216.25, $215.00
$INTC — Intel
Dark Pool Context: $2.8B total flow | 23.76M shares | 15 prints | Avg print $118.42
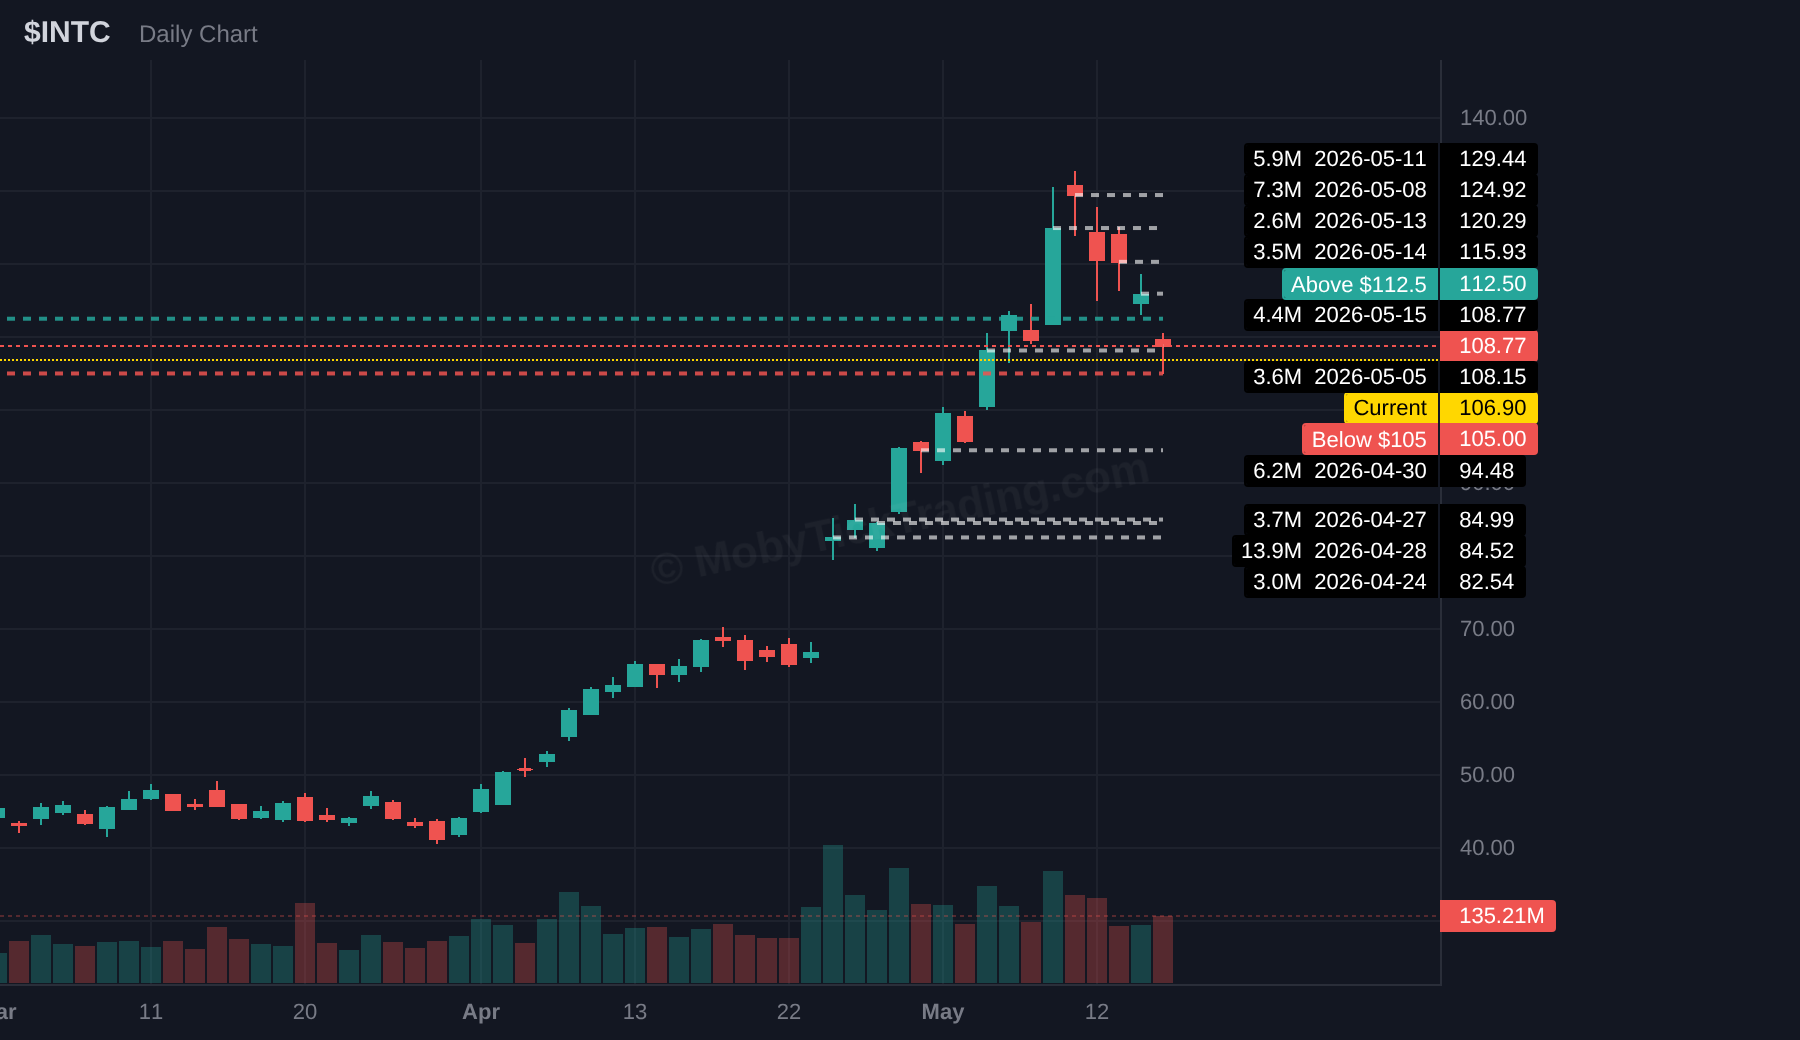
Above $112.50 — $115.00, $117.50, $120.00, $122.50, $125.00
Below $105.00 — $102.50, $100.00, $97.50, $95.00, $93.75
$MU — Micron
Dark Pool Context: $2.8B total flow | 3.58M shares | 6 prints | Avg print $770.34
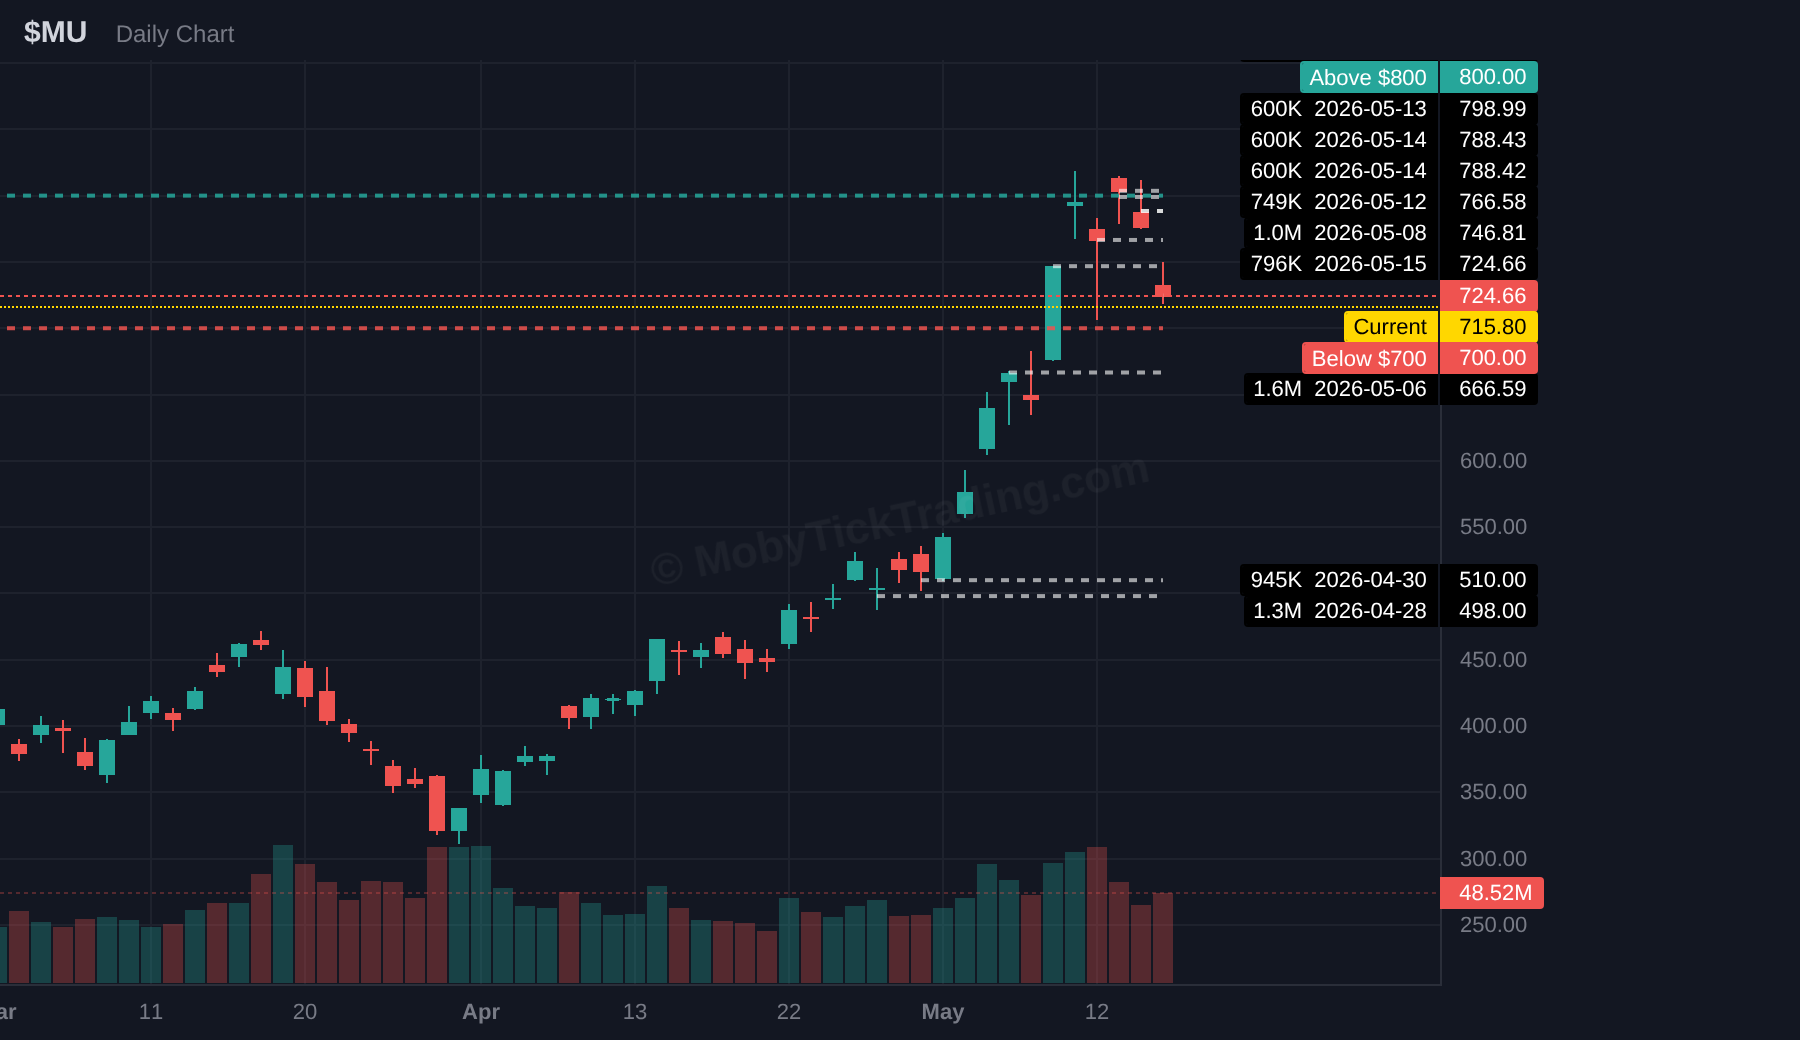
Above $800.00 — $812.50, $825.00, $850.00, $875.00, $900.00, $925.00
Below $700.00 — $675.00, $650.00, $625.00, $600.00, $577.50, $550.00
$GOOGL — Alphabet
Dark Pool Context: $2.4B total flow | 6.12M shares | 5 prints | Avg print $389.92
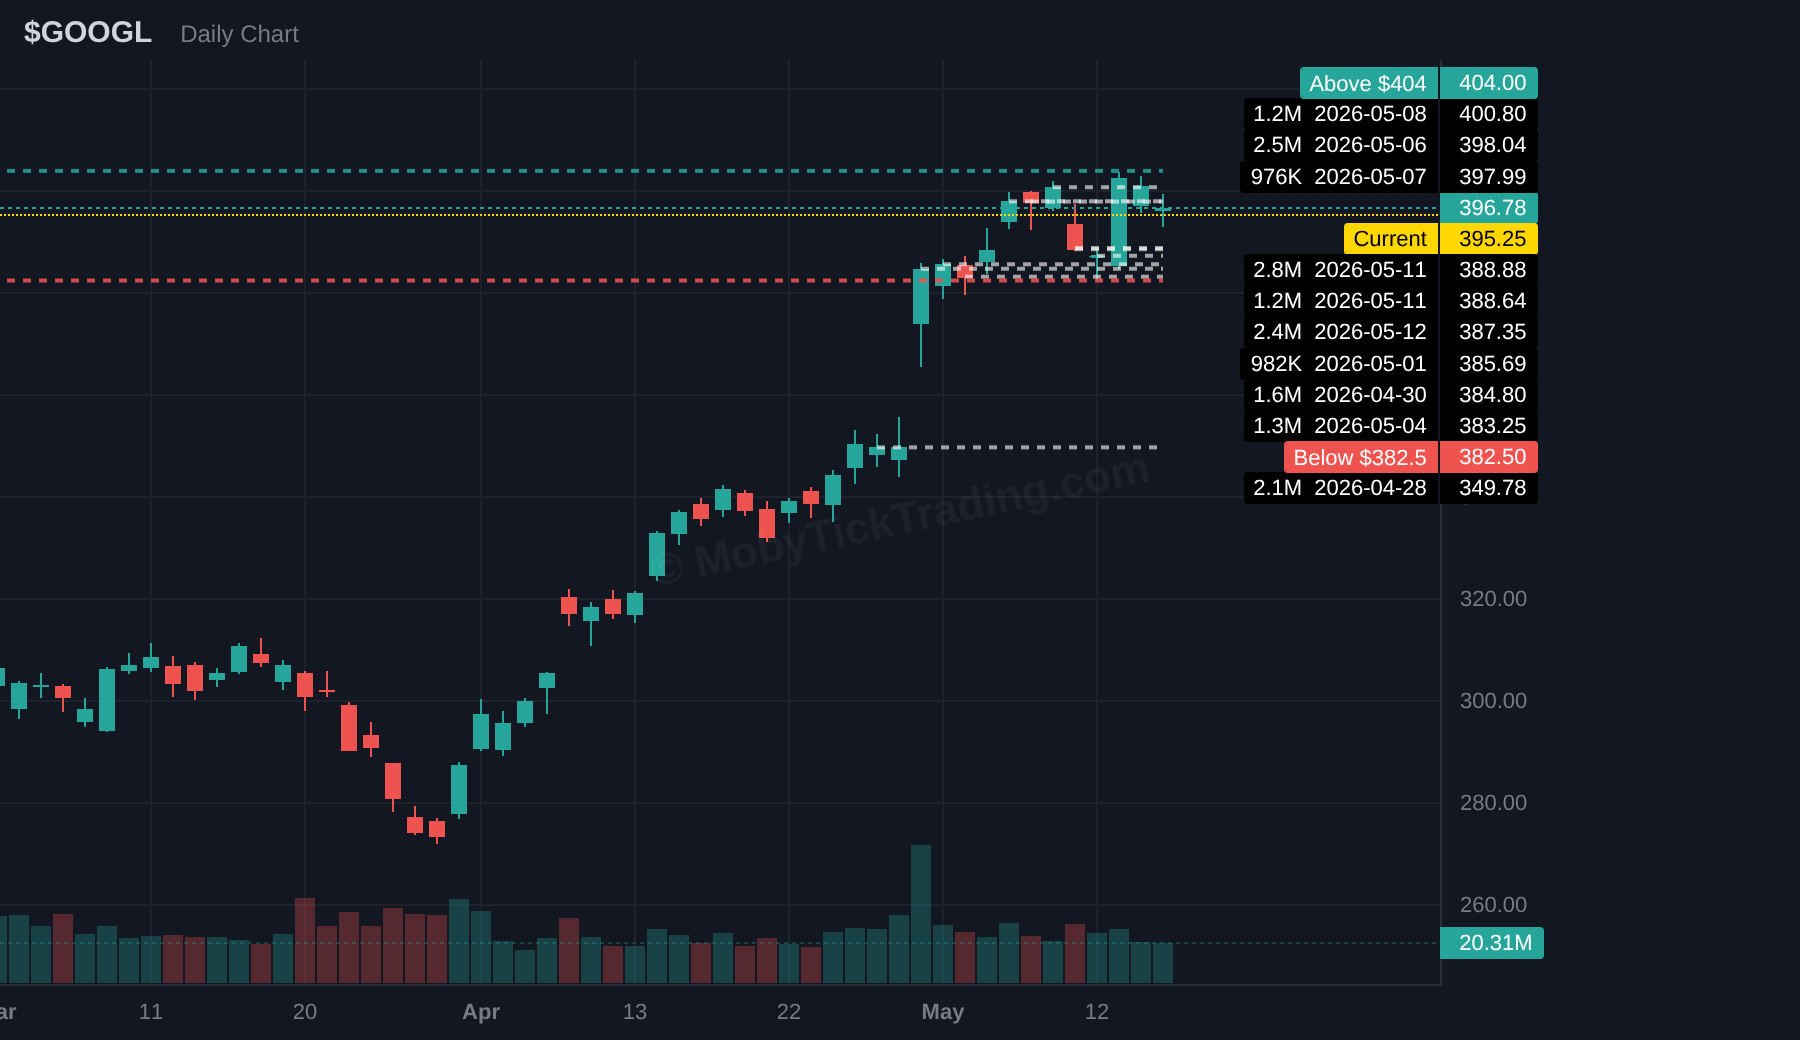
Above $404.00 — $406.25, $407.50, $410.00, $412.50, $415.00, $420.00
Below $382.50 — $380.00, $377.50, $375.00, $370.00, $360.00, $352.50
$XOM — Exxon Mobil
Dark Pool Context: $1.8B total flow | 12.07M shares | 11 prints | Avg print $152.67
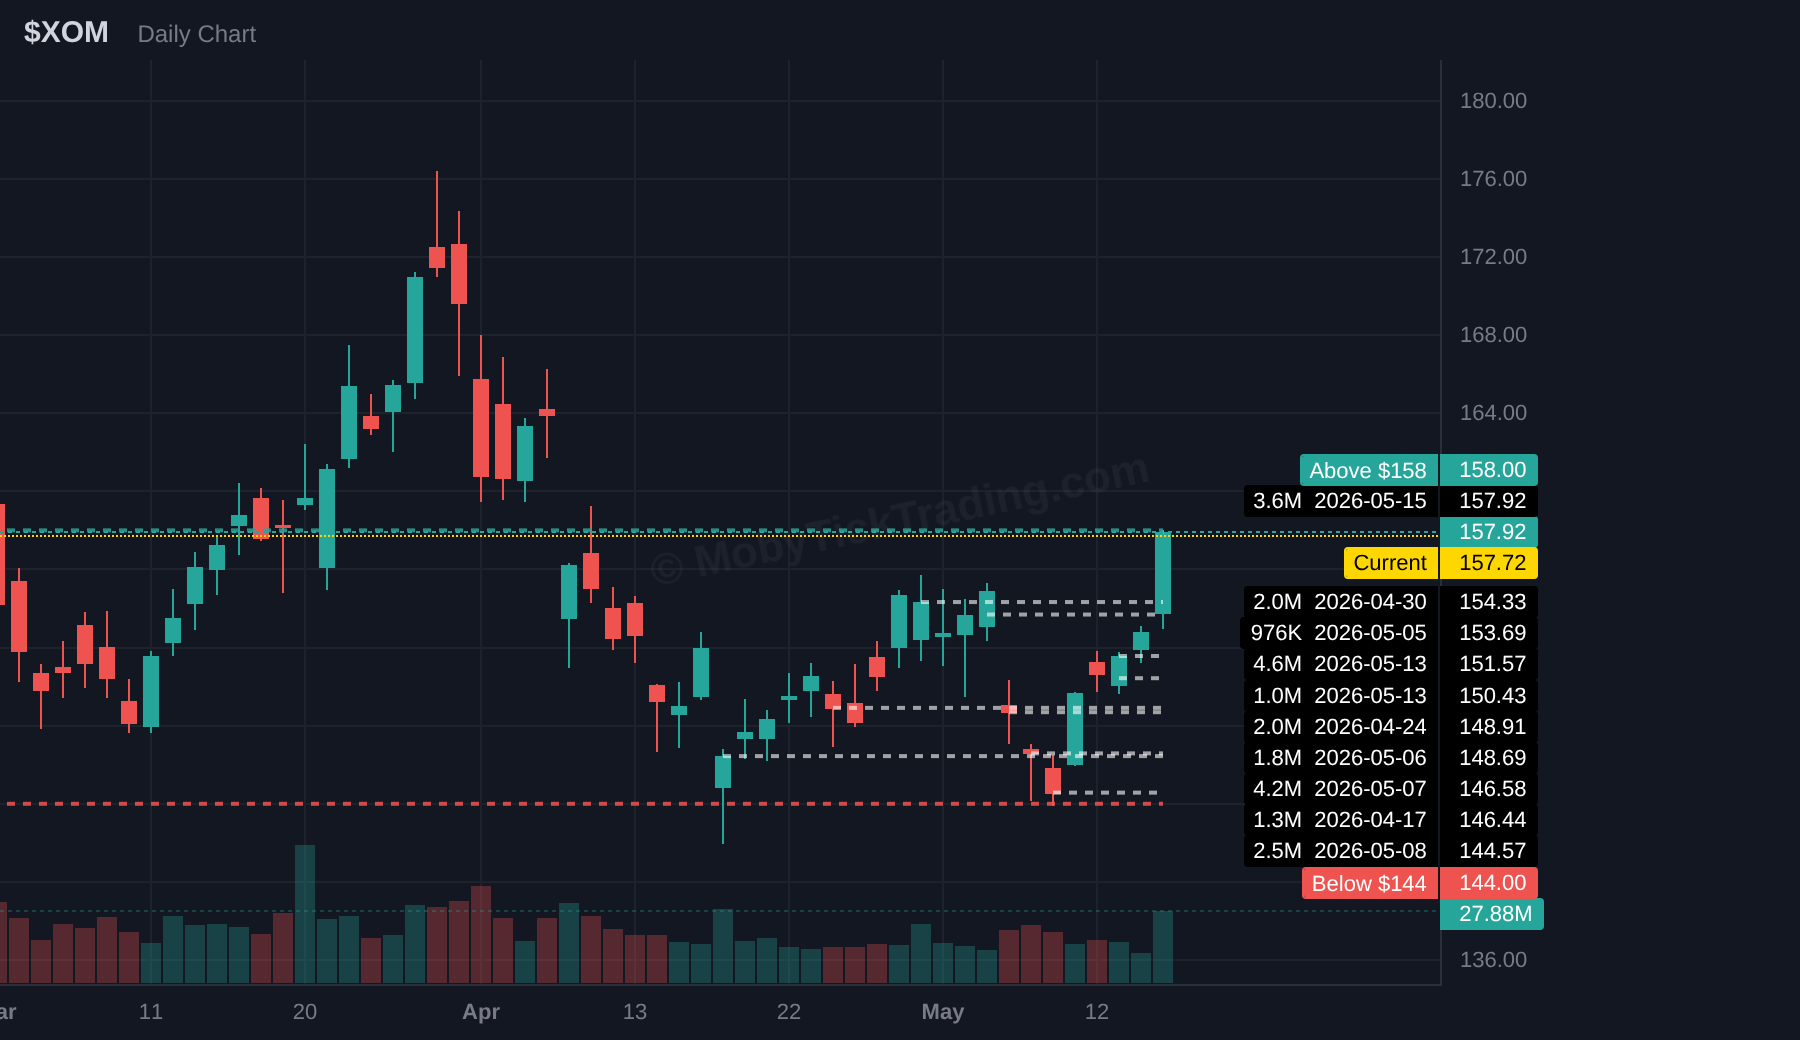
Above $158.00 — $160.00, $162.50, $165.00, $167.50, $170.00
Below $144.00 — $142.50, $140.00, $138.00, $135.50, $132.50
$AMZN — Amazon
Dark Pool Context: $1.8B total flow | 6.82M shares | 5 prints | Avg print $267.96
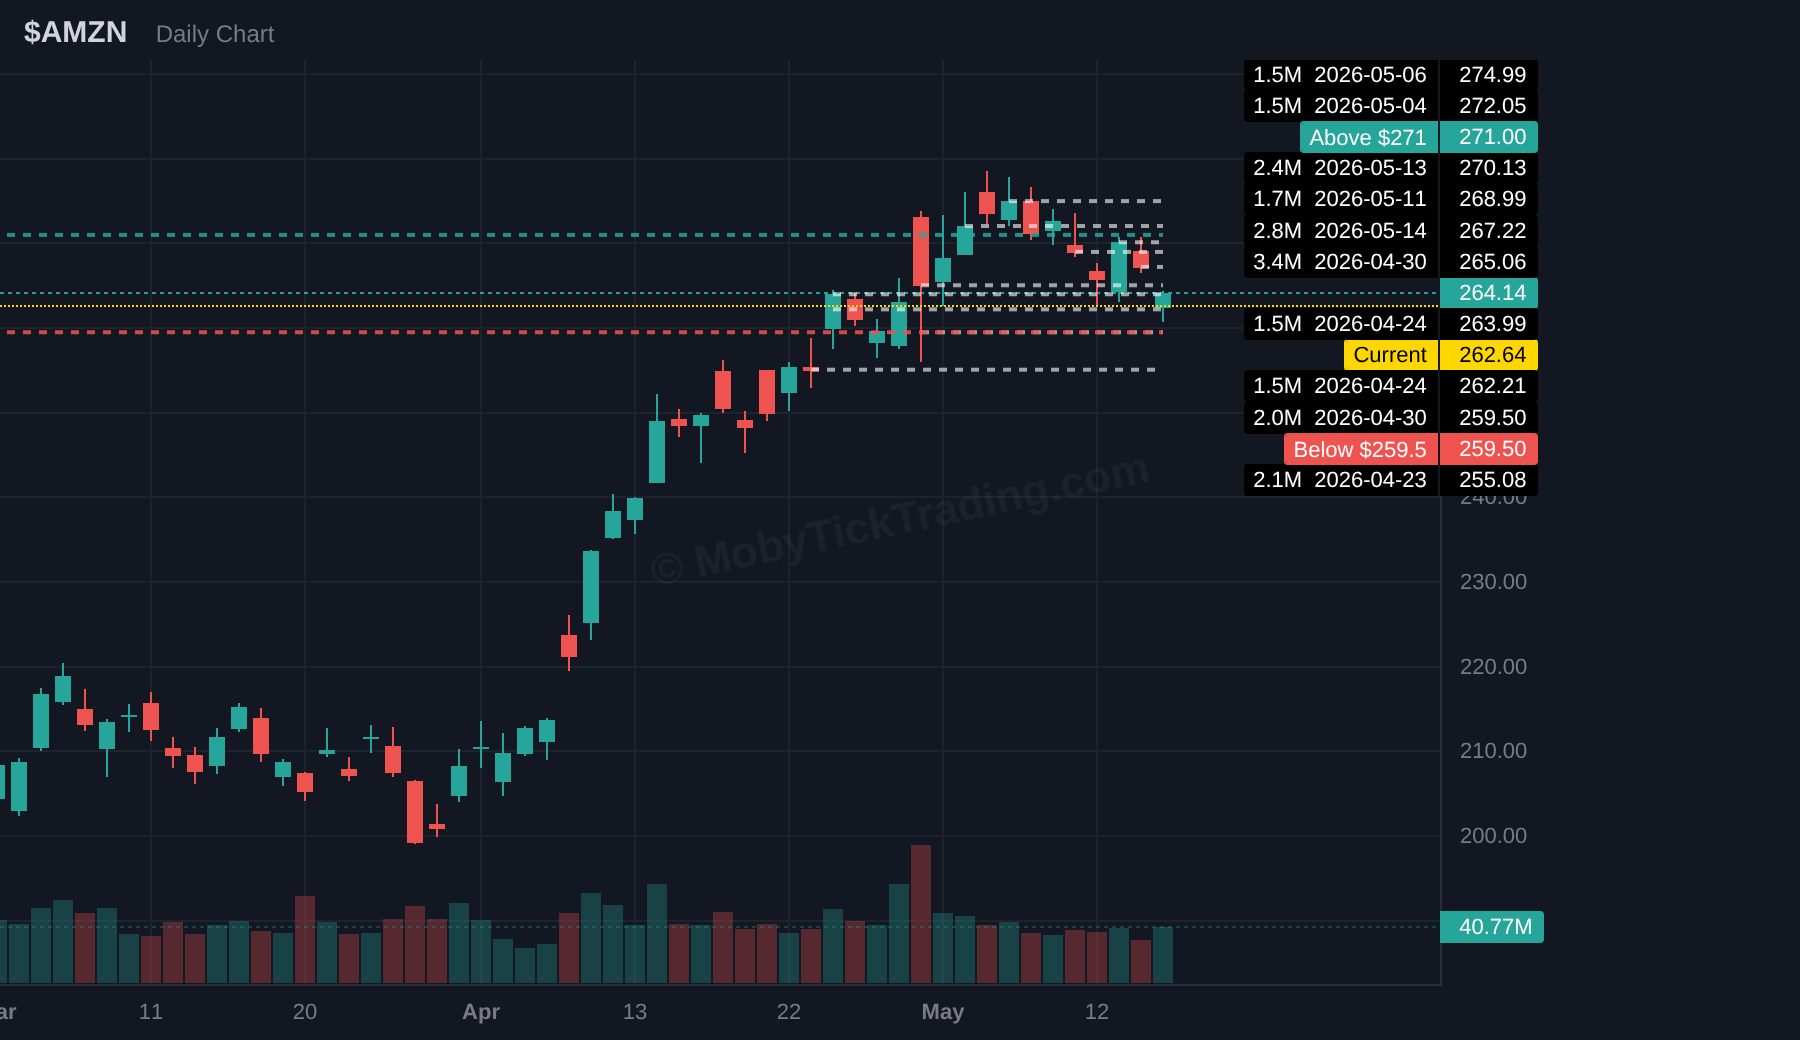
Above $271.00 — $272.50, $275.00, $277.50, $280.00, $285.00
Below $259.50 — $257.50, $255.00, $252.50, $250.00, $247.50
$NOW — ServiceNow
Dark Pool Context: $0.5B total flow | 5.20M shares | 4 prints | Avg print $91.44
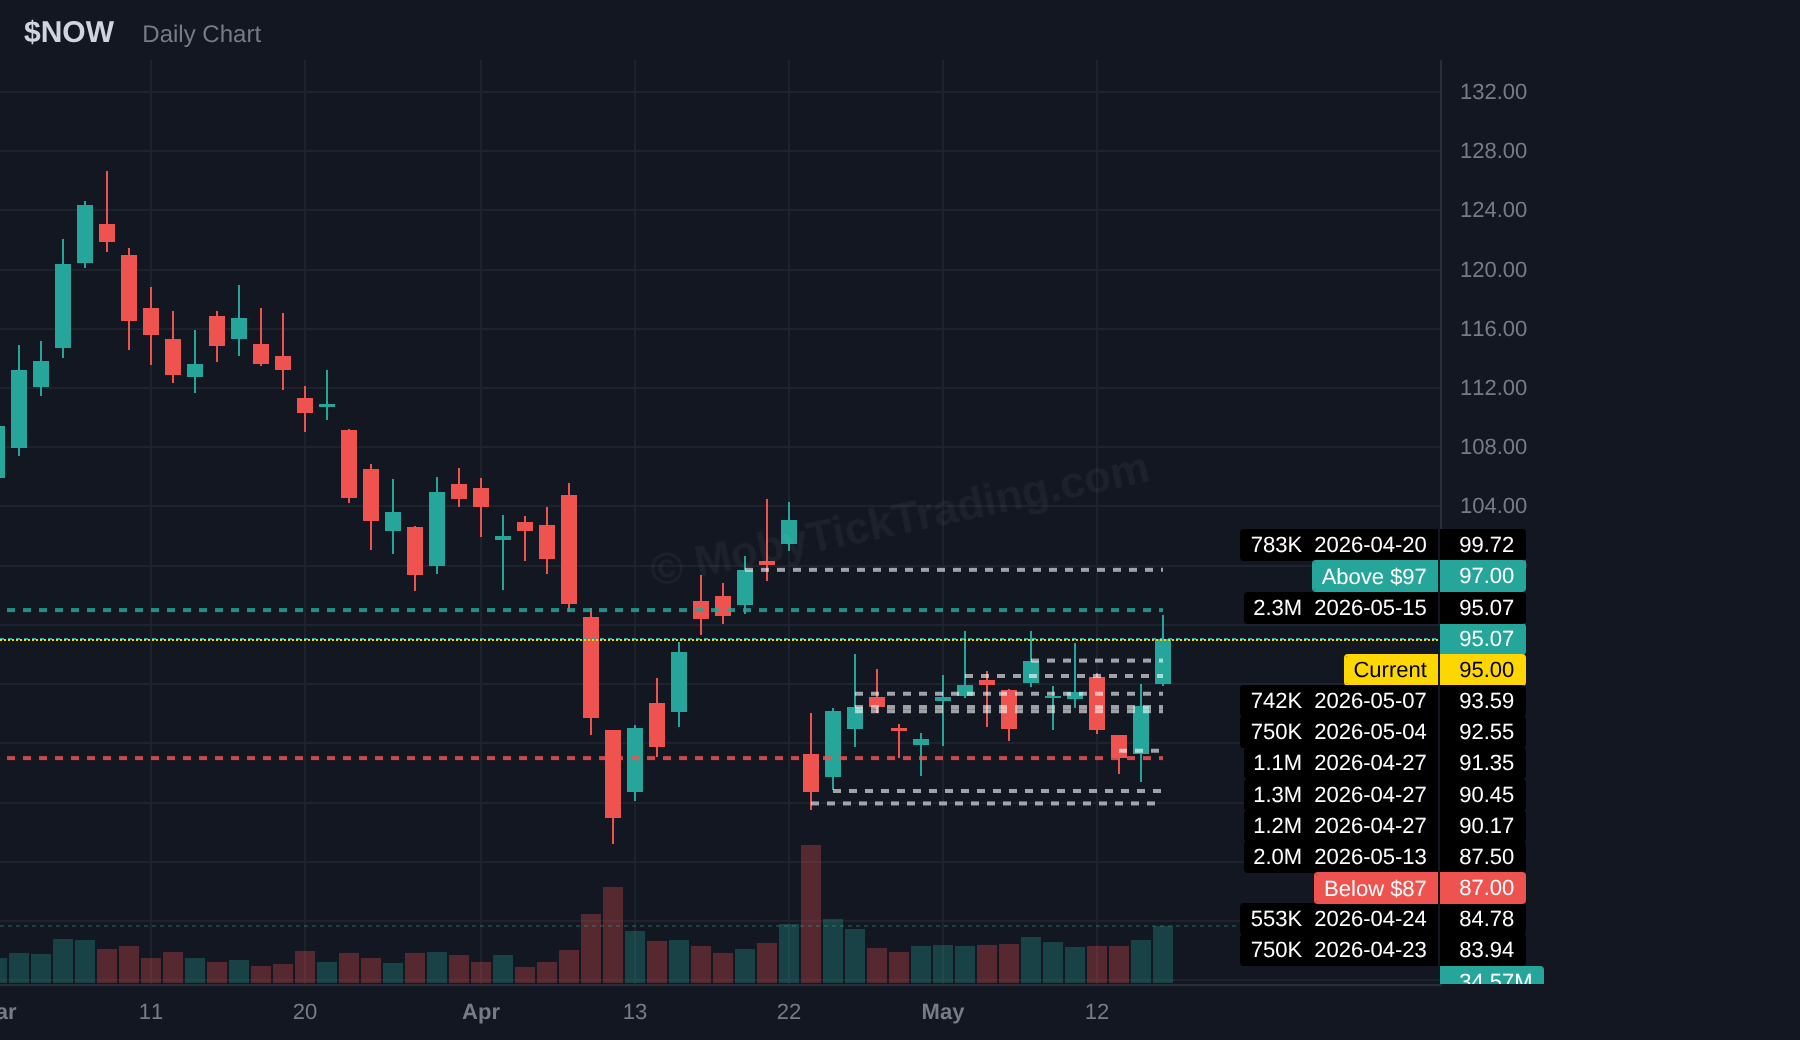
Above $97.00 — $99.00, $100.00, $102.50, $105.00, $107.50, $110.00
Below $87 — $85, $82.5, $80, $77.5, $75
$LRCX — Lam Research
Dark Pool Context: $1.2B total flow | 4.00M shares | 5 prints | Avg print $292.75
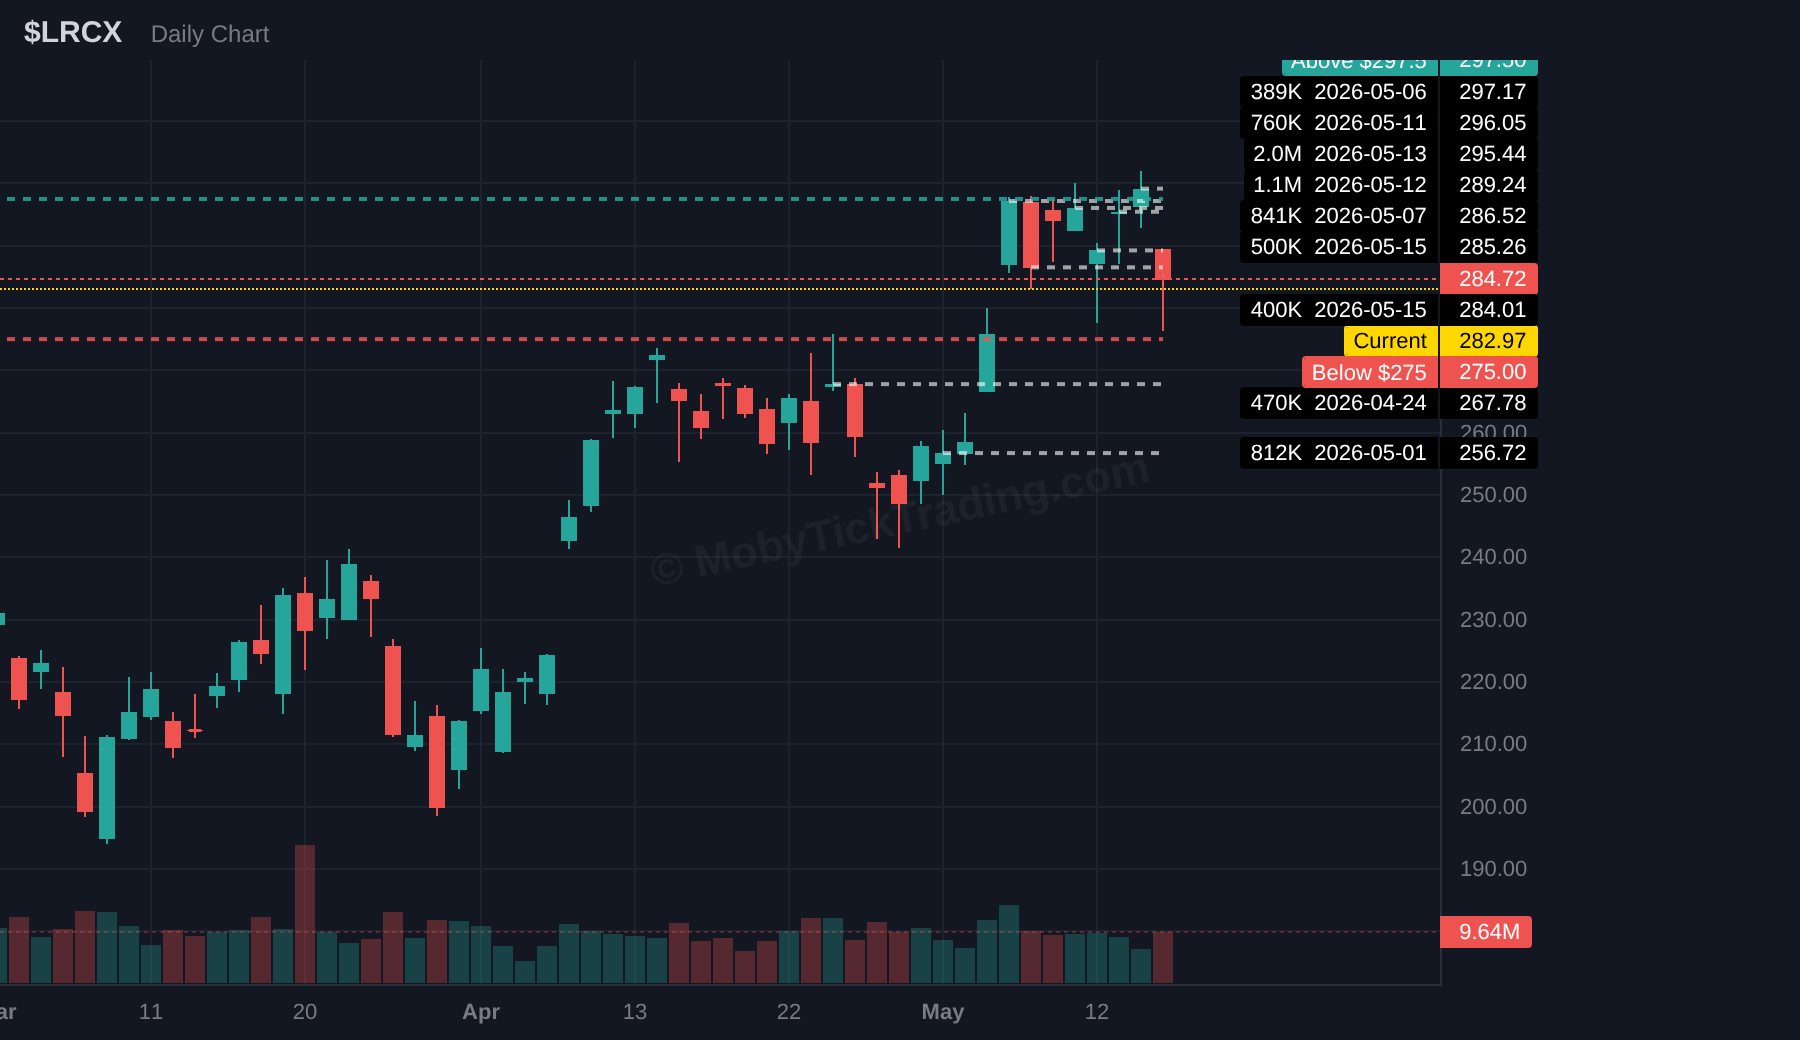
Above $297.50 — $300, $305, $310, $312.5, $320
Below $275 — $272.5, $270, $265, $260, $255
Educational
Educational: Position Building vs. Repositioning
• One useful way to read dark pool flow is to compare the last week of prints with the last month of prints in the same name.
• Large blocks often establish the core position. After that, institutions may adjust the position with smaller follow-up prints rather than repeating the same full-size block.
• In this issue, several names showed that pattern clearly: a very large week-level block was followed by smaller off-close prints at nearby prices. That can reflect repositioning, partial profit taking, or inventory management without requiring a fresh full-size entry every day.
• The key idea is simple: the biggest print may tell you where the position was built, while the smaller follow-up prints can show how that position is being managed.
Webinar Recap + Follow-Up
Webinar Recap: What It Means to Follow the Money
On April 10, Dave walked traders through the core idea behind MobyTick: institutions place large trades off-exchange, those prints often show up before the news, and retail traders can build cleaner plans by watching the money instead of reacting to headlines. The webinar focused on how dark pools work, why large block prints matter, and how to turn them into structured trade plans with clear bullish-above and bearish-below levels.
The follow-up video reviewed three webinar setups: ET, MARA, and IBIT. ET centered on 58 million shares within 28 cents, totaling roughly $1.1B, with a bullish-above trigger at 19.40 and a later entry around 19.53 that reached the 20 area for about $0.47 per share. MARA used a bullish-above 10.00 setup and later moved from roughly 10.36 to 13.00, about $2.64 per share. IBIT used a bullish-above 41.25 setup and later moved from about 41.59 to 45.00, about $3.41 per share.
Using 500 shares for each example in the follow-up recap, the three sample trades added up to about $3,440 in profit on paper. That follow-up matters because it shows the framework as a process: find the prints, define the levels, wait for confirmation, and manage the trade with targets instead of guessing.
Watch the full webinar: https://www.youtube.com/watch?v=_G1LvABpZdA
Watch the follow-up recap: https://www.youtube.com/watch?v=n0j8hIJkxsc
If you want the full walk-through on how Dave reads these setups, these two videos are the best starting point.
Watch the full webinar
Watch the follow-up recap
Stop Guessing. Start Tracking.
See where the smart money is moving before it shows up in the price.
Focus keyword: weekly dark pool report
SEO keywords: weekly dark pool report, dark pool newsletter, whale playbook weekly, institutional flow, block trade analysis, smart money activity, SPY dark pool, QQQ dark pool, weekly trade setups, dark pool recap
Category: Newsletter