
Market Overview
The finished May 25–29 week closed with fairly tight index movement but much wider single-name dispersion underneath the surface. SPY finished at $756.48 after a $748.22 to $758.08 range, QQQ closed at $738.31 after a $724.16 to $741.63 range, and IWM closed at $290.43 after trading between $287.74 and $292.74.
Sector rotation was mixed rather than one-dimensional. Technology led the price tape with XLK up 2.23%, while Financials added 0.60%. Most other sectors finished slightly lower on the week: Energy -1.16%, Health Care -0.93%, Consumer Discretionary -0.97%, Communication Services -0.84%, and Consumer Staples -1.80%. That is a useful reminder that the strongest institutional concentration did not always align with the best visible weekly percentage move.
The result was a tape where headline indices looked controlled, but individual names like Dell, IBM, Ford, Micron, Intel, and the quantum complex expanded far more than the broad-market averages.
Where the Dark Pool Money Moved
Broad-market ETF flow remained extremely heavy. IVV, SPY, VOO, QQQ, and IWM combined for about $32.15B in dark pool activity. IVV led with roughly $14.03B, followed by SPY at $6.46B, VOO at $5.93B, QQQ at $5.15B, and IWM at $580.9M.
Sector SPDR flow was broad rather than narrowly concentrated. XLK led with about $930M, followed by XLE at $609M, XLV at $583M, and XLF at $563M. That mix points to participation across technology, energy, health care, and financials rather than a one-theme-only market.
The cleanest rotation clue is that Energy attracted heavy dark-pool flow even while XLE finished lower on the week. Meanwhile Consumer Staples drew the lightest sector flow, which fits a market still leaning toward growth and cyclical participation instead of classic defensive hiding.
Scorecard — May 25–29 Newsletter Callouts vs May 25–29 Weekly Candle
This scorecard compares the levels published for the May 25–29 newsletter against the actual May 25–29 weekly candle. This is the completed week review that feeds this new June 1–4 setup sheet.
Summary: 13 of 13 callouts triggered at least one side. Standouts were Ford clearing the full bullish ladder, IONQ extending into the upper targets, and RGTI / GLW / GOOGL showing why confirmation matters when both sides activate.
Bullish Setups — Above Trigger
Bearish Setups — Below Trigger
Individual Ticker Deep Dives
$SPY — SPDR S&P 500 ETF Trust
Dark pool flow: $28.55B across 38.60M shares and 50 aggregated print levels. Average reported print price: $739.70. Print prices are execution prices; they are not being represented as closing prices.
Volume context: reported dark pool shares equaled approximately 0.80× the 30-day average daily share volume (48.25M ADV).
Last week candle: Open $750.01 | High $758.08 | Low $748.22 | Close $756.48 | Week move +0.86%.
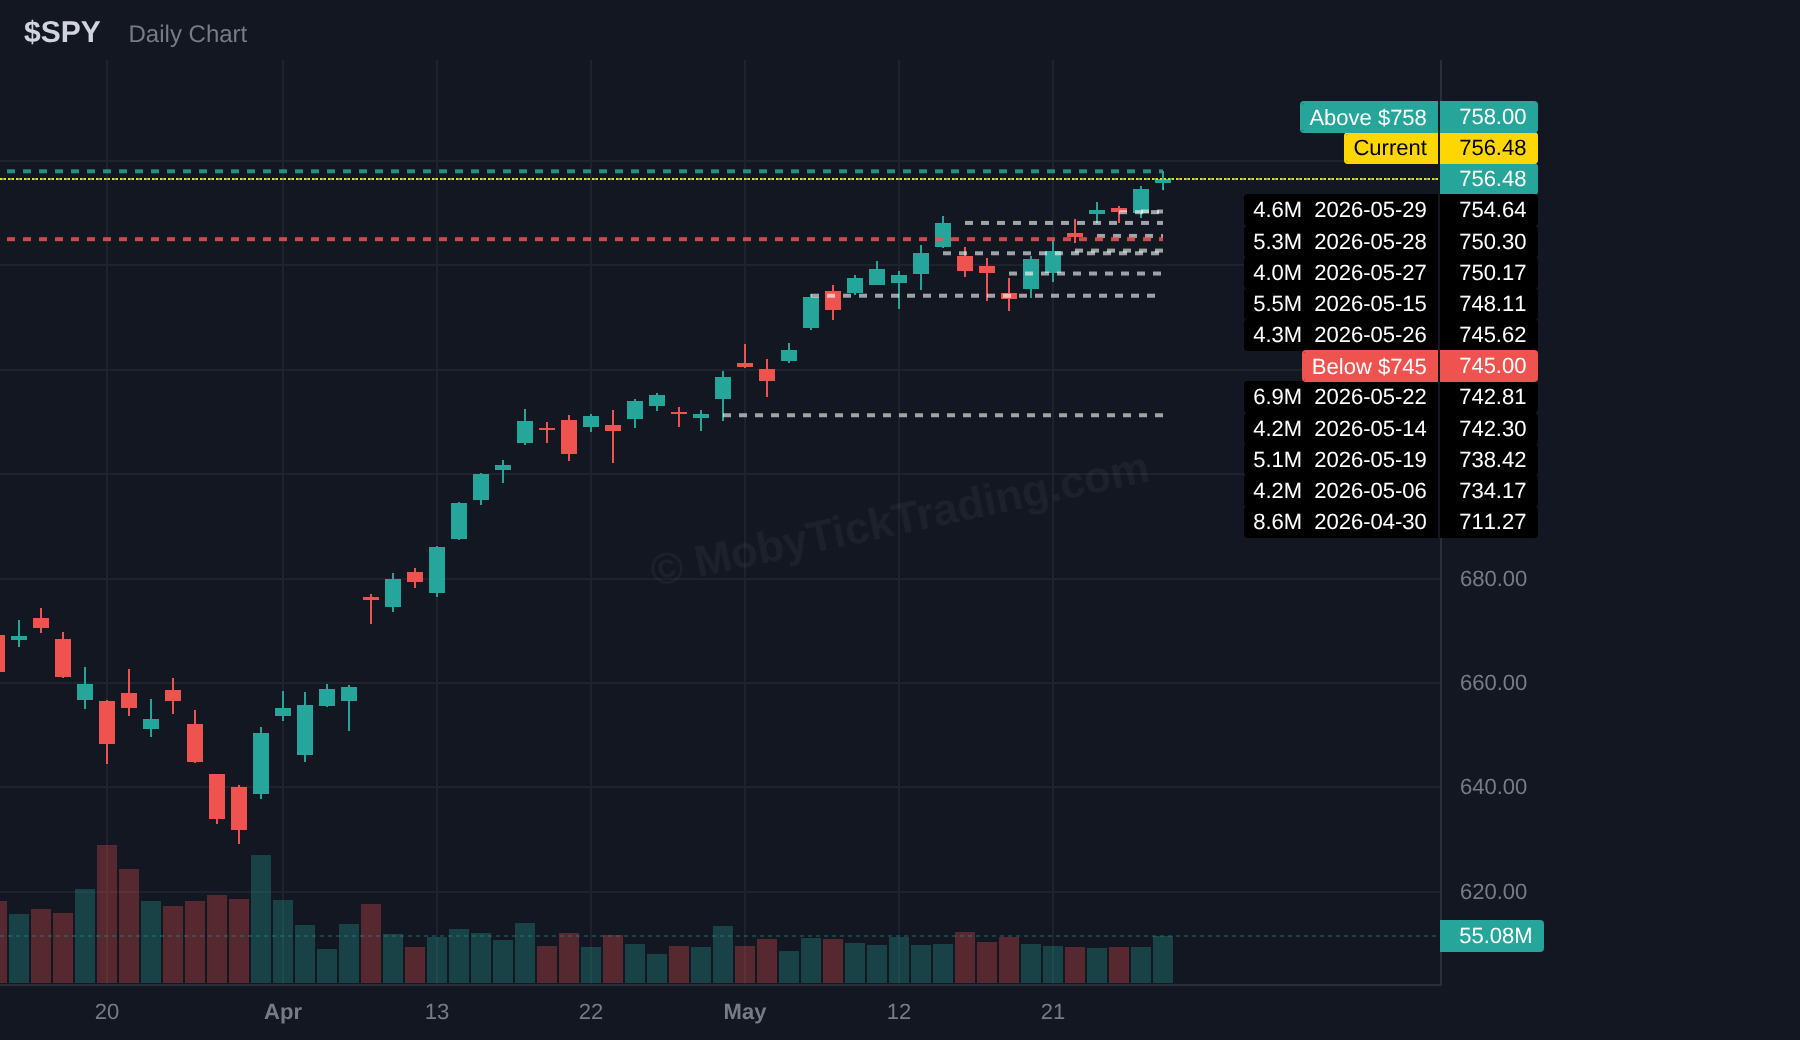
Bullish above $758.00 | Targets: $760.00, $762.50, $765.00, $770.00
Bearish below $745.00 | Targets: $742.50, $740.00, $738.00, $736.00, $732.50, $730.00
$QQQ — Invesco QQQ Trust
Dark pool flow: $17.65B across 24.87M shares and 85 aggregated print levels. Average reported print price: $709.59. Print prices are execution prices; they are not being represented as closing prices.
Volume context: reported dark pool shares equaled approximately 0.63× the 30-day average daily share volume (39.33M ADV).
Last week candle: Open $725.96 | High $741.63 | Low $724.16 | Close $738.31 | Week move +1.70%.
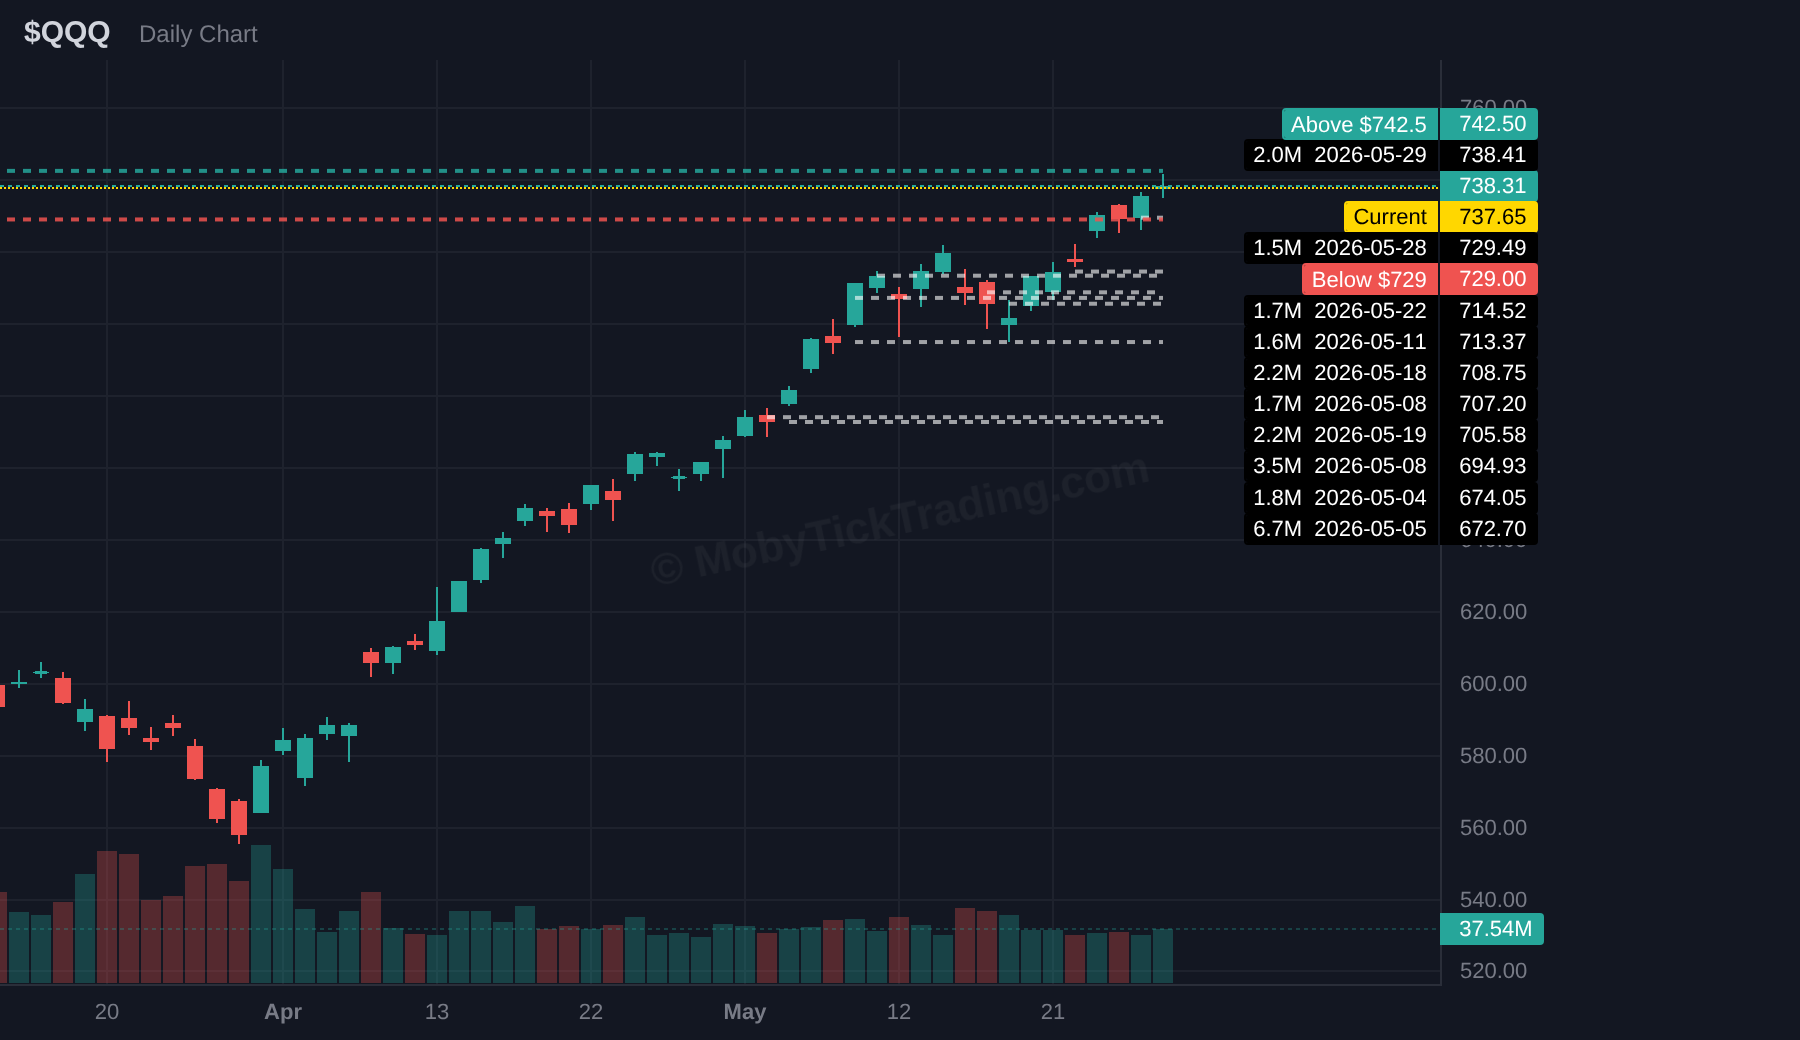
Bullish above $742.50 | Targets: $745.00, $747.50, $750.00, $755.00, $760.00
Bearish below $729.00 | Targets: $727.50, $725.00, $720.00, $715.00, $712.50, $710.00
$IWM — iShares Russell 2000 ETF
Dark pool flow: $5.63B across 20.25M shares and 78 aggregated print levels. Average reported print price: $278.00. Print prices are execution prices; they are not being represented as closing prices.
Volume context: reported dark pool shares equaled approximately 0.76× the 30-day average daily share volume (26.82M ADV).
Last week candle: Open $288.39 | High $292.74 | Low $287.74 | Close $290.43 | Week move +0.71%.
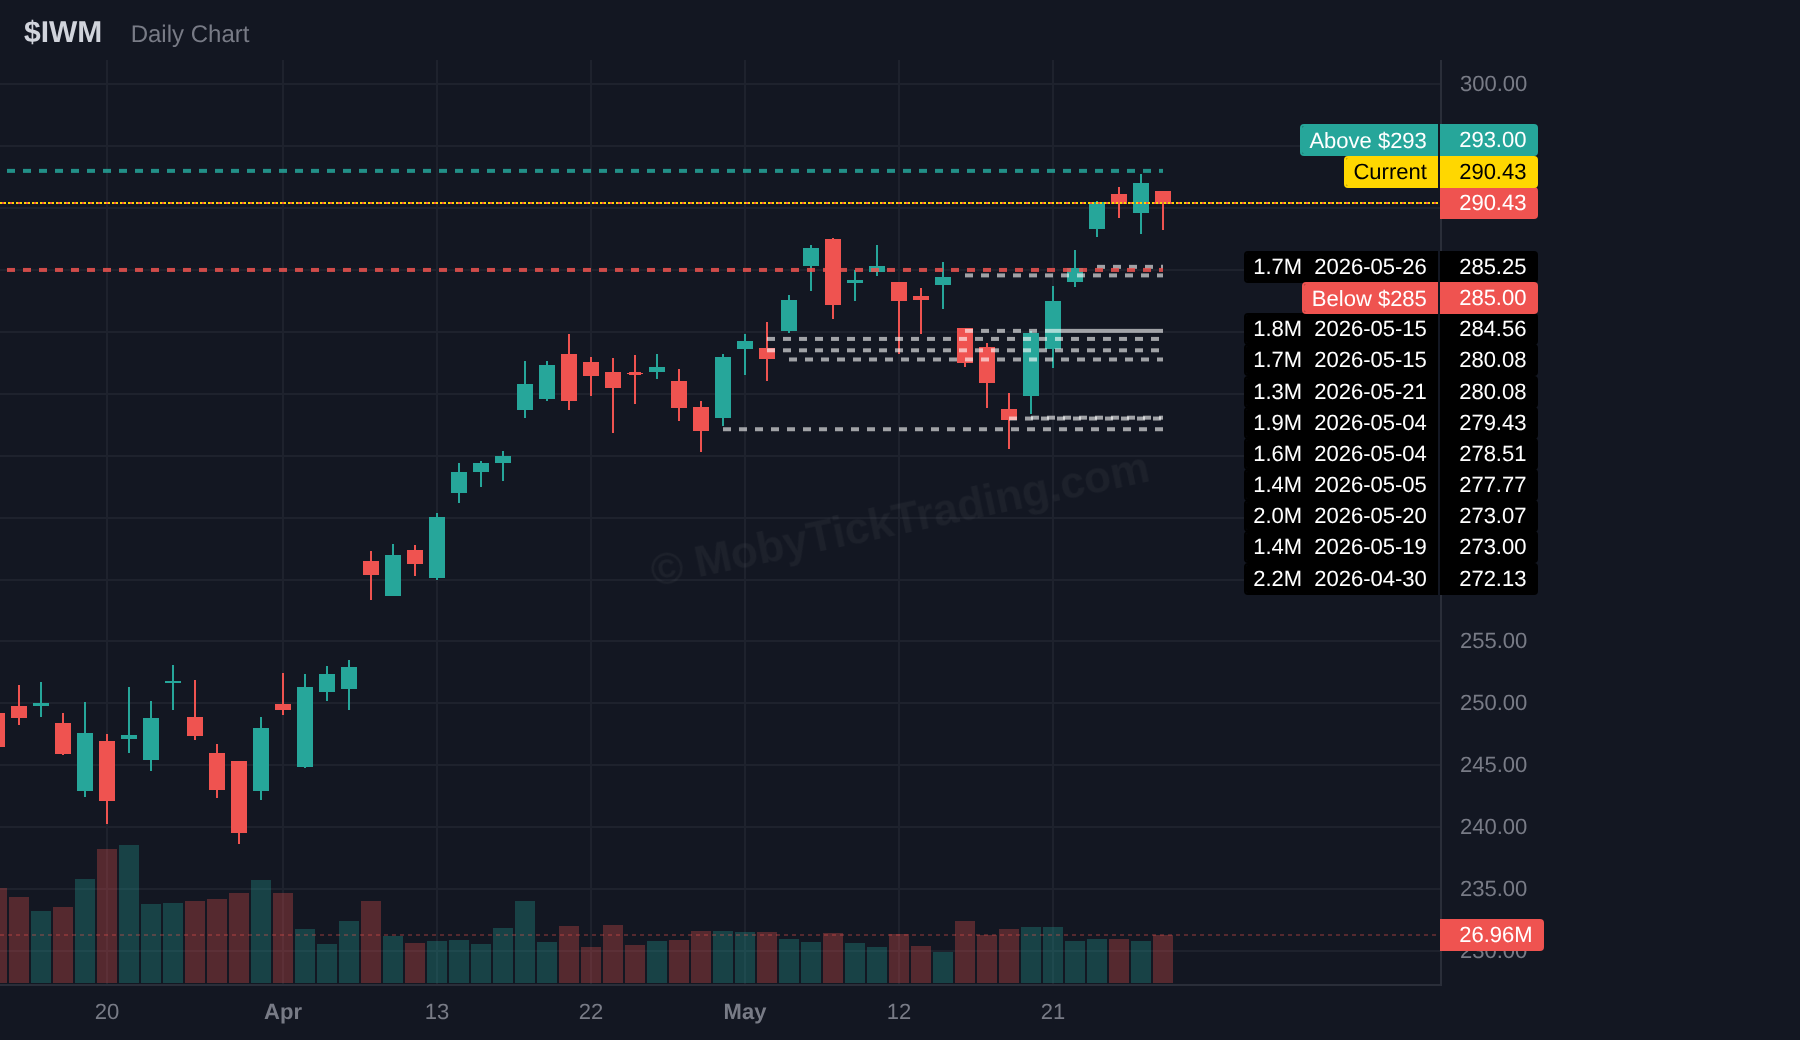
Bullish above $293.00 | Targets: $295.00, $297.50, $300.00, $302.50, $305.00
Bearish below $285.00 | Targets: $282.50, $280.00, $275.00
$NVDA — NVIDIA
Dark pool flow: $10.88B across 49.59M shares and 63 aggregated print levels. Average reported print price: $219.49. Print prices are execution prices; they are not being represented as closing prices.
Volume context: reported dark pool shares equaled approximately 0.31× the 30-day average daily share volume (162.13M ADV).
Last week candle: Open $216.54 | High $218.18 | Low $208.78 | Close $211.14 | Week move -2.49%.
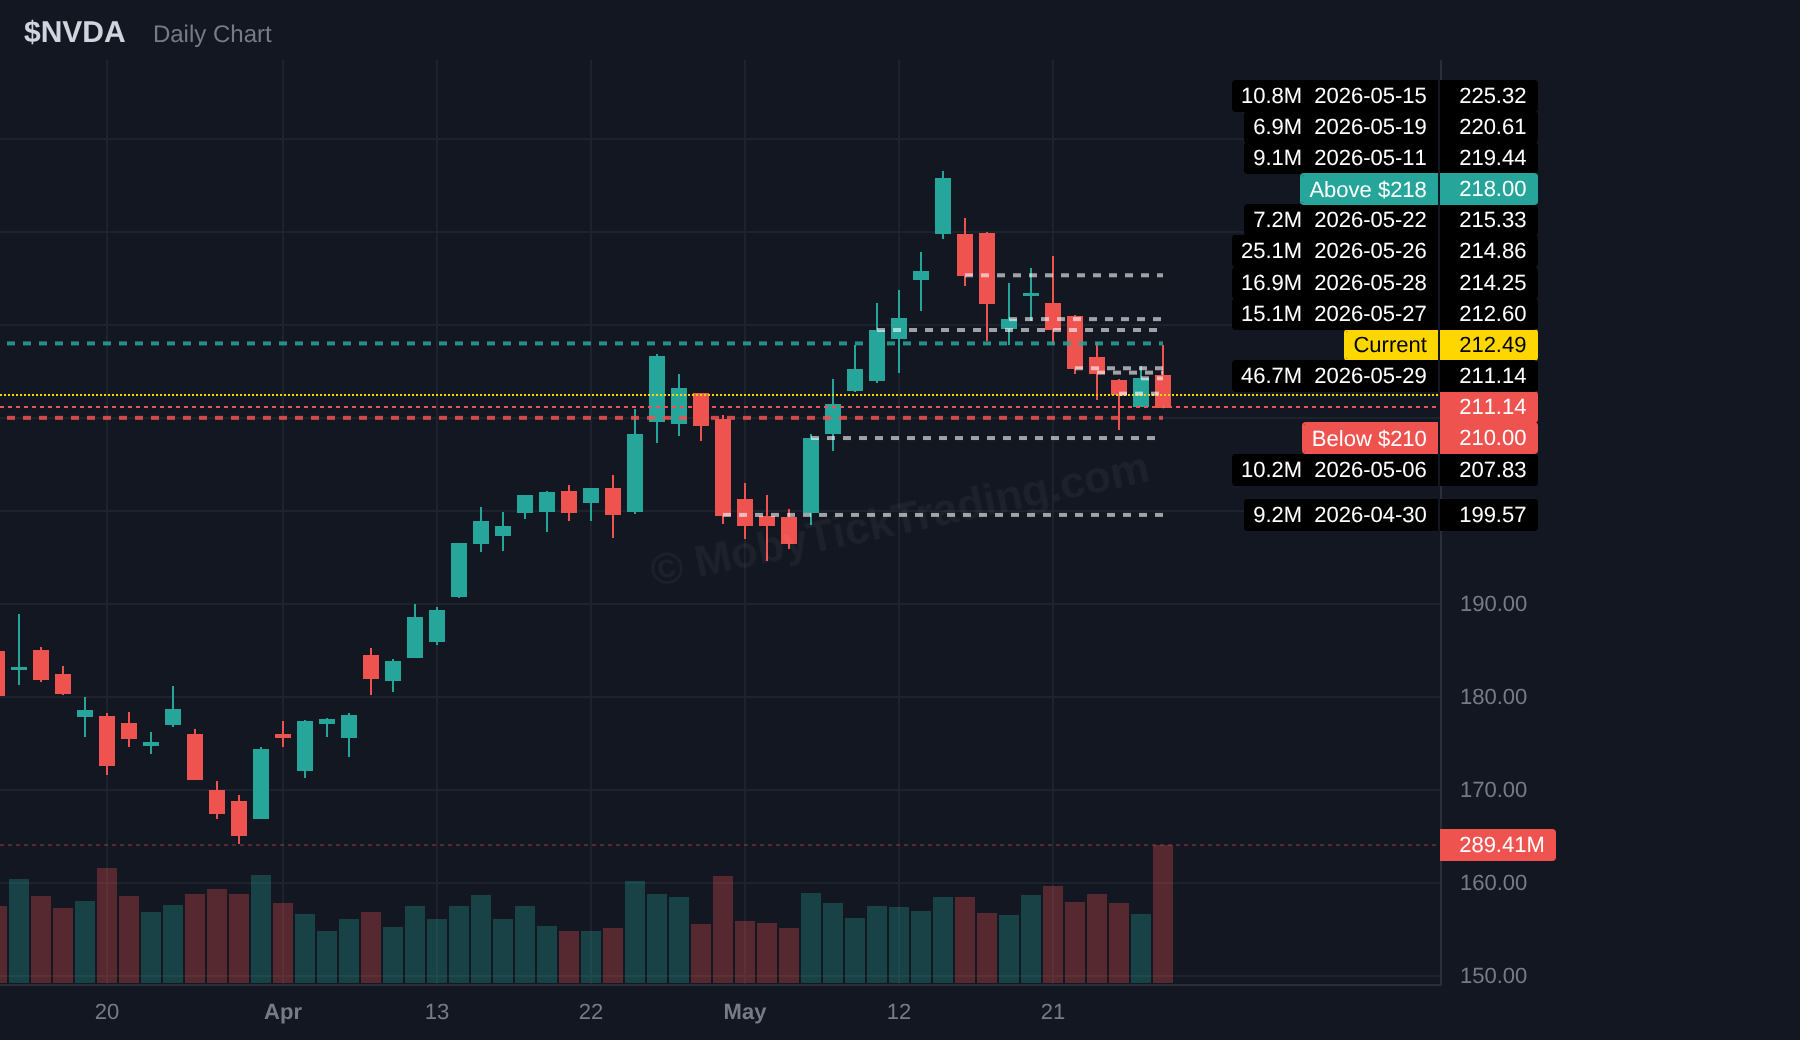
Bullish above $218.00 | Targets: $220.00, $222.50, $225.00, $227.50, $230.00, $235.00
Bearish below $210.00 | Targets: $208.00, $205.00, $202.50, $200.00
$AAPL — Apple
Dark pool flow: $10.89B across 36.01M shares and 38 aggregated print levels. Average reported print price: $302.43. Print prices are execution prices; they are not being represented as closing prices.
Volume context: reported dark pool shares equaled approximately 0.75× the 30-day average daily share volume (48.29M ADV).
Last week candle: Open $309.56 | High $315.00 | Low $307.67 | Close $312.06 | Week move +0.81%.
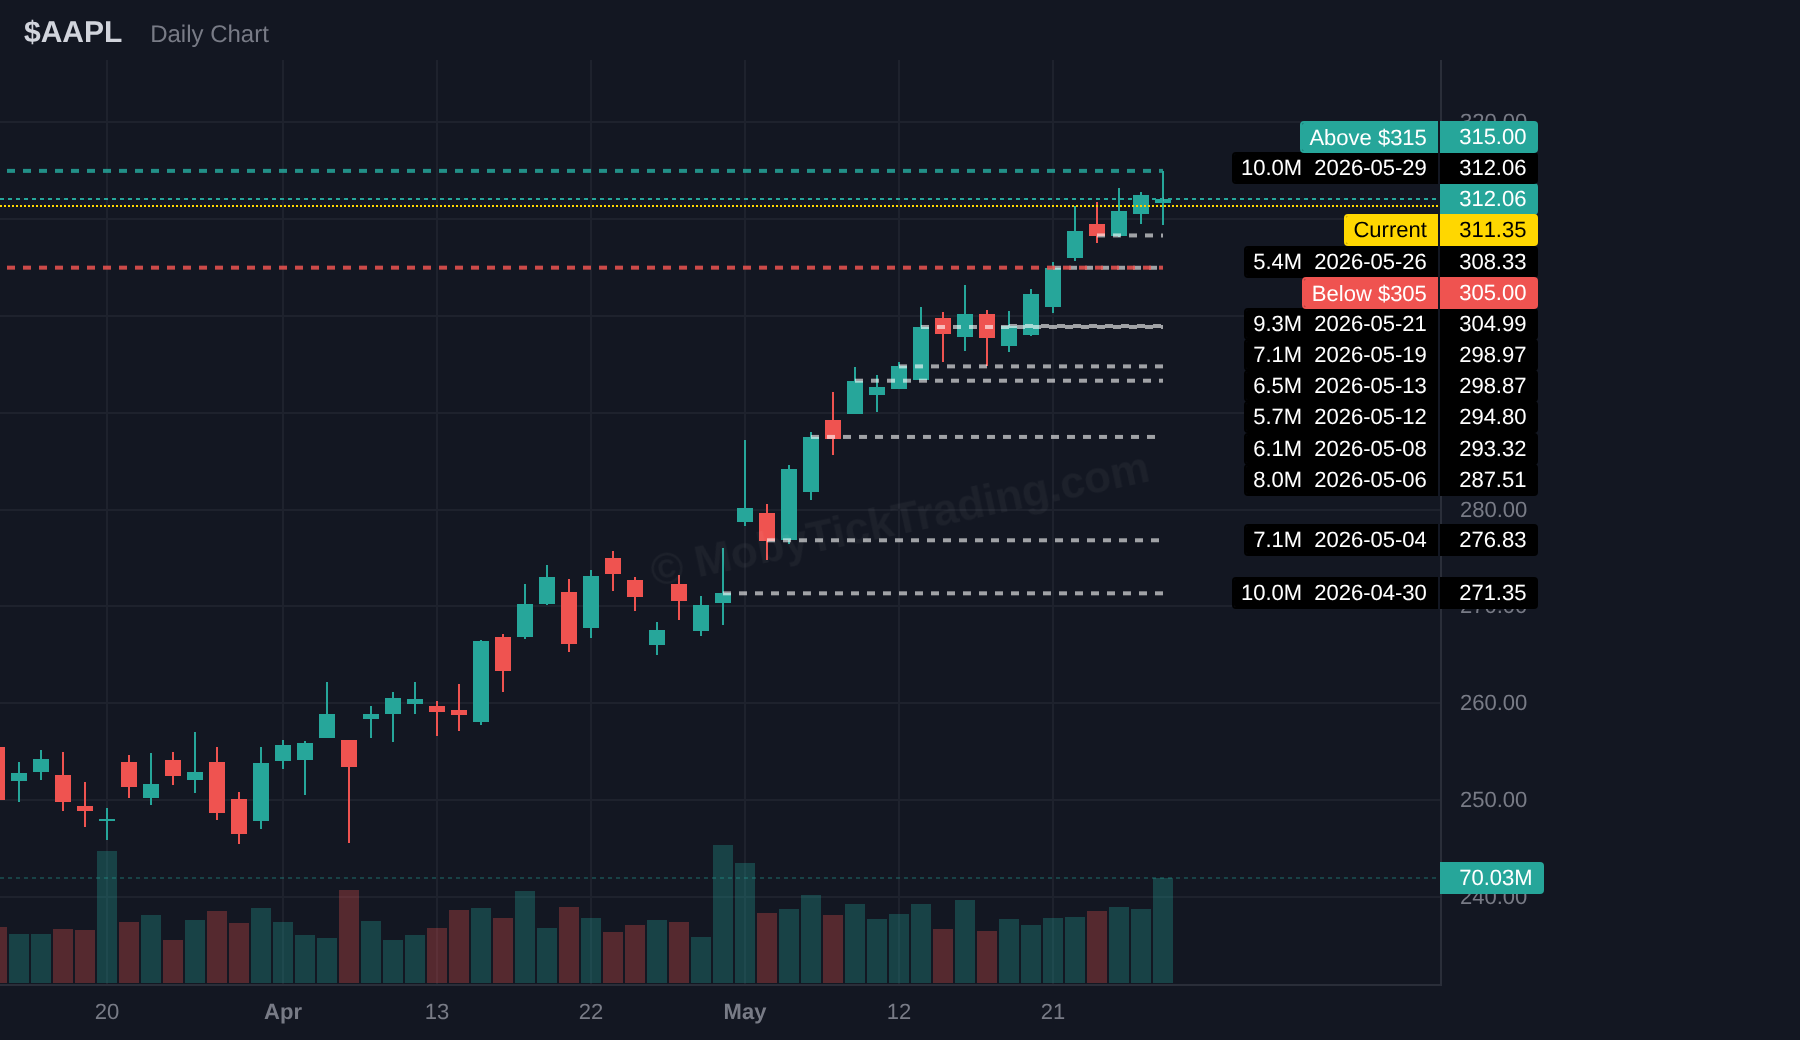
Bullish above $315.00 | Targets: $317.50, $320.00, $325.00, $330.00, $335.00, $340.00
Bearish below $305.00 | Targets: $302.50, $300.00, $297.50, $295.00, $292.50, $290.00
$MSFT — Microsoft
Dark pool flow: $5.16B across 11.88M shares and 8 aggregated print levels. Average reported print price: $433.98. Print prices are execution prices; they are not being represented as closing prices.
Volume context: reported dark pool shares equaled approximately 0.33× the 30-day average daily share volume (35.76M ADV).
Last week candle: Open $416.43 | High $450.33 | Low $409.58 | Close $450.24 | Week move +8.12%.
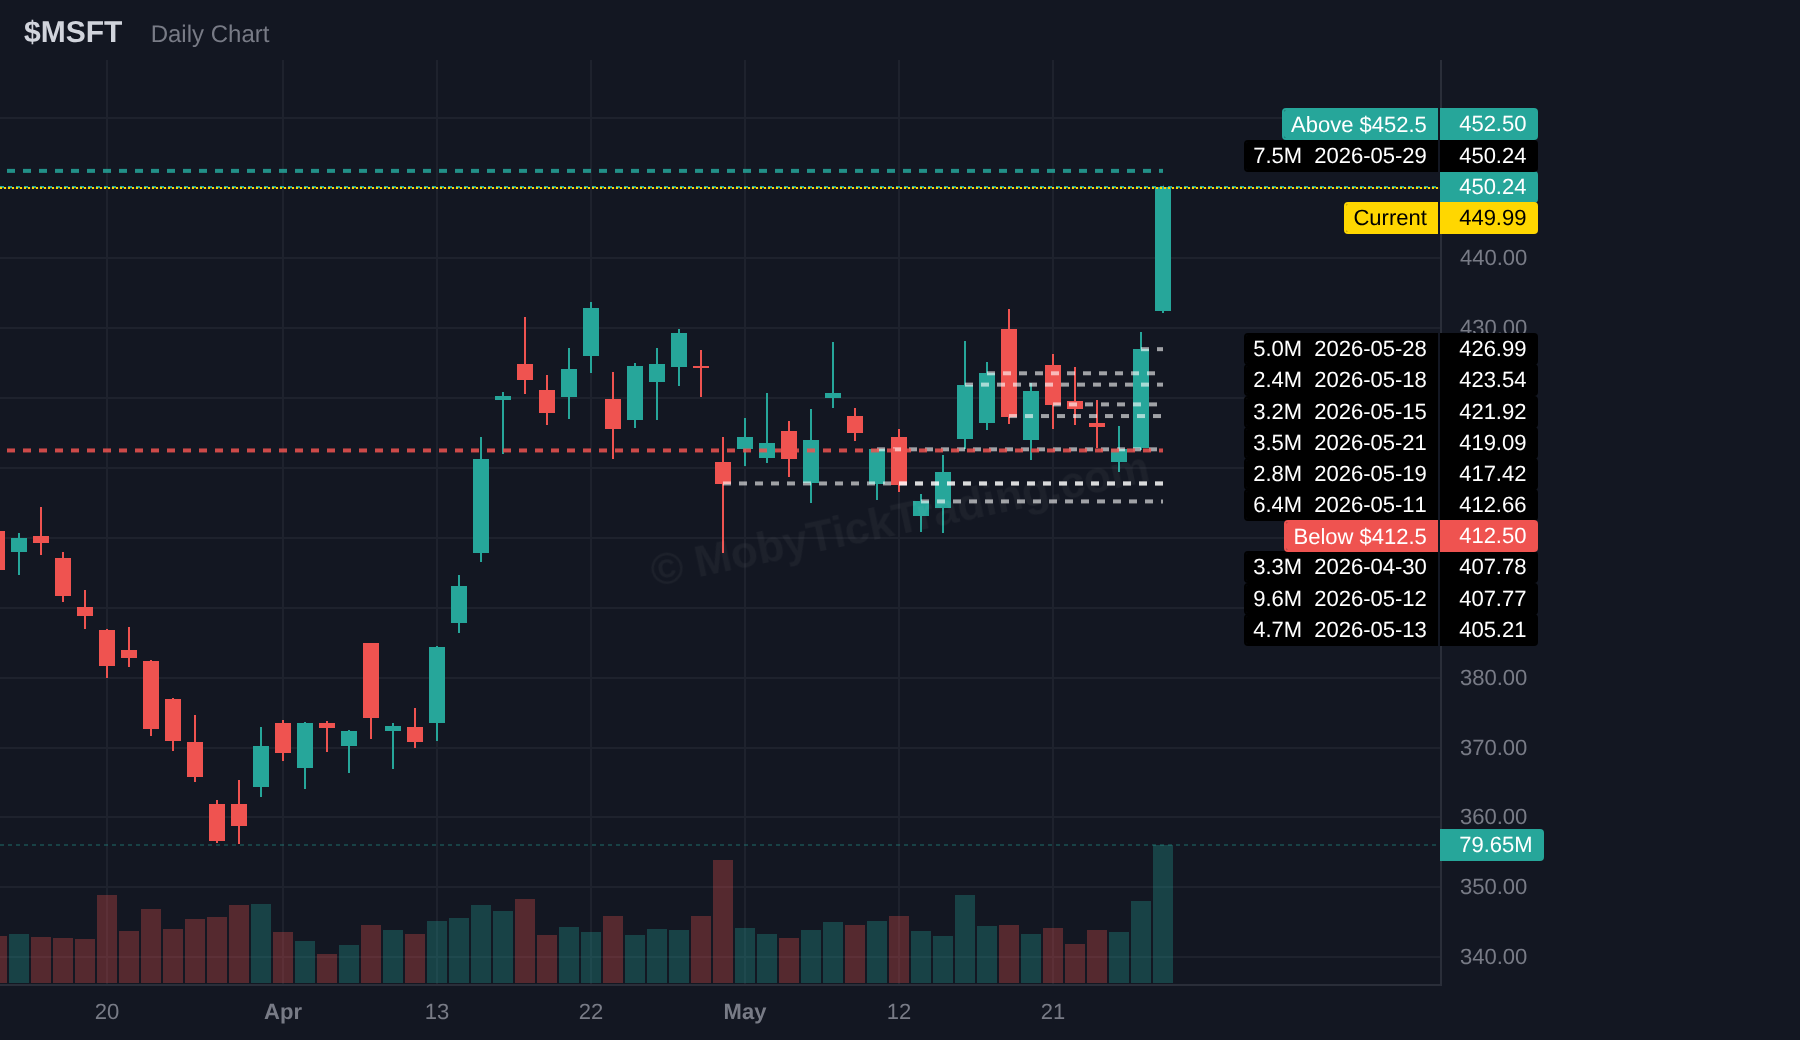
Bullish above $452.50 | Targets: $455.00, $457.50, $460.00, $465.00, $470.00, $475.00, $480.00
Bearish below $412.50 | Targets: $410.00, $407.50, $405.00, $400.00, $390.00, $380.00
$DELL — Dell Technologies
Dark pool flow: $444.1M across 1.07M shares and 2 aggregated print levels. Average reported print price: $416.10. Print prices are execution prices; they are not being represented as closing prices.
Volume context: reported dark pool shares equaled approximately 0.13× the 30-day average daily share volume (8.32M ADV).
Last week candle: Open $300.25 | High $429.15 | Low $298.57 | Close $420.91 | Week move +40.19%.
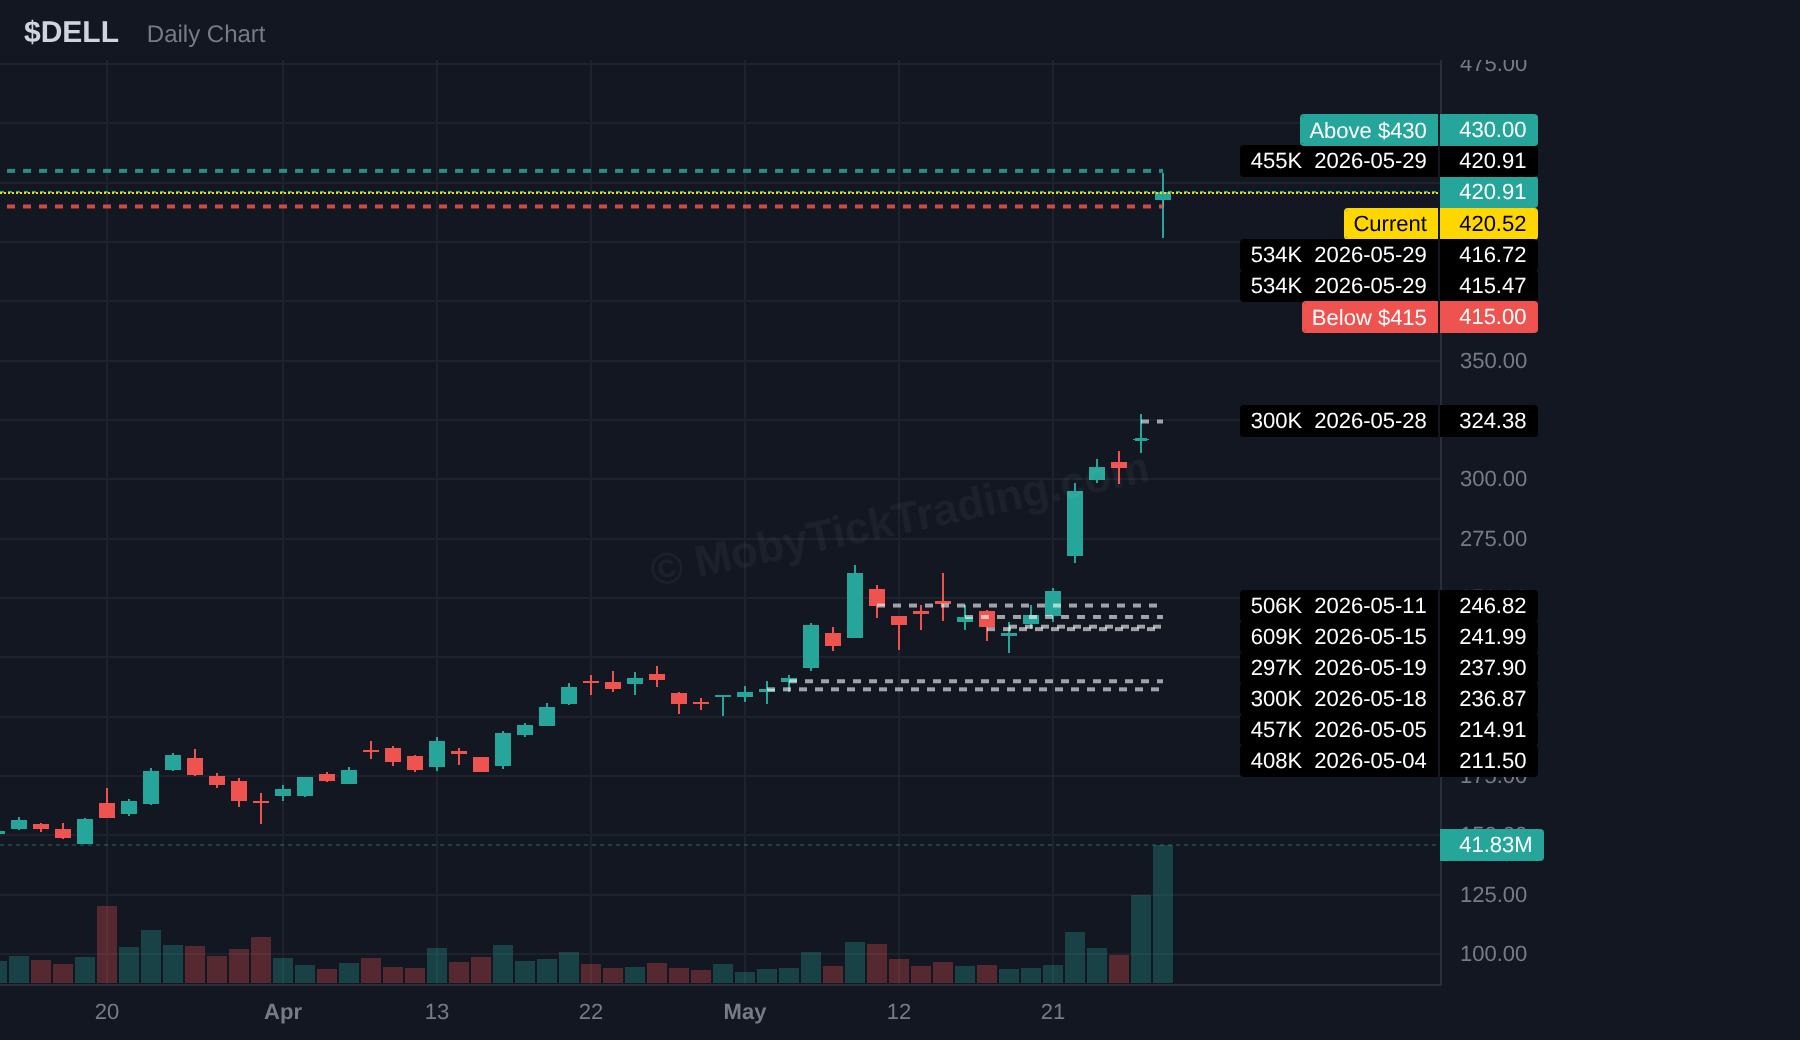
Bullish above $430.00 | Targets: $435.00, $440.00, $445.00, $450.00, $460.00
Bearish below $415.00 | Targets: $410.00, $405.00, $400.00, $395.00, $390.00, $380.00, $360.00
$IBM — IBM
Dark pool flow: $180.9M across 0.71M shares and 1 aggregated print levels. Average reported print price: $255.20. Print prices are execution prices; they are not being represented as closing prices.
Volume context: reported dark pool shares equaled approximately 0.08× the 30-day average daily share volume (9.04M ADV).
Last week candle: Open $254.55 | High $301.00 | Low $245.45 | Close $297.80 | Week move +16.99%.
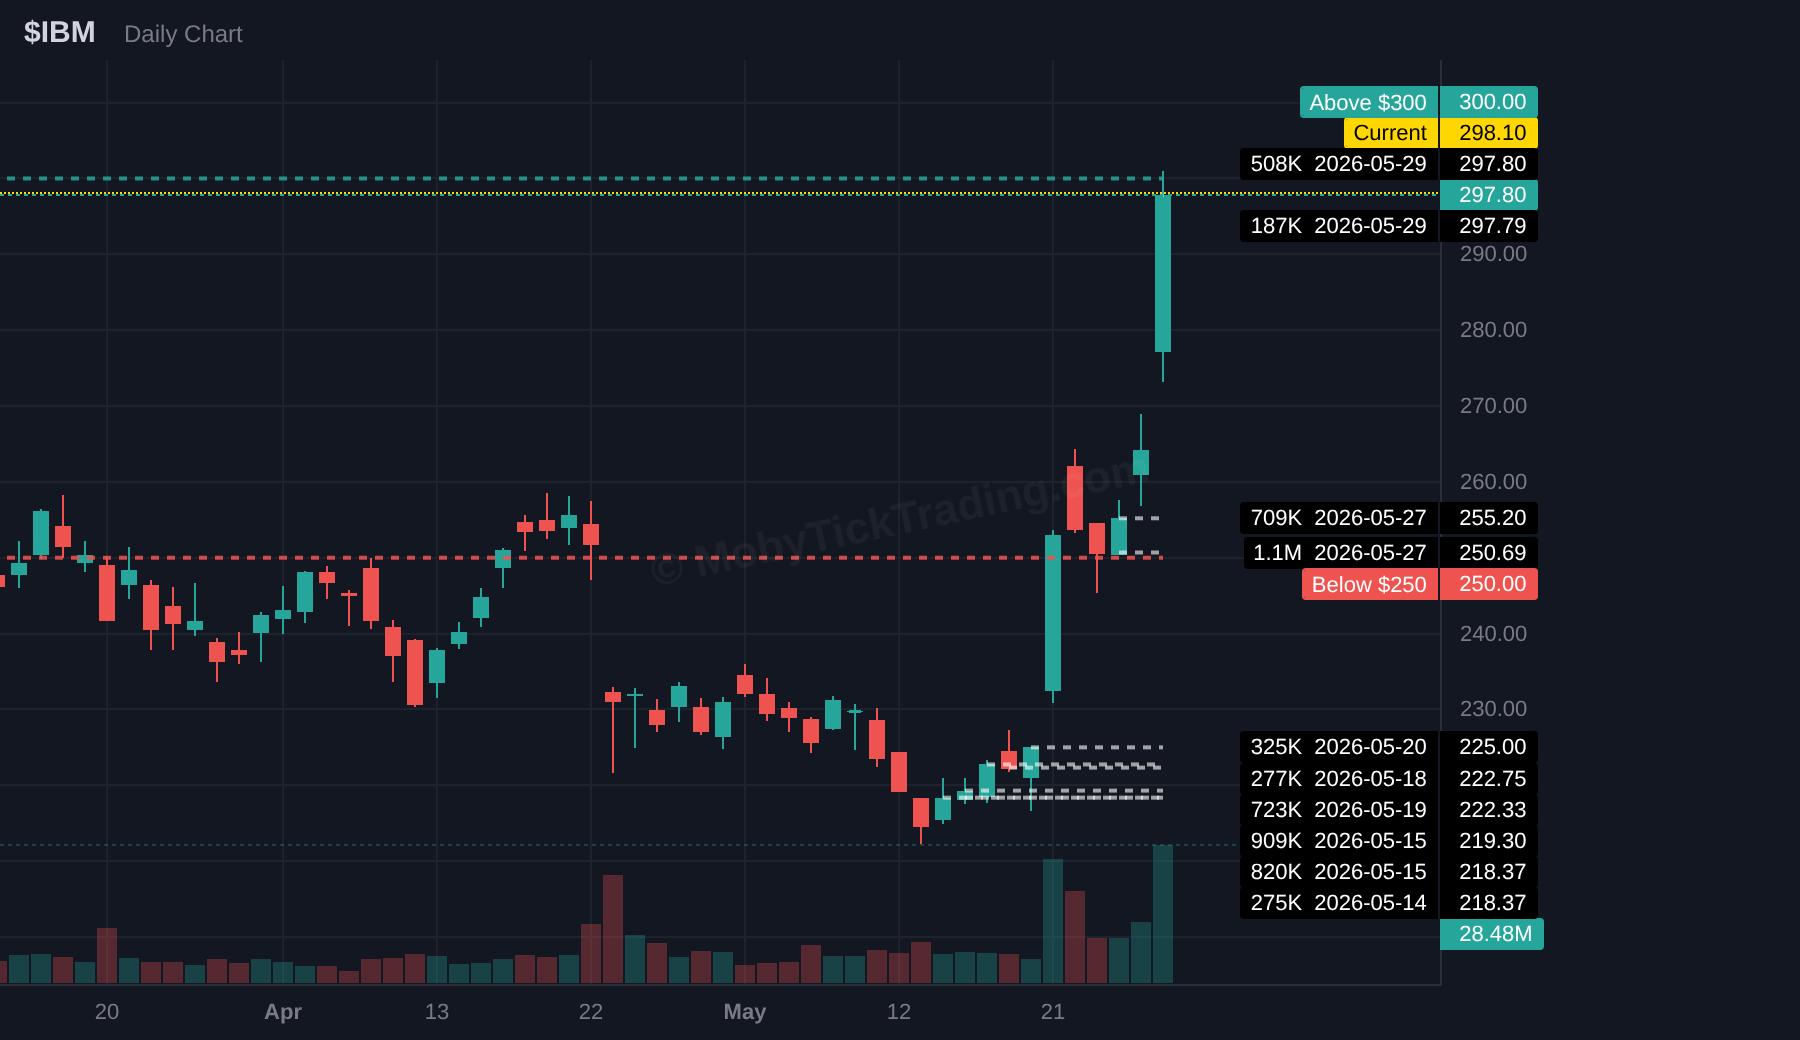
Bullish above $300.00 | Targets: $302.50, $305.00, $310.00, $315.00, $320.00
Bearish below $250.00 | Targets: $247.50, $245.00, $240.00, $235.00, $230.00, $227.50
$F — Ford Motor
Dark pool flow: $373.0M across 27.22M shares and 103 aggregated print levels. Average reported print price: $13.71. Print prices are execution prices; they are not being represented as closing prices.
Volume context: reported dark pool shares equaled approximately 0.40× the 30-day average daily share volume (68.30M ADV).
Last week candle: Open $14.78 | High $17.78 | Low $14.78 | Close $17.44 | Week move +18.00%.
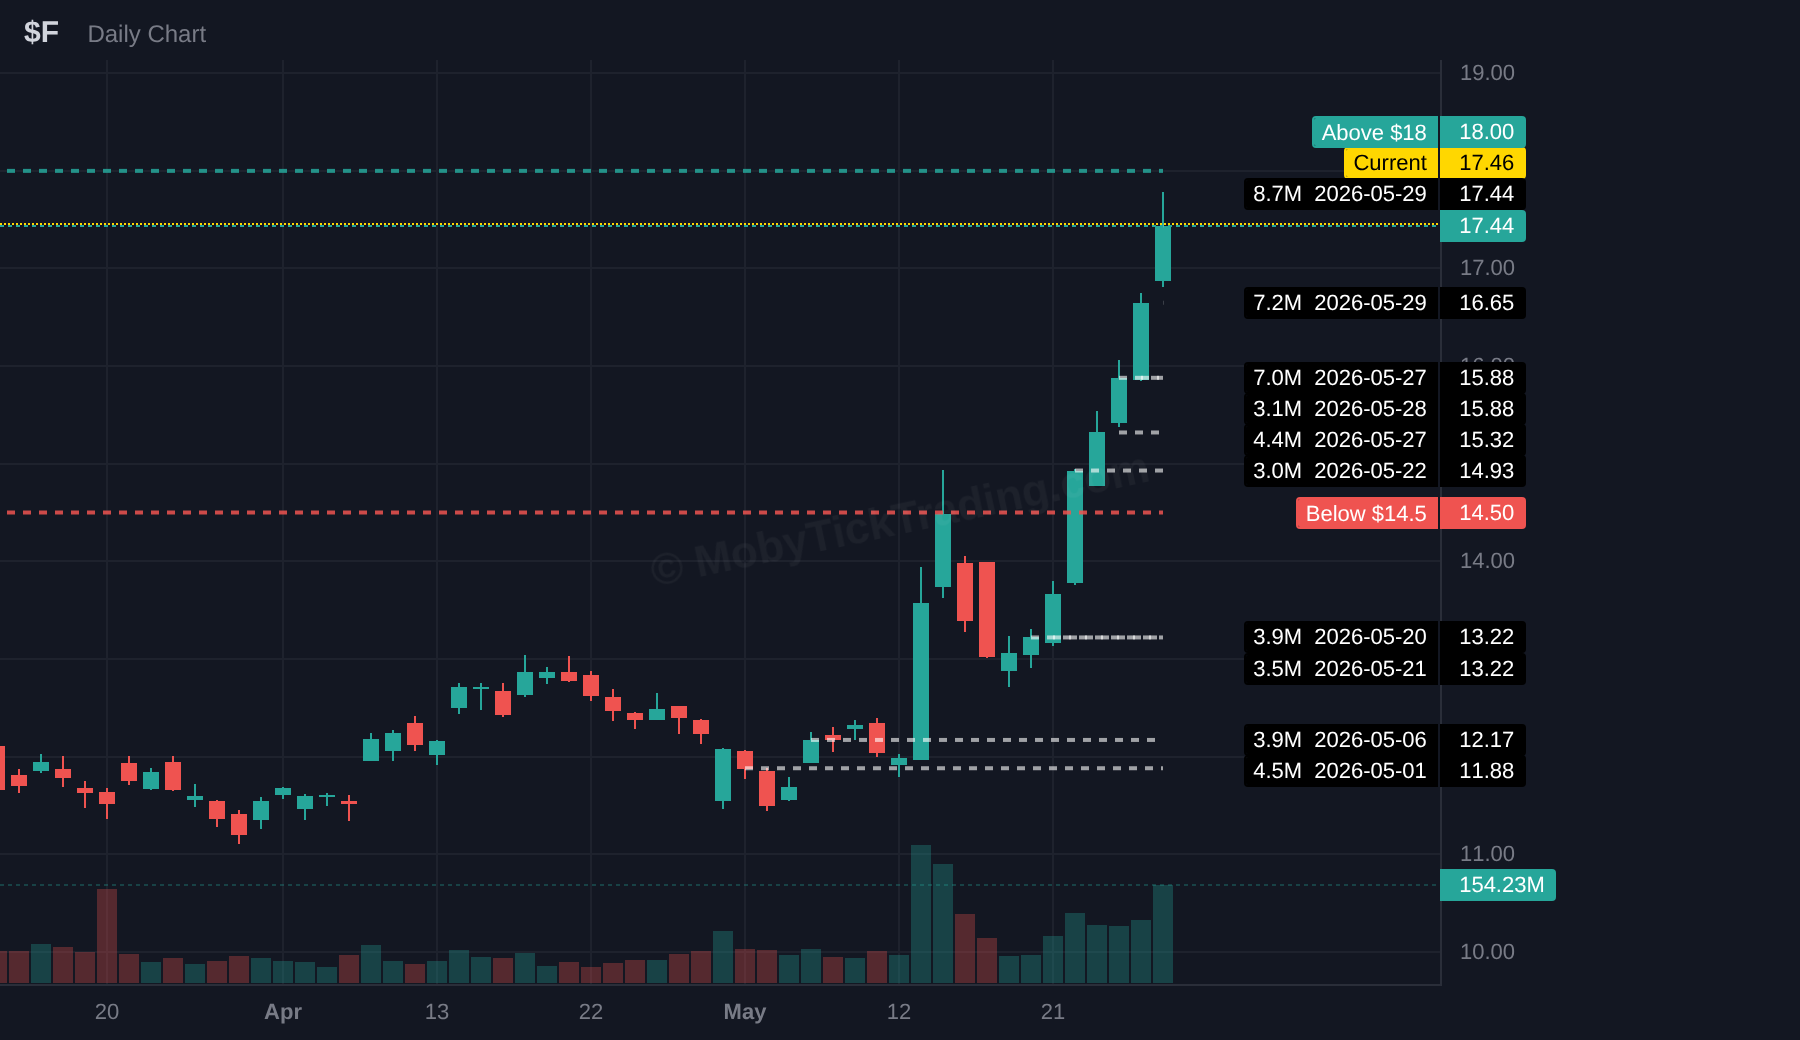
Bullish above $18.00 | Targets: $19.00, $20.00, $21.25, $22.50, $25.00
Bearish below $14.50 | Targets: $14.00, $13.50, $13.00
$INTC — Intel
Dark pool flow: $3.43B across 29.62M shares and 7 aggregated print levels. Average reported print price: $115.68. Print prices are execution prices; they are not being represented as closing prices.
Volume context: reported dark pool shares equaled approximately 0.20× the 30-day average daily share volume (146.59M ADV).
Last week candle: Open $122.09 | High $126.64 | Low $113.54 | Close $114.68 | Week move -6.07%.
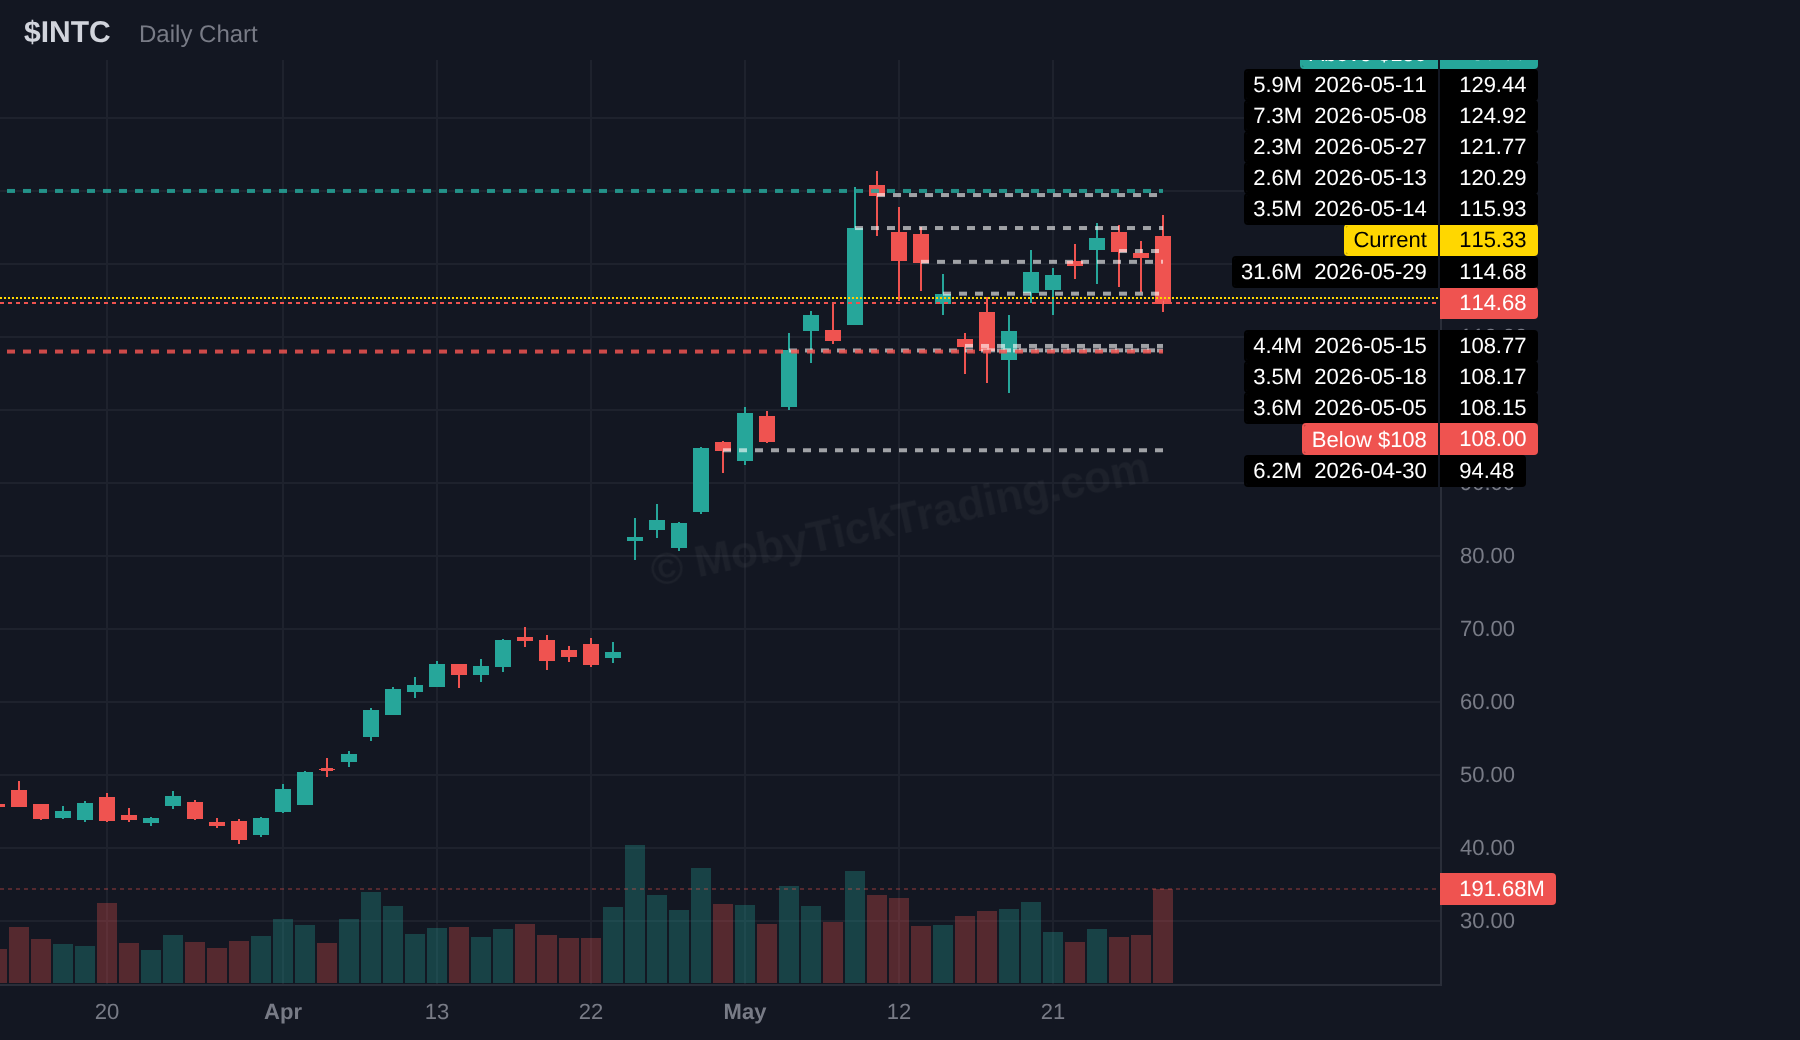
Bullish above $130.00 | Targets: $132.50, $135.00, $137.50, $140.00, $145.00, $150.00
Bearish below $108.00 | Targets: $105.00, $102.50, $100.00, $97.50, $95.00, $93.75
$MU — Micron Technology
Dark pool flow: $2.85B across 2.95M shares and 5 aggregated print levels. Average reported print price: $965.50. Print prices are execution prices; they are not being represented as closing prices.
Volume context: reported dark pool shares equaled approximately 0.06× the 30-day average daily share volume (49.63M ADV).
Last week candle: Open $820.50 | High $981.00 | Low $820.29 | Close $971.00 | Week move +18.34%.
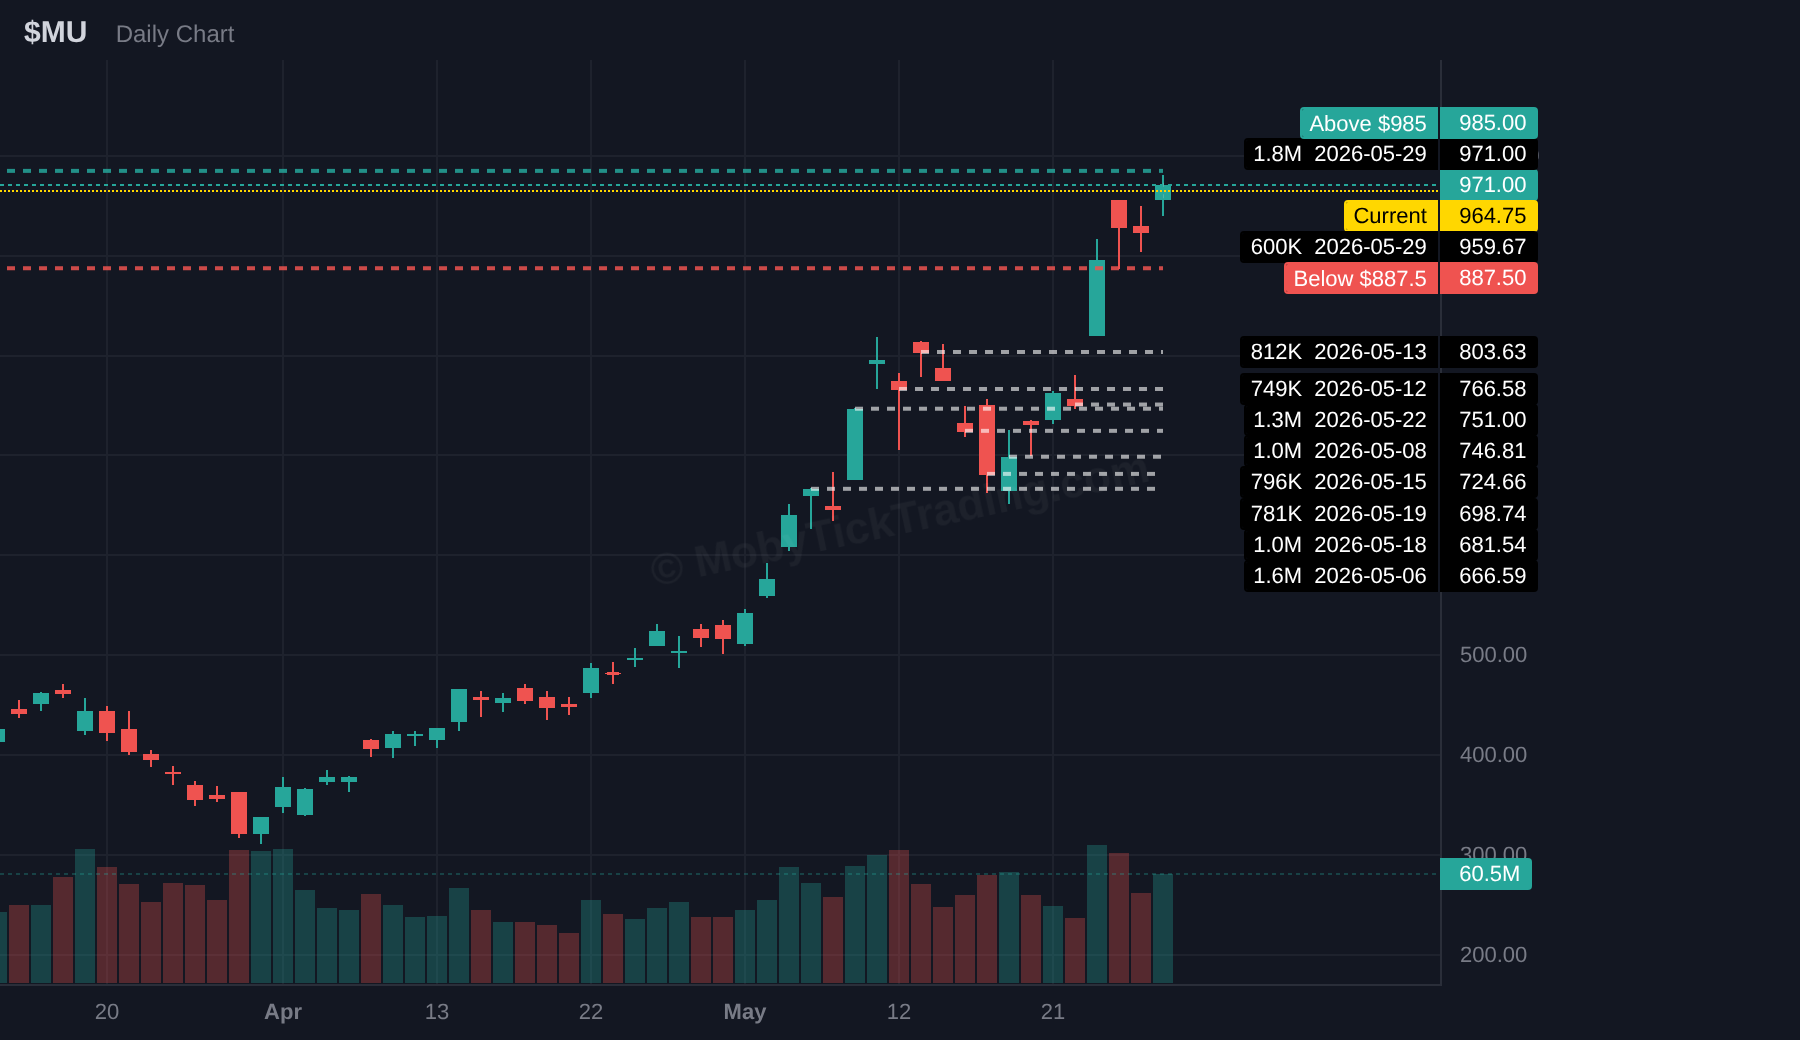
Bullish above $985.00 | Targets: $1000.00, $1025.00, $1050.00, $1075.00, $1100.00
Bearish below $887.50 | Targets: $875.00, $850.00, $825.00, $800.00
$IONQ — IonQ
Dark pool flow: $698.5M across 13.73M shares and 10 aggregated print levels. Average reported print price: $50.86. Print prices are execution prices; they are not being represented as closing prices.
Volume context: reported dark pool shares equaled approximately 0.40× the 30-day average daily share volume (34.33M ADV).
Last week candle: Open $64.30 | High $72.17 | Low $59.71 | Close $72.07 | Week move +12.08%.
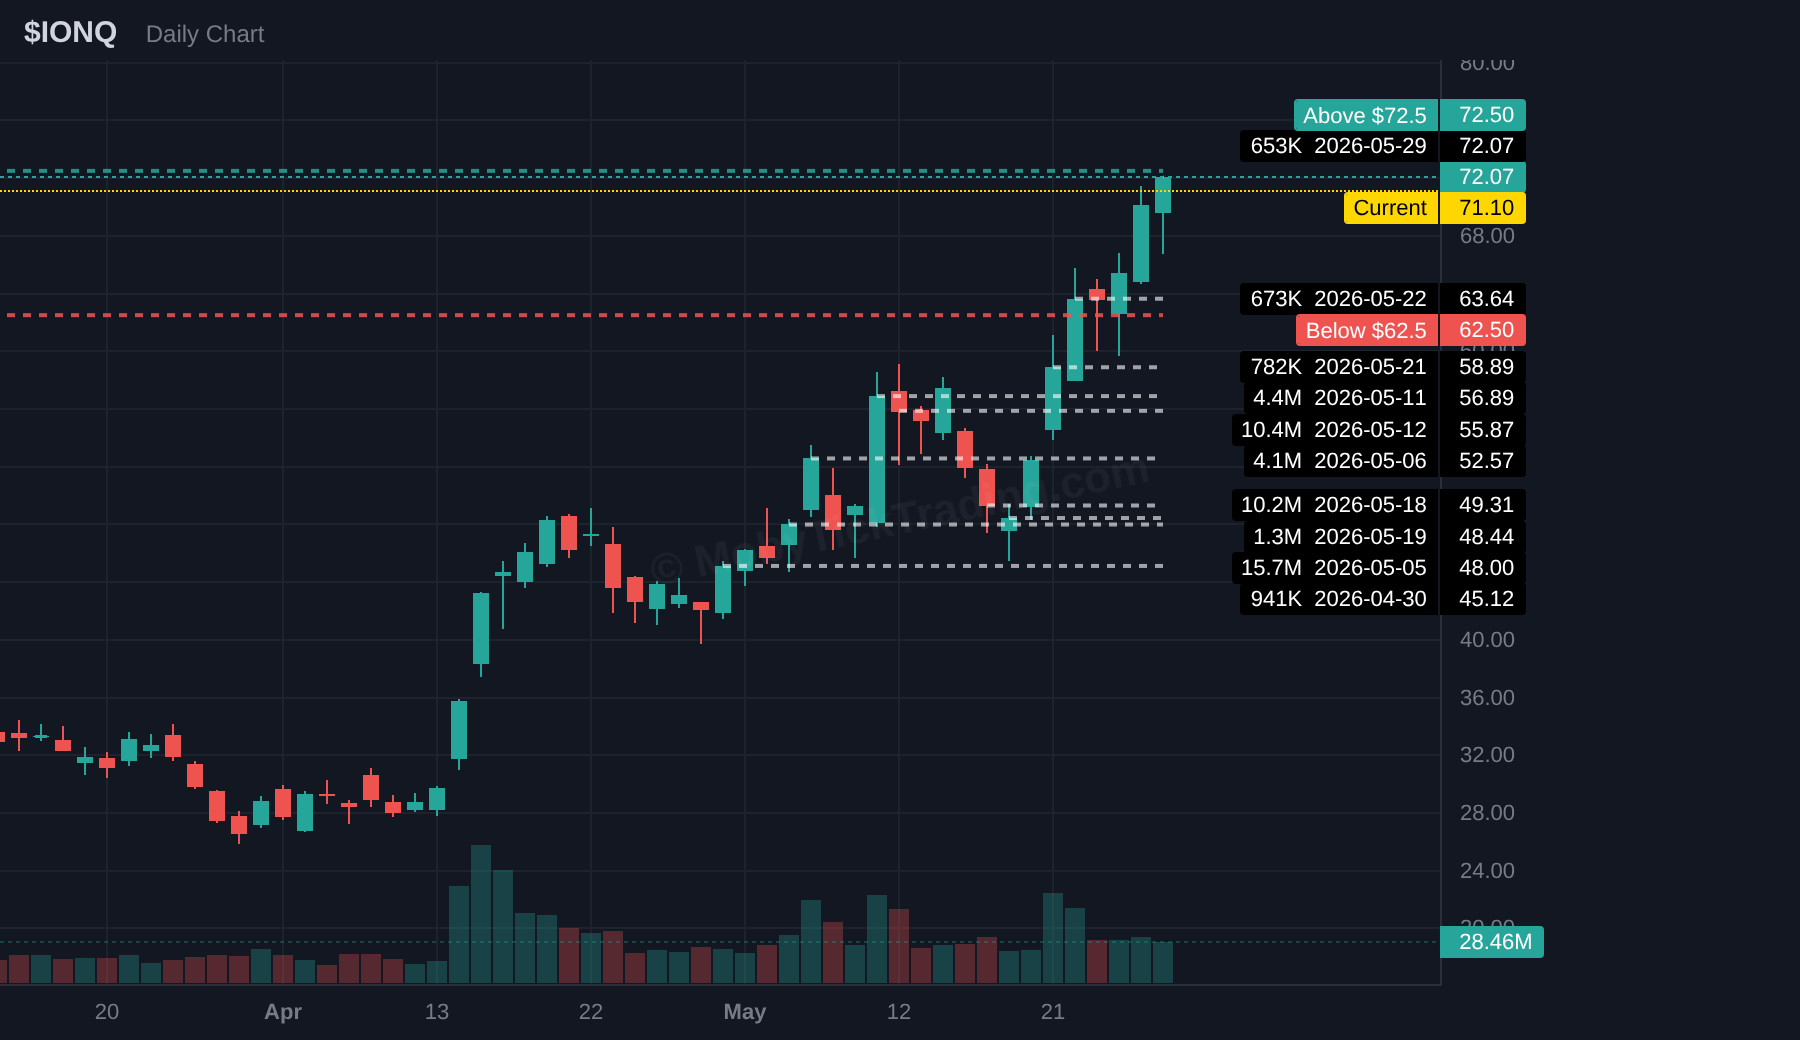
Bullish above $72.50 | Targets: $75.00, $77.50, $80.00, $82.50, $85.00
Bearish below $62.50 | Targets: $60.00, $57.50, $55.00, $52.50, $50.00, $48.00, $46.75
$GOOGL — Alphabet
Dark pool flow: $7.58B across 19.52M shares and 19 aggregated print levels. Average reported print price: $388.21. Print prices are execution prices; they are not being represented as closing prices.
Volume context: reported dark pool shares equaled approximately 0.69× the 30-day average daily share volume (28.12M ADV).
Last week candle: Open $384.51 | High $393.88 | Low $378.46 | Close $380.34 | Week move -1.08%.
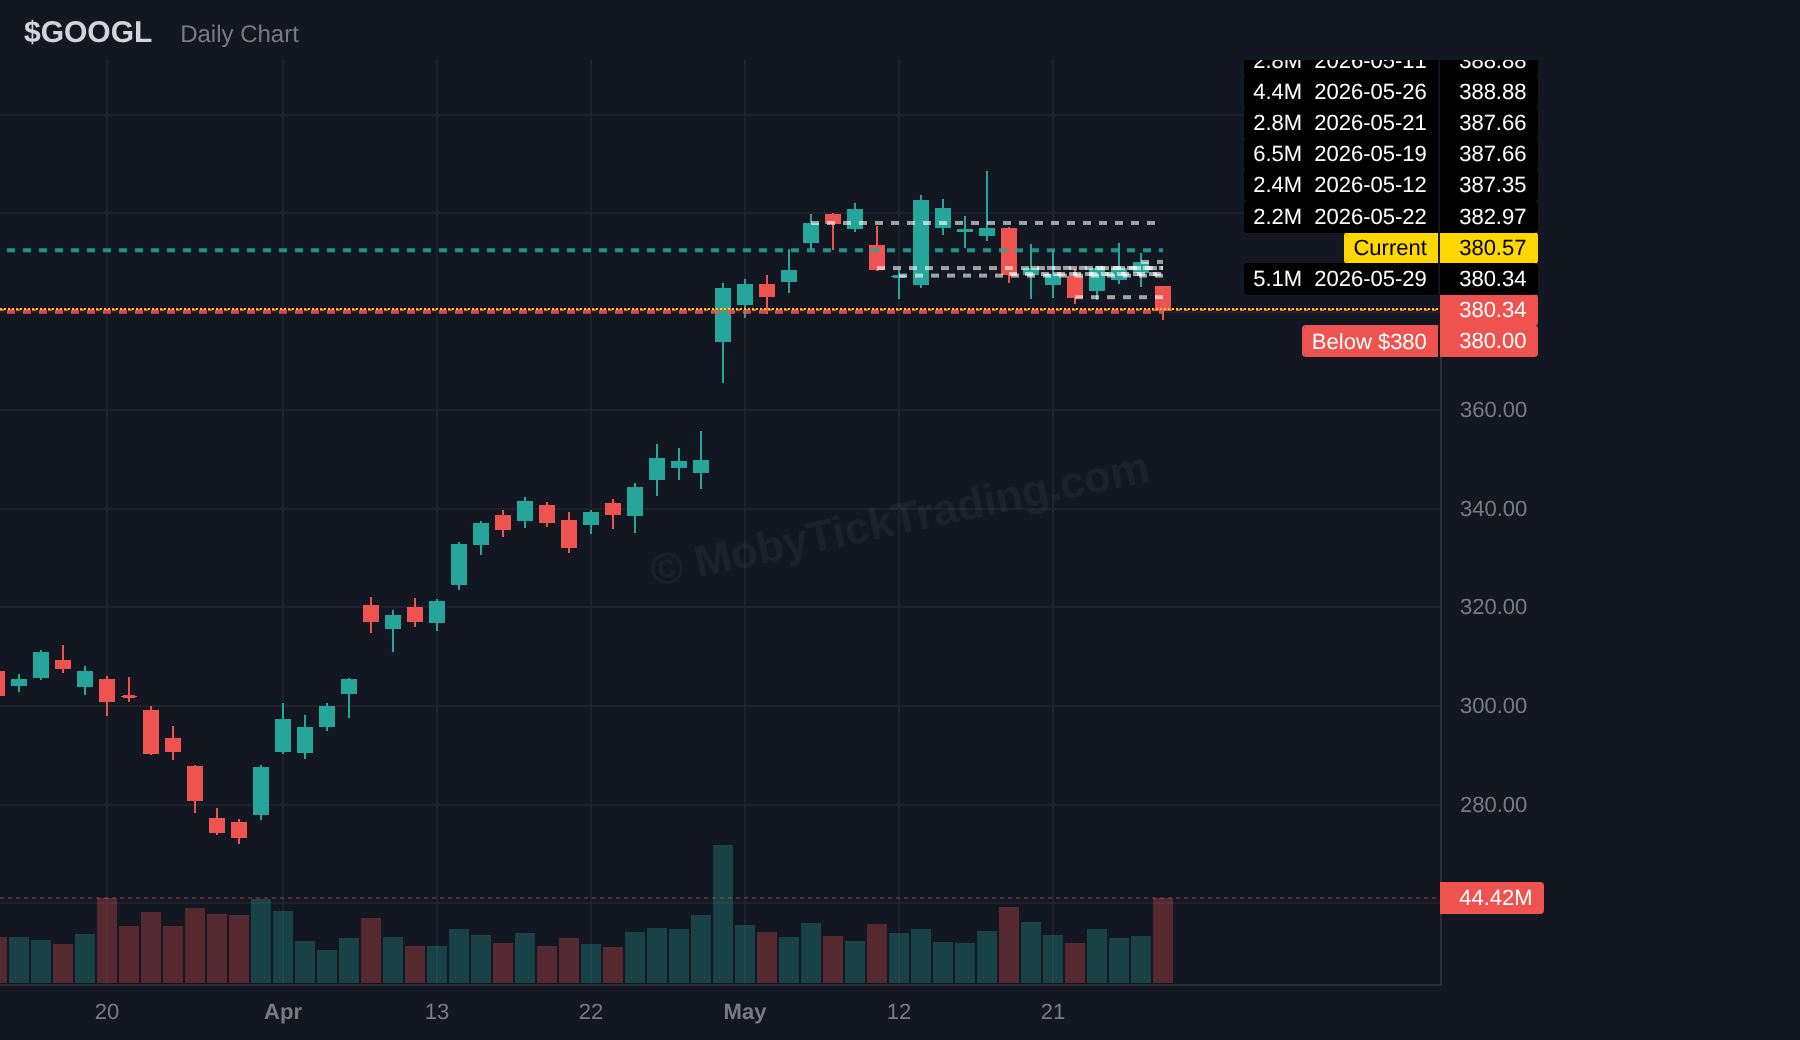
Bullish above $392.50 | Targets: $395.00, $397.50, $400.00, $402.50, $405.00, $410.00, $420.00
Bearish below $380.00 | Targets: $375.00, $370.00, $365.00, $360.00, $355.00, $350.00
Market Themes and Setup Context
The finished May 25–29 week closed with narrow broad-index moves but very active single-name dispersion underneath the surface. SPY gained 0.86%, QQQ gained 1.70%, and IWM gained 0.71%, while individual names like Dell, IBM, Ford, Micron, Intel, and the quantum complex saw far wider weekly ranges.
Sector rotation was cleaner in the dark pool tape than in the headline tape. Technology still led sector dark pool flow with XLK at roughly $930M, but Energy ($609M), Health Care ($583M), and Financials ($563M) were all active as well. Consumer Staples was the lightest sector flow bucket, which fits a market still prioritizing growth and cyclical participation over defensive staples.
The biggest single-stock theme was Dell after blowout earnings. DELL finished the week near $420.91 after a sharp post-earnings expansion, helped by the AI-server narrative and the company’s reported AI backlog. IBM also became part of the week’s conversation as quantum/foundry investment headlines pushed the stock toward the $300 area and kept the broader quantum space in focus.
Ford deserves separate mention because its dark pool activity was unusually large relative to its price level and normal expectations for a legacy auto name. By contrast, SPCE had a huge visible move and massive exchange volume, but it did not show the same institutional dark-pool footprint. That difference matters: one looked more like institutional repositioning, the other more like high-volume retail momentum.
The setup list for June 1–4 reflects that mix: broad ETFs for index context, mega-cap tech where the biggest prints concentrated, and selected single names where dark pool activity and weekly range expansion created clean trigger ladders. As always, the levels matter more than the narrative.
Live Webinar — Trade Setups vs Trade Predictions
Live Thursday, June 4, 2026 at 12:00 PM EDT
Every webinar we get the same question: “What exactly will I learn?” Fair question. Here is what we are covering:
- Why predictions are psychological commitments — and how they quietly destroy your ability to manage a live trade
- The four components every real setup must have: entry, targets, stop loss, and time horizon
- How financial news, social media, and crowd sentiment introduce hidden bias into your decisions
- Why challenging your own beliefs is the hardest — and most profitable — skill in trading
- How dark pool activity reveals what large players are actually doing, often opposite to the headlines
- Three fully structured setups you can take immediately — no predictions, just structure
- A live MobyTick walkthrough: building a real setup from dark pool prints in real time
Register: https://meeting.mobyticktrading.com/meeting/register?sessionId=1083789073
Disclaimer
This report is for educational and informational purposes only. It is not financial advice, investment advice, or a recommendation to buy or sell any security. Dark pool prints show historical transaction activity and should be used as one input within a broader risk-managed process. Always define your own risk, position size, stop loss, targets, and time horizon before entering any trade.