
Market Overview — Week of July 13-17, 2026
The AI Trade Cracked, and Energy Caught the Bid
The week of July 13-17 was defined by a single, violent fault line: the AI-and-semiconductor complex broke down while capital rotated hard into energy and defensives. What started as a quiet, range-bound tape early in the week — the S&P 500 (SPY) actually printed a weekly high of $755.58 on Wednesday — unraveled Thursday and Friday into one of the sharpest tech de-ratings of the year. By Friday’s close, SPY finished at $743.29 (-1.22%), the Nasdaq 100 (QQQ) sank to $695.33 (-3.12%), and only the small-cap Russell 2000 (IWM) held its ground, dipping a modest -0.35% to $294.04.
That divergence tells the whole story. When the tech-heavy Nasdaq loses more than 3% while small caps barely flinch, it’s not a market in retreat — it’s a market in rotation.
The Catalyst: A Second DeepSeek Moment
The spark came Thursday. Chinese startup Moonshot’s new Kimi K3 model emerged as a credible rival to OpenAI and Anthropic, reviving the exact fear that rattled markets during the original DeepSeek shock: if frontier-grade AI can be built cheaper, what happens to the trillion-dollar capex thesis underpinning the entire semiconductor rally? Traders didn’t wait to find out. The PHLX Semiconductor Index (SOX) cratered -9.97% on the week and now sits roughly 18% below its June peak.
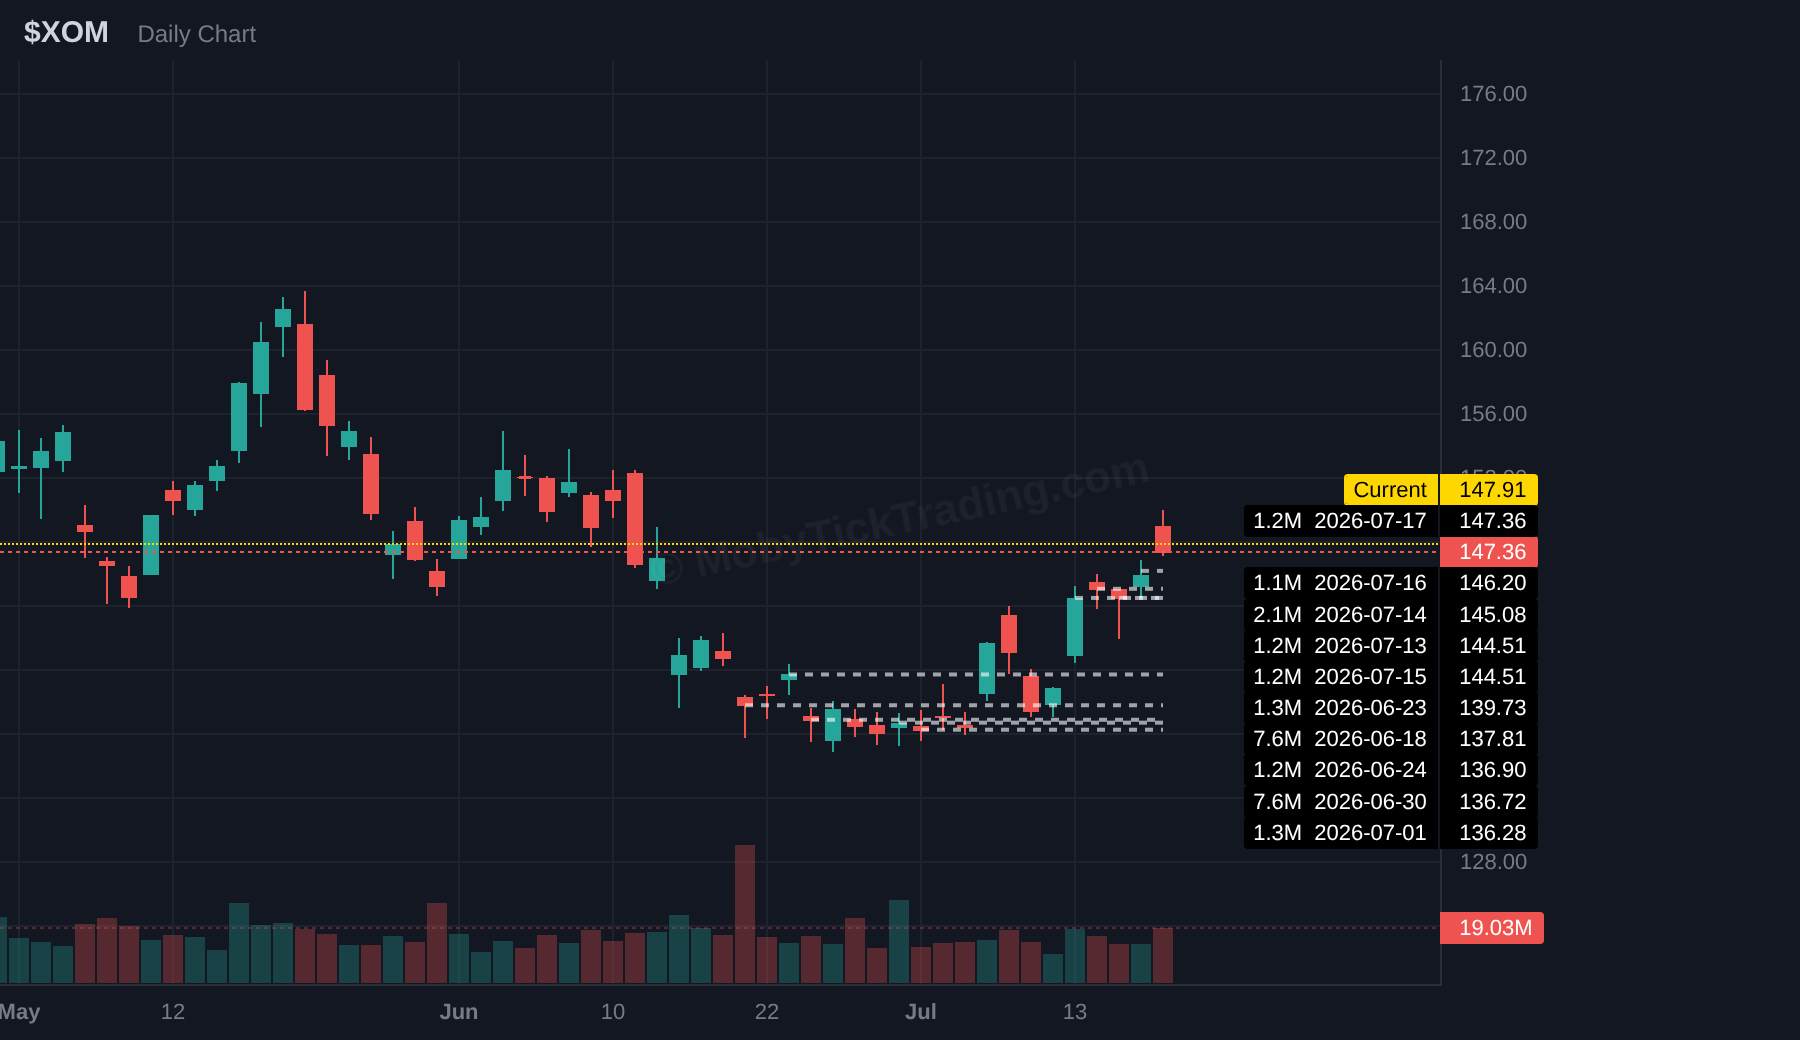
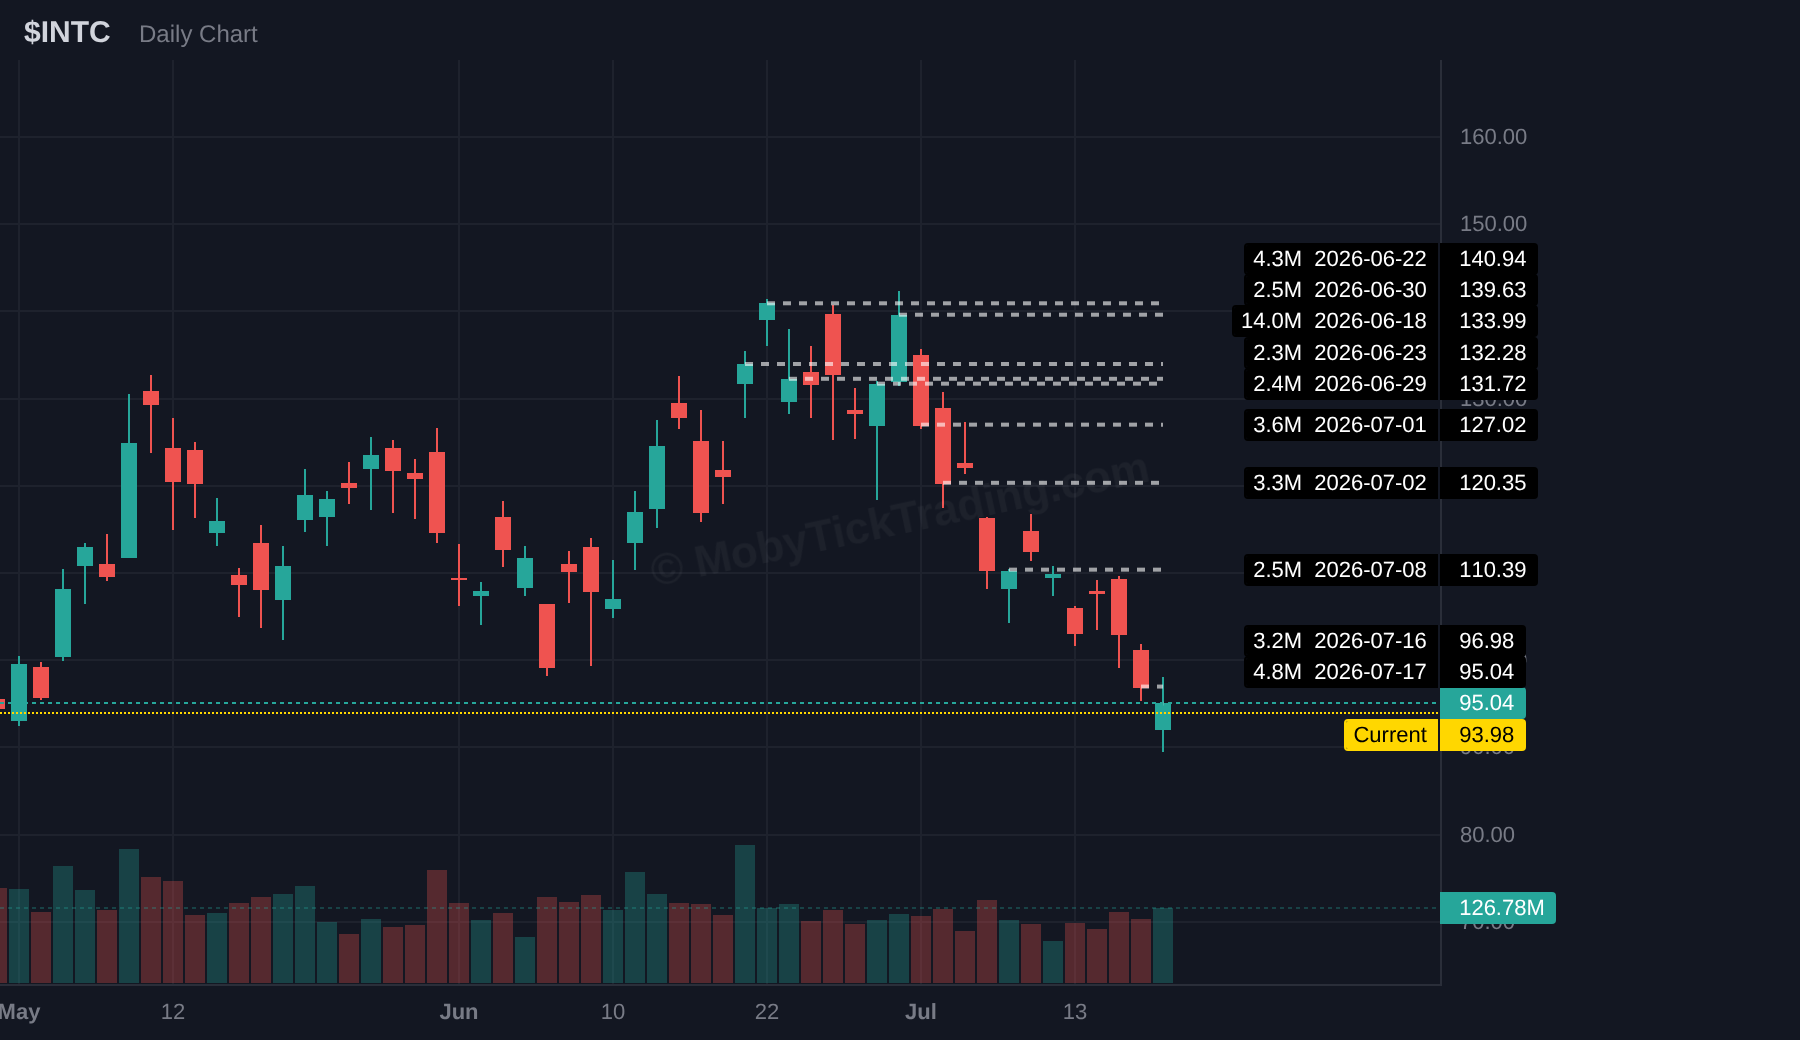
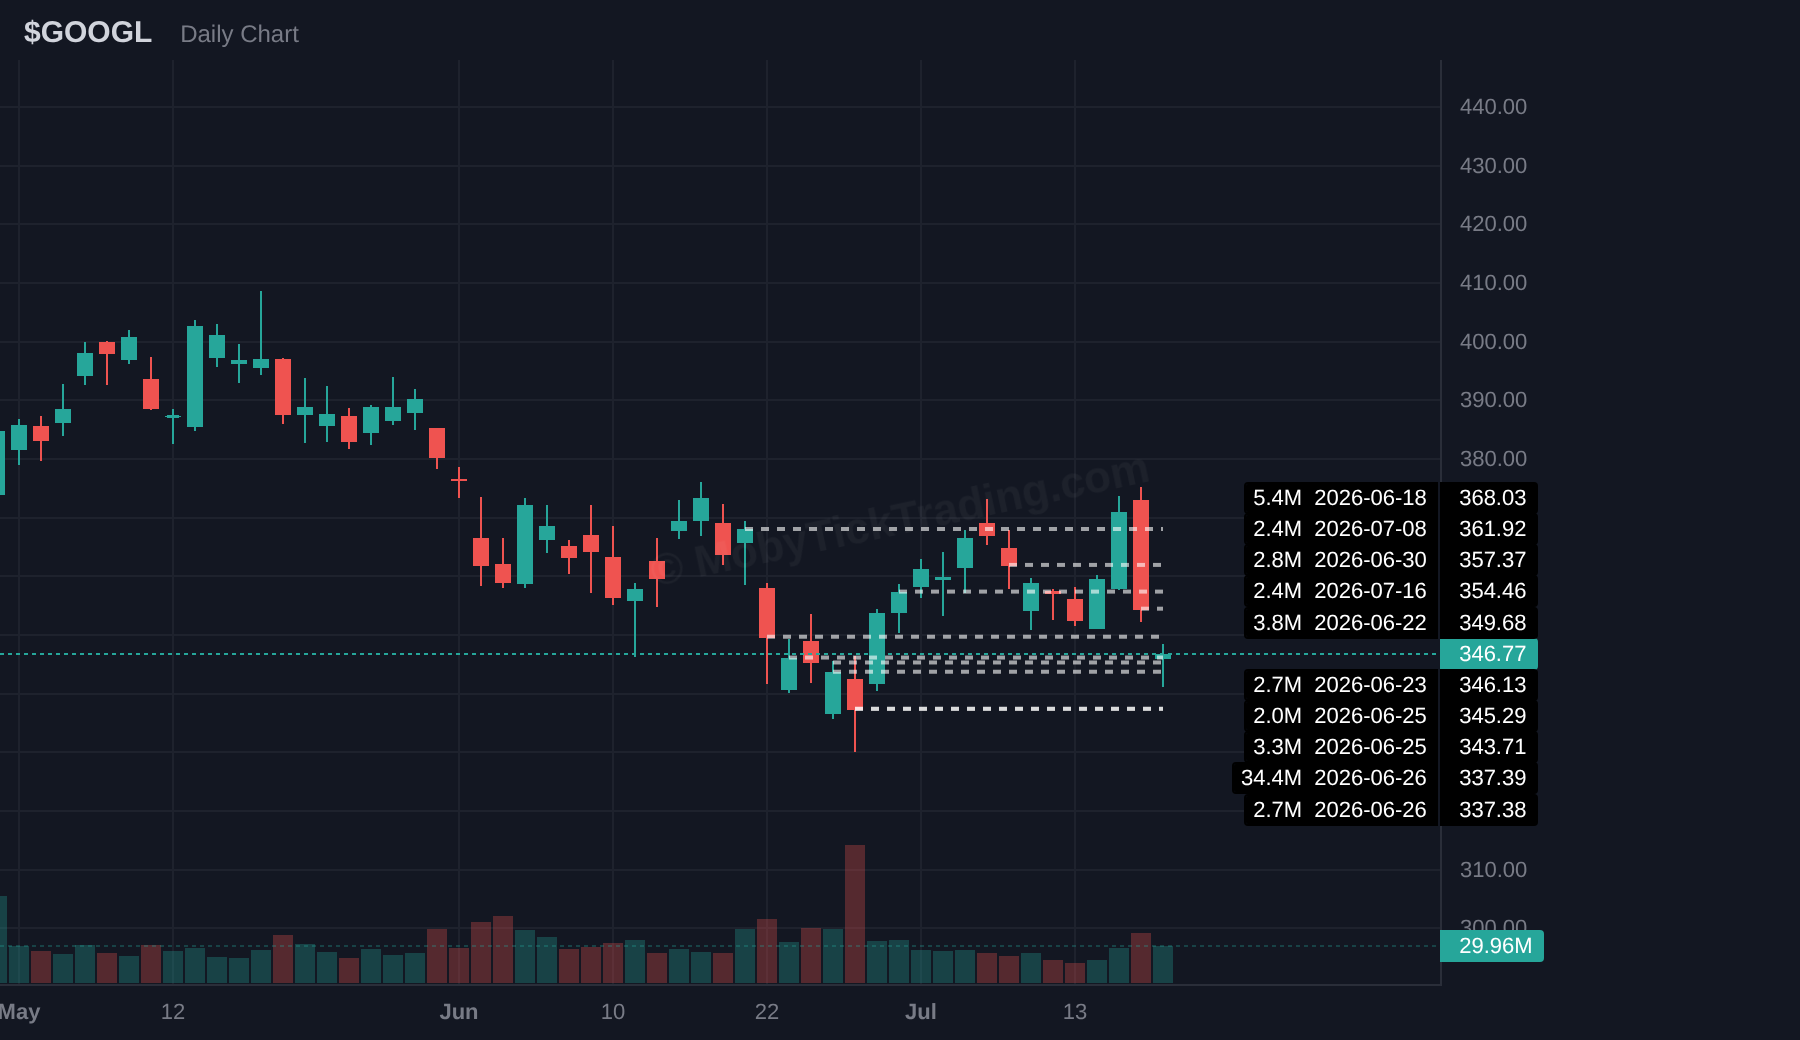
The carnage was concentrated exactly where you’d expect. Semiconductors (SMH) were obliterated -6.94%, Technology (XLK) fell -4.10%, and Consumer Discretionary (XLY) slid -1.50%. Among our picks, NVDA absorbed the blow, closing -2.75% at $202.81 after tagging an intraday low of $197.97 before clawing back. GOOGL was a rollercoaster — a Wednesday post-earnings spike to $373.65 gave way to a Thursday-Friday collapse as the AI-competition narrative punished search and AI names alike, leaving it at $346.77 (-2.64%). INTC was the week’s true casualty, bleeding every single session to close -10.33% at $95.04, and TSLA ground lower all week to $380.84 (-5.87%).
Where the Money Went Instead
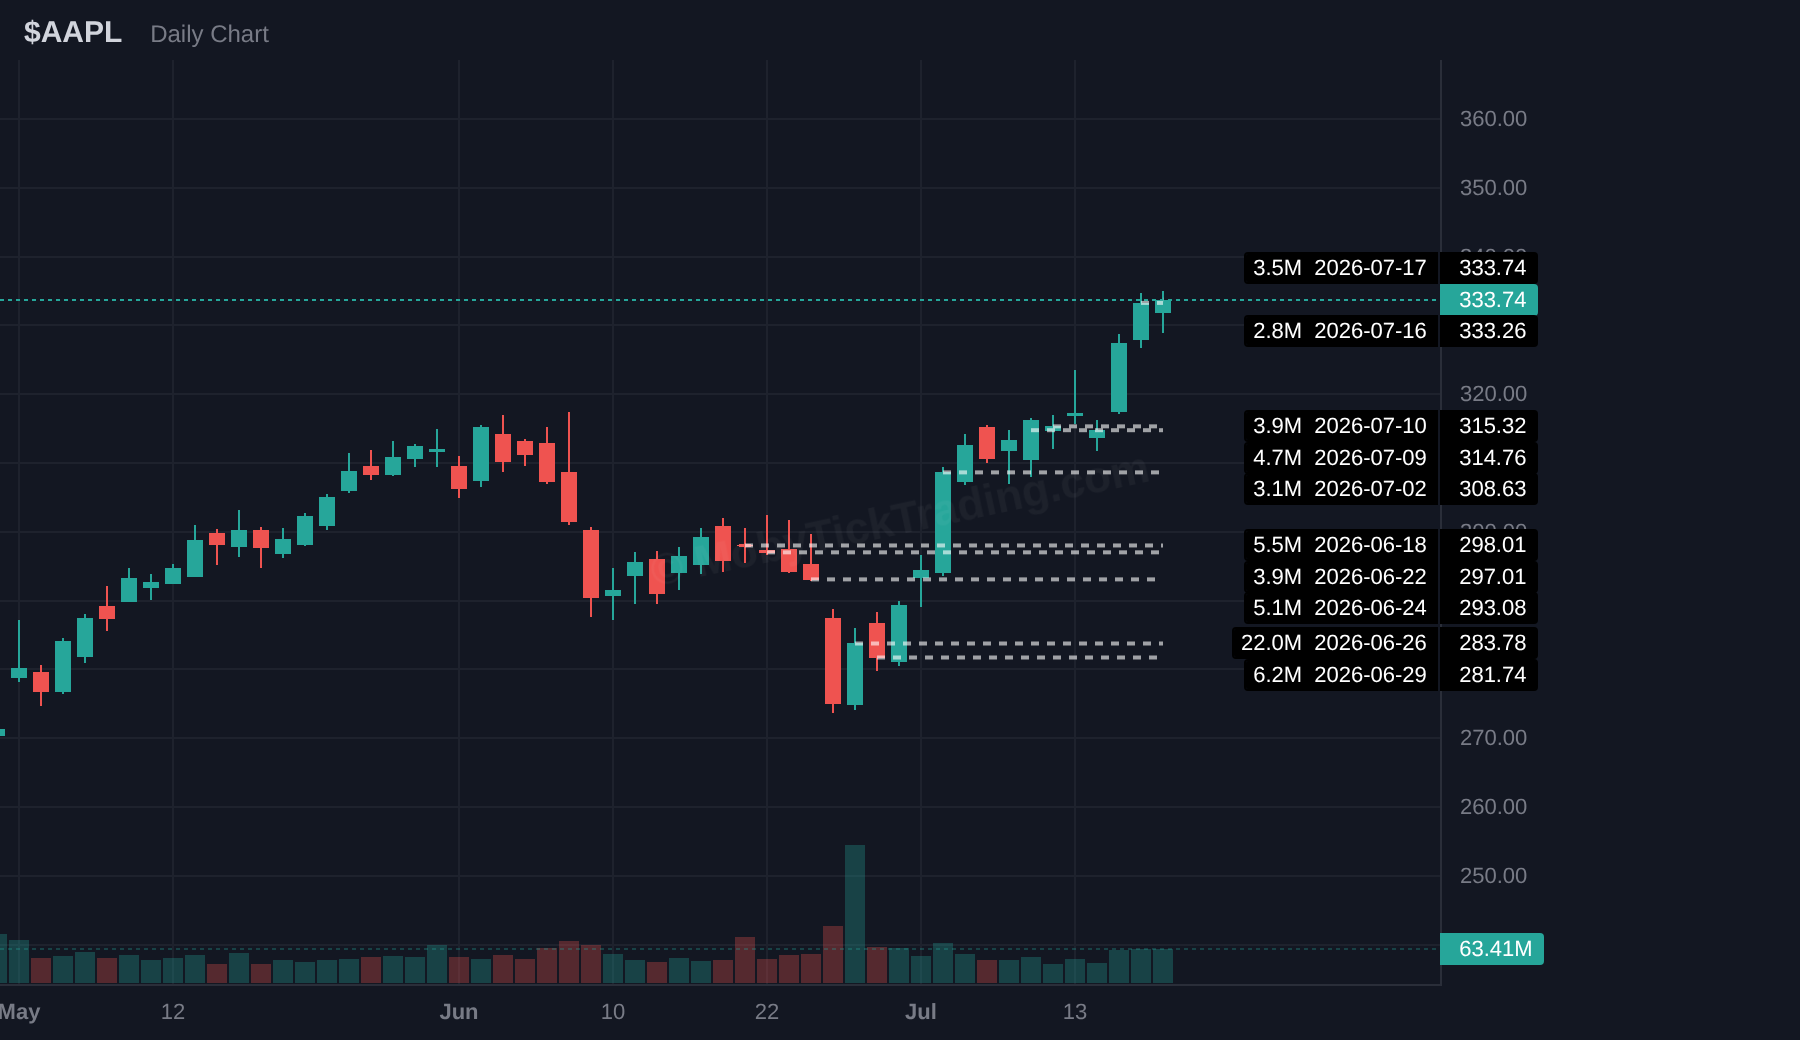
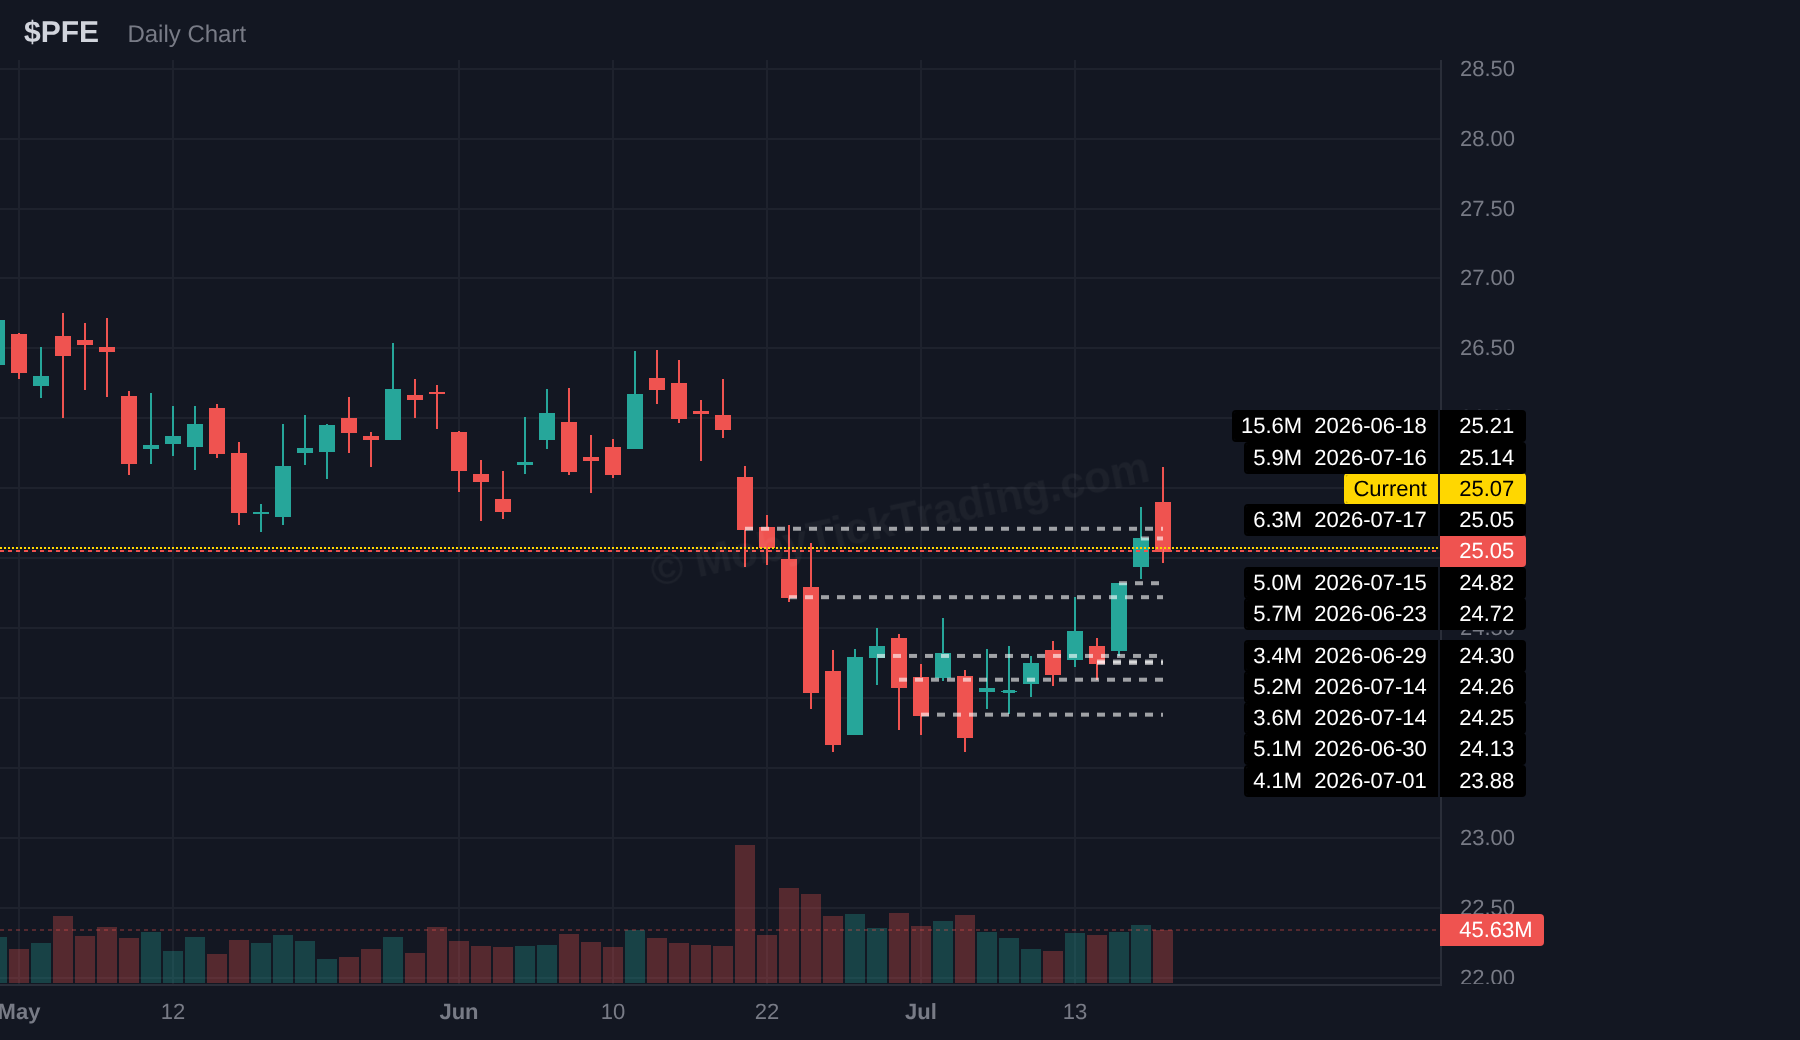
While AI names burned, the rotation lit up the opposite corner of the market. Iran-Strait of Hormuz tensions escalated mid-week, sending crude higher and lifting Energy (XLE) +2.33% — the top-performing sector — with the broader energy trade up roughly +4.7%. XOM was the poster child, rallying +4.57% to $147.36 and tagging $150.00 on Friday. Behind energy came Retail (XRT +1.37%), Consumer Staples (XLP +0.76%), and Financials (XLF +0.50%). The safe-haven bid was unmistakable: the 10-year Treasury yield fell on the week as capital sought shelter, and among our picks the defensives shone — AAPL was the star performer, notching a new 52-week high and closing +5.27% at $333.74, while pharma name PFE quietly accumulated to $25.05 (+3.17%) and IT-services play ACN recovered +3.21% to $143.57.
Fear was measurable. The VIX jumped roughly 25% to 19.5, and CNN’s Fear & Greed Index sat at 38/100 — firmly in “Fear” territory.
What the Dark Pool Flow Revealed
Here’s where it gets interesting. Institutional flow suggests smart money wasn’t panicking — it was positioning. Broad-market dark pool volume hit $24.6B on the week, and the ranked prints show conviction concentrated in exactly the names that mattered. NVDA drew $5.74B across 27 prints at an average of ~$206 — meaning institutions were absorbing the semi selloff, not fleeing it. XOM logged $1.44B as energy rallied, and INTC saw $1.37B accumulate at ~$98.54 into the beatdown, notably above Friday’s $95.04 close. On the defensive side, AAPL pulled $3.1B and PFE saw heavy share-count accumulation (31.5M shares, $783M). Financials (XLF) topped the sector ETFs at $748M. The read: institutions leaned into the weakness in beaten-down names while riding the energy and defensive rotation — often ahead of the tape rather than chasing it.
The Macro Backdrop
The Fed offered no rescue. June CPI came in with core inflation up 0.2% MoM (2.8% annual) — still stubbornly above the 2% target — and new Fed Chair Warsh, in his first Congressional testimony, signaled a data-dependent stance with no near-term pivot. Meanwhile, Q2 earnings season kicked off strong: 49 S&P 500 companies reported with a 90% beat rate and earnings growth tracking at +26%. Good fundamentals, but not enough to offset an AI-narrative crisis and geopolitical risk.
Setting Up the Gauntlet
Next week is when it gets real. Four of our thirteen picks report during the active newsletter window: FCX (Wed 7/22 BMO), GOOGL and TSLA (Wed 7/22 AMC), and INTC (Thu 7/23 AMC), with NVDA on deck around July 26-27. After a week that shattered the AI-trade complacency and rewarded the rotation, these prints will test whether the tech de-rating was a one-week scare or the start of a broader regime change. The setups are loaded — and the dark pool has already shown its hand.
Past Week Scorecard
How last week’s callout levels performed — July 13–17, 2026
| Ticker | Above | Below | High | Low | Close | Triggered | Targets Hit | Move From Trigger |
|---|---|---|---|---|---|---|---|---|
| SPY | $760.00 | $737.00 | $755.58 | $740.80 | $743.29 | None | Not triggered | — |
| QQQ | $730.00 | $715.00 | $724.36 | $686.76 | $695.33 | Below | 4 of 6 → T4 ($690.00) | $715.00 → $686.76 (−3.95%) |
| IWM | $300.00 | $290.00 | $297.81 | $291.64 | $294.04 | None | Not triggered | — |
| NVDA | $212.50 | $190.00 | $213.81 | $197.97 | $202.81 | Above | 0 of 6 | $212.50 → $213.81 (+0.62%) |
| AAPL | $317.50 | $307.00 | $334.99 | $311.91 | $333.74 | Above | 3 of 5 → T3 ($330.00) | $317.50 → $334.99 (+5.51%) |
| TSLA | $420.00 | $379.00 | $406.59 | $377.22 | $380.84 | Below | 0 of 3 | $379.00 → $377.22 (−0.47%) |
| BNS | $88.00 | $84.00 | $90.47 | $87.39 | $89.43 | Above | 2 of 5 → T2 ($90.00) | $88.00 → $90.47 (+2.81%) |
| NFLX | $77.50 | $72.00 | $75.45 | $65.08 | $68.95 | Below | 2 of 5 → T2 ($67.50) | $72.00 → $65.08 (−9.61%) |
| FCX | $62.50 | $56.00 | $62.92 | $56.00 | $58.38 | Both | A: 0/4 · B: 0/5 | A: $62.50 → $62.92 (+0.67%) · B: $56.00 → $56.00 (0.00%) |
| VOO | $700.00 | $675.00 | $694.50 | $680.92 | $683.17 | None | Not triggered | — |
| GM | $80.00 | $74.00 | $78.50 | $75.95 | $76.07 | None | Not triggered | — |
| META | $680.00 | $657.50 | $686.08 | $626.00 | $646.01 | Both | A: 0/6 · B: 4/4 → T4 ($627.50) | A: $680.00 → $686.08 (+0.89%) · B: $657.50 → $626.00 (−4.79%) |
| CCI | $80.00 | $73.75 | $80.82 | $78.10 | $79.17 | Above | 0 of 4 | $80.00 → $80.82 (+1.02%) |
▲ Above triggered: 6 · ▼ Below triggered: 5 · — None: 4
Tickers reaching ≥1 target: 5 · Total profit targets hit: 15
Verified: all OHLC data sourced from MobyTick Snapshot API
ETF Flow & Sector Rotation
Dark pool flow and sector performance — Week of July 13–17, 2026
Sector ETF Scorecard
| ETF | Sector | Weekly Δ | Dark Pool Flow |
|---|---|---|---|
| SMH | Semiconductors | **−6.94%** | — |
| XLK | Technology | **−4.10%** | — |
| XLY | Consumer Discretionary | −1.50% | — |
| XLI | Industrials | −1.16% | — |
| XLB | Materials | −0.86% | — |
| IBB | Biotech | −0.74% | — |
| XLU | Utilities | −0.62% | — |
| XLV | Healthcare | +0.07% | — |
| XLF | Financials | **+0.50%** | **$748M** |
| XLP | Consumer Staples | +0.76% | — |
| XRT | Retail | +1.37% | — |
| XLE | Energy | **+2.33%** | — |
# ETF Flow — Week of July 13–17, 2026
Sector ETF Scorecard
The Great Rotation: Energy Up, Tech Down
The week’s defining macro trade was a sharp rotation out of technology and into energy and defensive sectors. Two catalysts drove the move: escalating US-Iran tensions in the Strait of Hormuz and a fresh wave of AI competition fears out of China.
Energy (XLE +2.33%)** was the week’s top sector, rallying as crude surged on the Strait of Hormuz standoff. While XLE itself didn’t register sector-level dark pool prints, **XOM** saw $1.44B in dark pool volume — the largest single-stock energy block on the board.
At the other end of the spectrum, **Technology (XLK −4.10%)** bled value and **Semiconductors (SMH −6.94%)** took the heaviest hit. The catalyst: Chinese startup Moonshot’s Kimi K3 model emerged as a credible rival to OpenAI and Anthropic, reviving the DeepSeek-era fear that hyperscaler AI spending may not deliver proportionate returns. The PHLX Semiconductor Index fell nearly 10% on the week and sits 18% below its June peak.
Financials: The Quiet Beneficiary
While Energy grabbed headlines, **Financials (XLF +0.50%)** carved out a quiet gain and led all sector ETFs in dark pool participation. XLF recorded **$748M in dark pool flow across 13 prints**. The weekly candle — opening at $55.98, closing at $56.26 with minimal intraday drama — suggests steady institutional accumulation.
The components reinforce the picture. **JPM** ($1.64B), **C** ($989M), and **WFC** ($823M) churned over $3.4B through dark pools — roughly 4.5× XLF’s own ETF-level flow — pointing to institutional rebalancing into financials.
Breadth Check
Five of twelve tracked sectors finished green: Energy (+2.33%), Retail (+1.37%), Staples (+0.76%), Financials (+0.50%), and Healthcare (+0.07%). The losers were dominated by tech-adjacent names, with Semis (−6.94%) more than doubling Technology’s headline decline. The $24.6B in broad-market dark pool flow confirms institutions were actively repositioning, with the directional tilt favoring energy and financials over growth. Next week’s earnings parade — four picks report July 22–23, including GOOGL and TSLA — will test the rotation’s legs.
Data sourced from MobyTick dark pool prints and verified OHLC from the MobyTick Snapshot API. ETF-level dark pool flow was captured for XLF; ticker-level flow provided for sector-adjacent names where relevant.
Weekly Callout Levels — July 20-24
Quick-reference table: bullish above and bearish below levels for the upcoming week
| Ticker | ▲ Above | Targets | ▼ Below | Targets |
|---|---|---|---|---|
| SPY | $751.00 | $754.00 → $757.00 → $760.00 → $762.50 | $740.00 | $735.00 → $735.00 → $732.50 → $730.00 |
| QQQ | $702.50 | $705.00 → $710.00 → $715.00 → $720.00 | $686.00 | $680.00 → $675.00 → $672.50 → $665.00 |
| IWM | $298.00 | $300.00 → $302.50 → $305.00 → $310.00 | $290.00 | $287.50 → $285.00 → $282.50 → $280.00 |
| NVDA | $215.00 | $217.50 → $220.00 → $224.00 → $227.50 | $197.50 | $195.00 → $190.00 → $187.50 → $185.00 |
| XOM | $151.00 | $152.50 → $155.00 → $157.50 → $160.00 | $144.50 | $142.00 → $140.00 → $138.50 → $136.00 |
| INTC | $100.00 | $105.00 → $108.00 → $112.50 → $114.00 | $89.50 | $85.00 → $82.50 → $80.00 → $75.00 |
| AAPL | $335.00 | $340.00 → $345.00 → $350.00 → $352.50 | $313.00 | $310.00 → $307.50 → $305.00 → $300.00 |
| GOOGL | $360 | $365 → $370 → $375 → $380 | $340 | $338 → $335 → $330 → $325 |
| TSLA | $390 | $395 → $400 → $405 → $410 | $374 | $370 → $360 → $350 → $340 |
| SPCX | $140 | $145 → $150 → $155 → $160 | $122 | $120 → $110 → $100 → $90 |
| ACN | $147.5 | $150 → $155 → $160 → $162.50 | $135 | $132.5 → $130 → $125 → $120 |
| FCX | $60 | $61.25 → $62.5 → $65 → $66 | $56 | $55 → $52.5 → $50 → $48.75 |
| PFE | $26.00 | $26.87 → $27.50 → $28.25 → $30.00 | $24.00 | $23.00 → $22.00 → $21.00 → $20.00 |
Stock Analysis & Dark Pool Signals
13 picks for July 20–24 with verified dark pool crossing signals
SPY SPDR S&P 500 ETF Trust
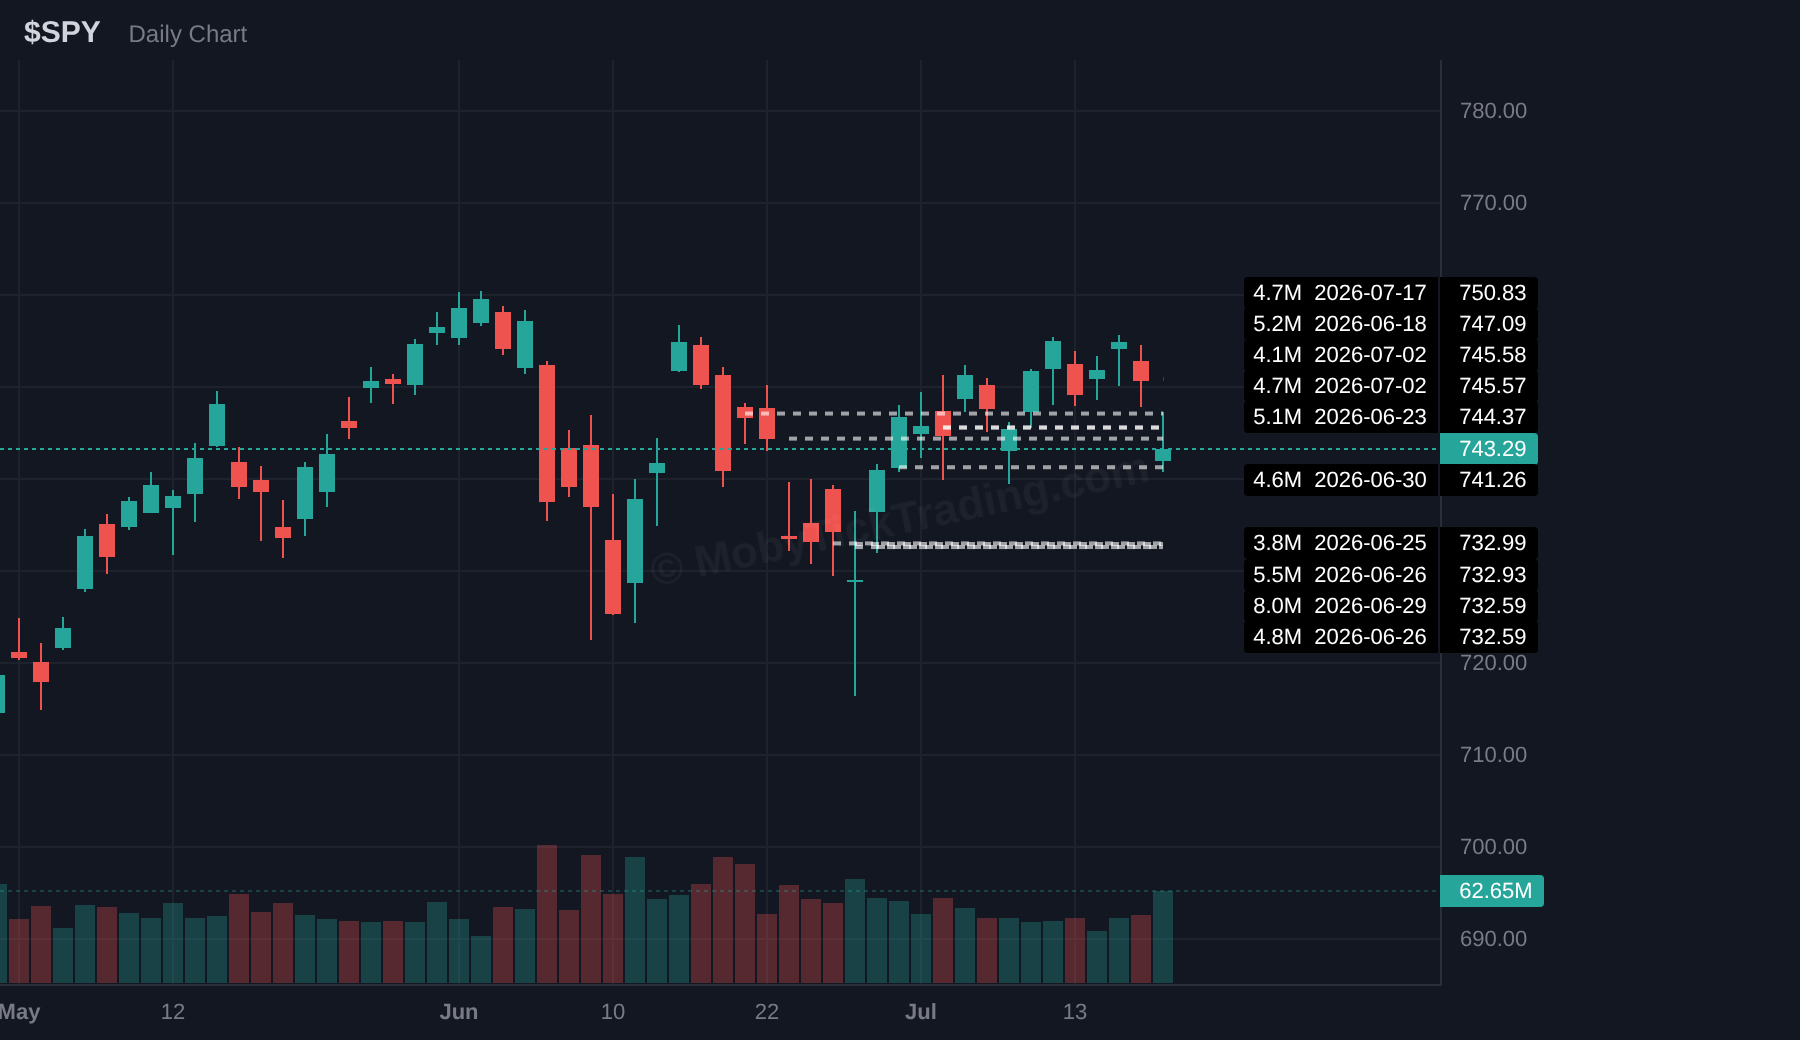
Weekly OHLC: O $752.47 · H $755.58 · L $740.80 · C $743.29
| Direction | Trigger | Targets |
|---|---|---|
| ▲ Above | $751.00 | 754.00 → 757.00 → 760.00 → 762.50 → 765.00… |
| ▼ Below | $740.00 | 735.00 → 735.00 → 732.50 → 730.00 → 720.00… |
- / QQQ / IWM — Benchmarks
- – SPY: Held above 740 support, Friday close $743.29. Technology weighting dragged QQQ -3.1% while IWM held flat (-0.35%).
- – Tech rotation into value/defensive was the dominant theme.
QQQ Invesco QQQ Trust
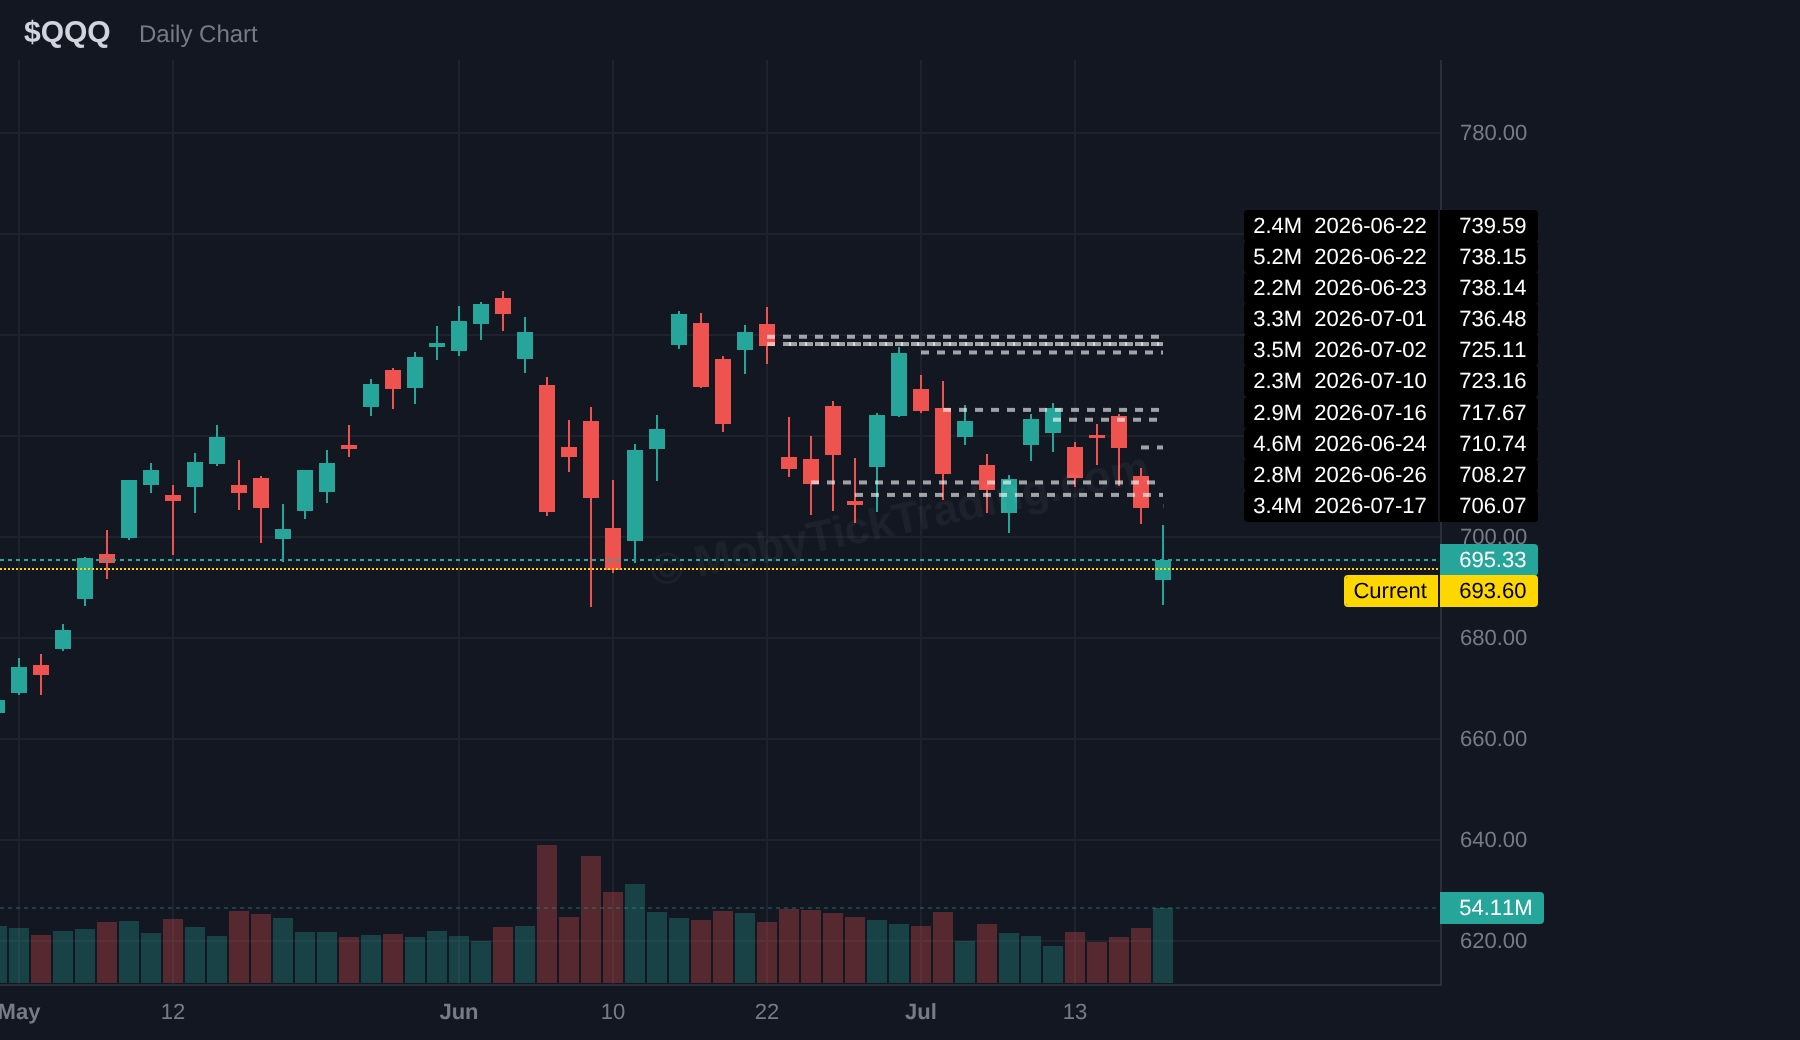
Weekly OHLC: O $717.72 · H $724.36 · L $686.76 · C $695.33
| Direction | Trigger | Targets |
|---|---|---|
| ▲ Above | $702.50 | 705.00 → 710.00 → 715.00 → 720.00 → 725.00… |
| ▼ Below | $686.00 | 680.00 → 675.00 → 672.50 → 665.00 → 650.00 |
- – Nasdaq Composite: -2.9% to 25,520 (Investrade / MyWeeklyStock)
- – Dow Industrials: -0.93% to 52,146 (Investrade)
- – Russell 2000: -0.42% to 2,962 (Investrade)
- Weekly candles:
IWM iShares Russell 2000 ETF
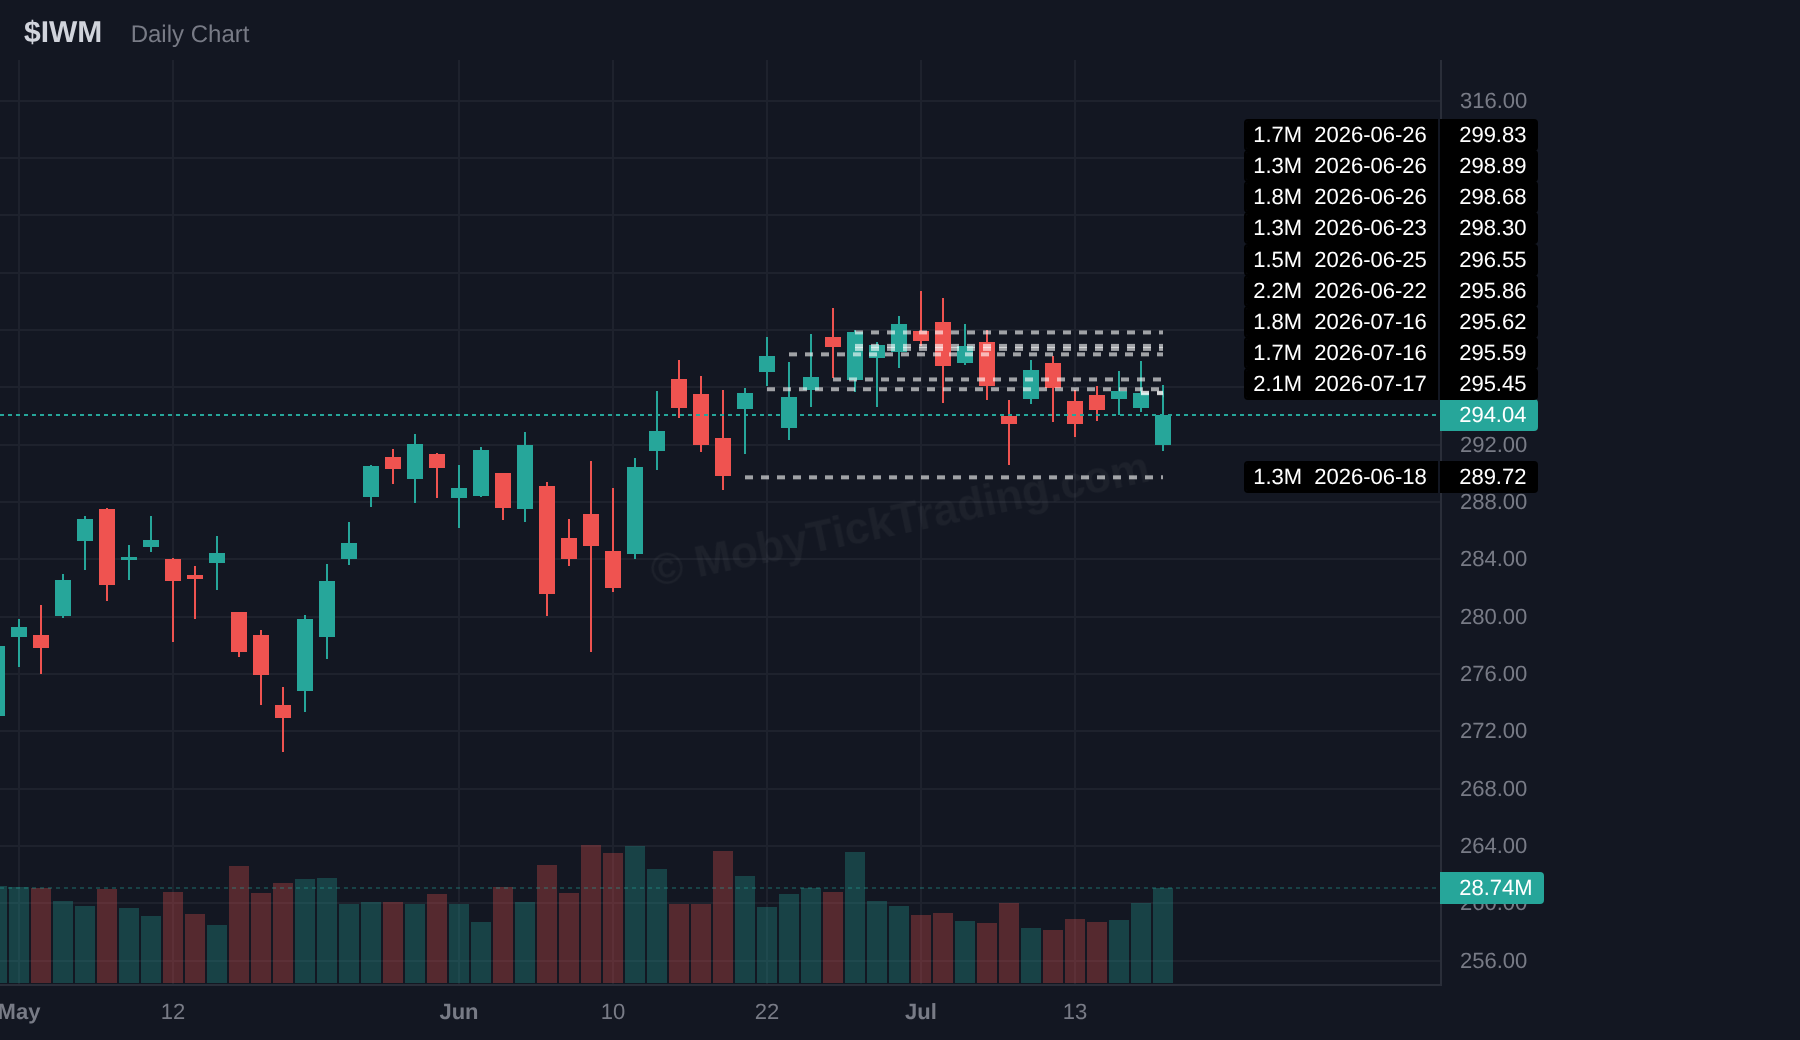
Weekly OHLC: O $295.06 · H $297.81 · L $291.64 · C $294.04
| Direction | Trigger | Targets |
|---|---|---|
| ▲ Above | $298.00 | 300.00 → 302.50 → 305.00 → 310.00 → 312.50… |
| ▼ Below | $290.00 | 287.50 → 285.00 → 282.50 → 280.00 → 276.00… |
- – Nasdaq Composite: -2.9% to 25,520 (Investrade / MyWeeklyStock)
- – Dow Industrials: -0.93% to 52,146 (Investrade)
- – Russell 2000: -0.42% to 2,962 (Investrade)
- Weekly candles:
NVDA NVIDIA Corporation
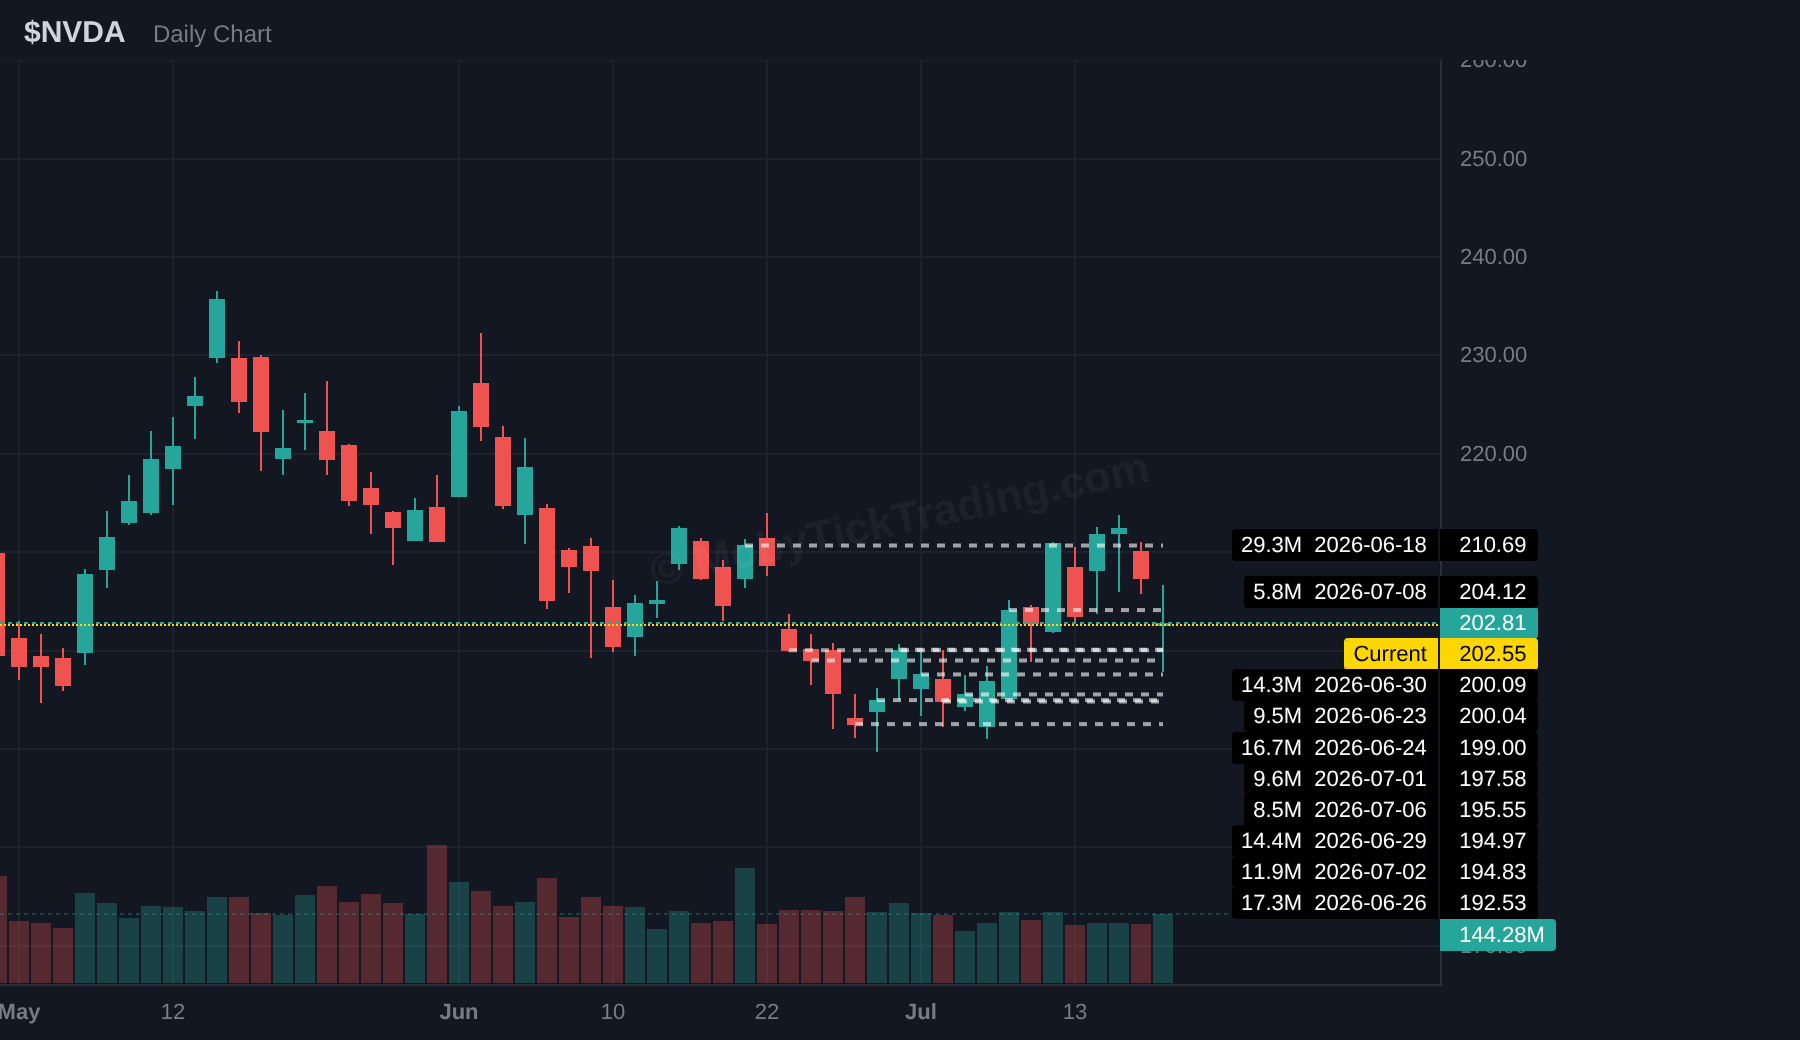
Earnings: ~Jul 26-27
| Direction | Trigger | Targets |
|---|---|---|
| ▲ Above | $215.00 | 217.50 → 220.00 → 224.00 → 227.50 → 230.00… |
| ▼ Below | $197.50 | 195.00 → 190.00 → 187.50 → 185.00 → 180.00 |
- (Close: $202.81, Week: -2.75%)
- – Caught in semi selloff. Closed Friday at $197.97 intraday low before recovering to $202.81.
- – AI capex return concerns from Moonshot Kimi K3 weighed on all AI/semi names.
- – Earnings: ~Jul 26-27 (per Dave).
XOM Exxon Mobil Corporation
Earnings: Jul 31 BMO
| Direction | Trigger | Targets |
|---|---|---|
| ▲ Above | $151.00 | 152.50 → 155.00 → 157.50 → 160.00 → 161.00… |
| ▼ Below | $144.50 | 142.00 → 140.00 → 138.50 → 136.00 → 135.00… |
- (Close: $147.36, Week: +4.57%)
- – Energy was the week’s top sector. Iran Strait of Hormuz escalation boosted crude.
- – Hit weekly high of $150.00 on Friday before pulling back.
- – Earnings: Jul 31 BMO.
INTC Intel Corporation
Earnings: Thu Jul 23 AMC
| Direction | Trigger | Targets |
|---|---|---|
| ▲ Above | $100.00 | 105.00 → 108.00 → 112.50 → 114.00 → 125.00… |
| ▼ Below | $89.50 | 85.00 → 82.50 → 80.00 → 75.00 → 70.00… |
- (Close: $95.04, Week: -10.33%)
- – CRUSHED. Opened $105.98 → closed $95.04. Fell every day, accelerated Thursday-Friday.
- – Post-earnings reaction (reported Jul 7). Market punishing foundry/restructuring uncertainty.
- – Hit weekly low of $89.59 on Friday.
AAPL Apple Inc.
Earnings: Jul 30 AMC
| Direction | Trigger | Targets |
|---|---|---|
| ▲ Above | $335.00 | 340.00 → 345.00 → 350.00 → 352.50 → 355.00… |
| ▼ Below | $313.00 | 310.00 → 307.50 → 305.00 → 300.00 → 290.00… |
- (Close: $333.74, Week: +5.27%)
- – STAR PERFORMER. Hit new 52-week high. Post-earnings rally continued.
- – Opened $317.02, never traded below $311.91. Steady grind higher all week.
- – Earnings: Jul 30 AMC.
GOOGL Alphabet Inc.
Earnings: Wed Jul 22 AMC
| Direction | Trigger | Targets |
|---|---|---|
| ▲ Above | $360 | 365 → 370 → 375 → 380 → 385… |
| ▼ Below | $340 | 338 → 335 → 330 → 325 → 320 |
- (Close: $346.77, Week: -2.64%)
- – Massive volatility. Wednesday post-earnings spike to $373.65 (+5% day), then Thursday collapsed to $352.30 (-6% from peak). Friday continued bleeding to $341.36 before recovering to $346.77.
- – AI competition narrative (Kimi K3) hit search/AI names hard Thursday-Friday.
- – Earnings: Jul 22 AMC (next week — second consecutive report? This may be a data conflict).
TSLA Tesla Inc.
Earnings: Wed Jul 22 AMC
| Direction | Trigger | Targets |
|---|---|---|
| ▲ Above | $390 | 395 → 400 → 405 → 410 → 420… |
| ▼ Below | $374 | 370 → 360 → 350 → 340 |
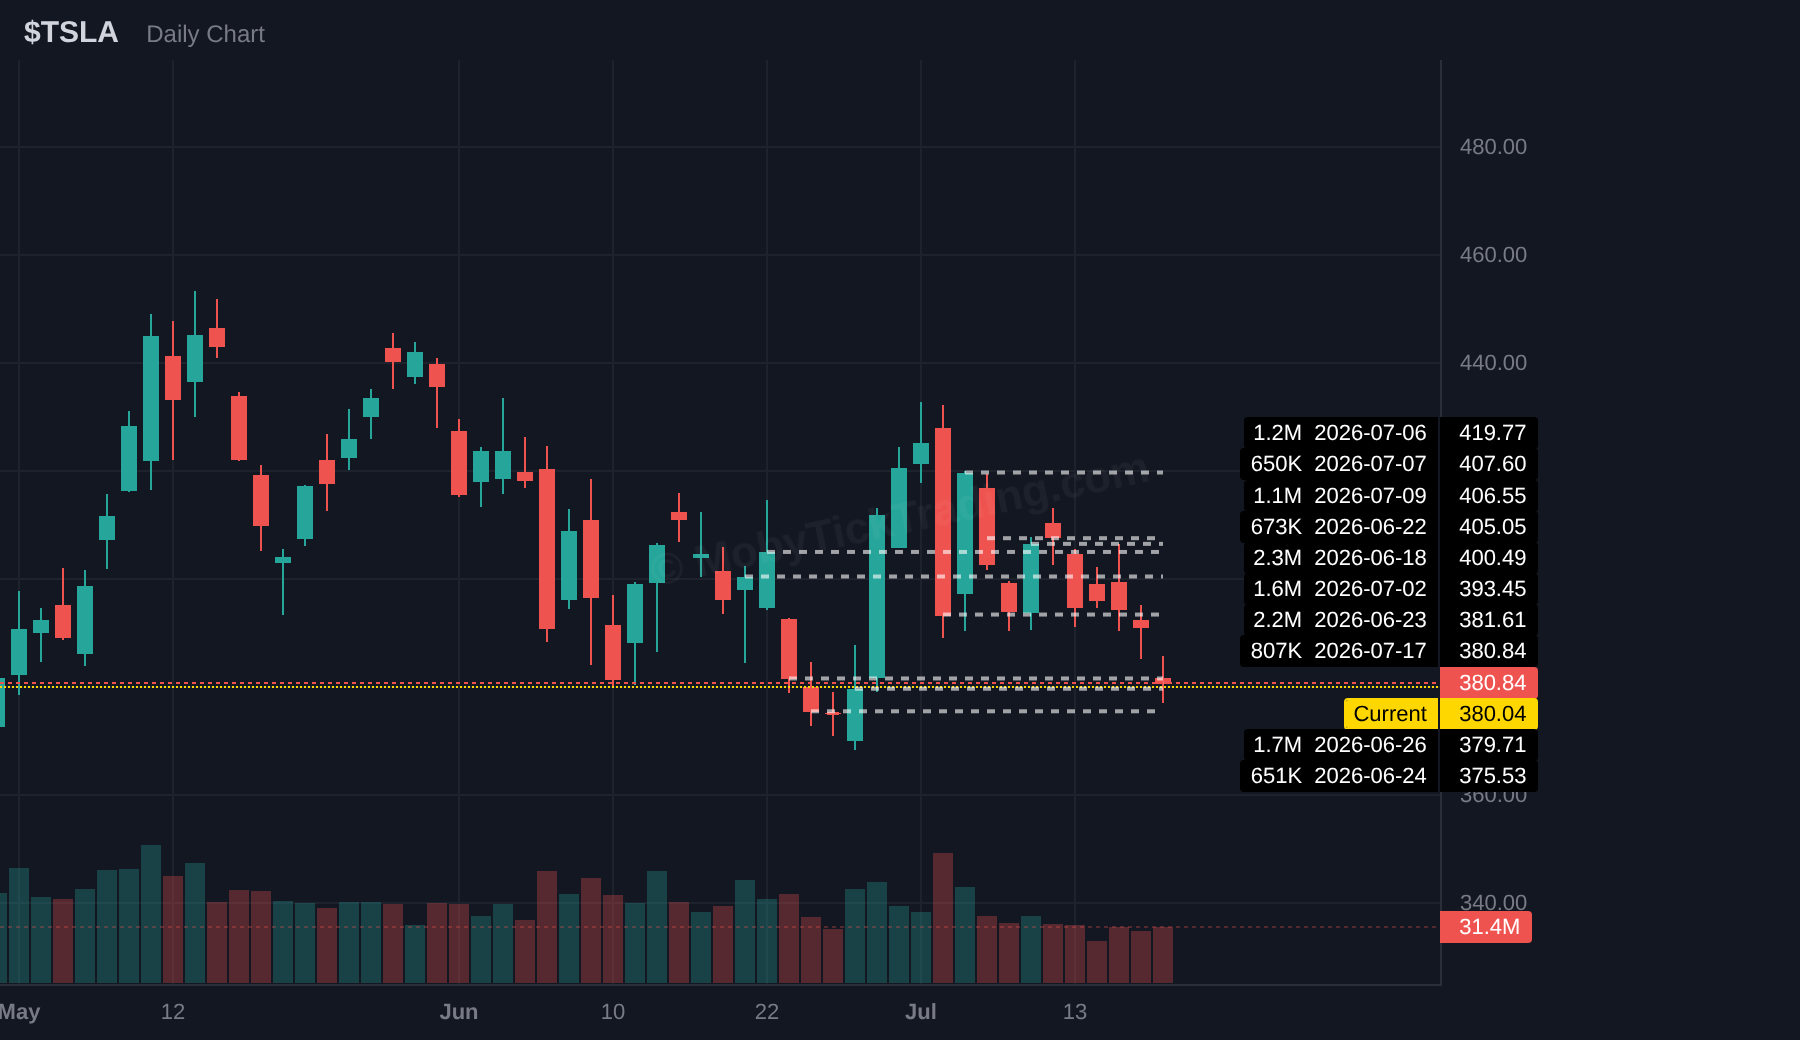
- (Close: $380.84, Week: -5.87%)
- – Steady decline all week. Opened $404.61, closed $380.84. Hit $377.22 low Friday.
- – EV demand concerns, tariff uncertainty, post-earnings weakness.
- – Earnings: Jul 22 AMC (next week).
SPCX SPCX ETF
| Direction | Trigger | Targets |
|---|---|---|
| ▲ Above | $140 | 145 → 150 → 155 → 160 → 167.5… |
| ▼ Below | $122 | 120 → 110 → 100 → 90 → 87.50… |
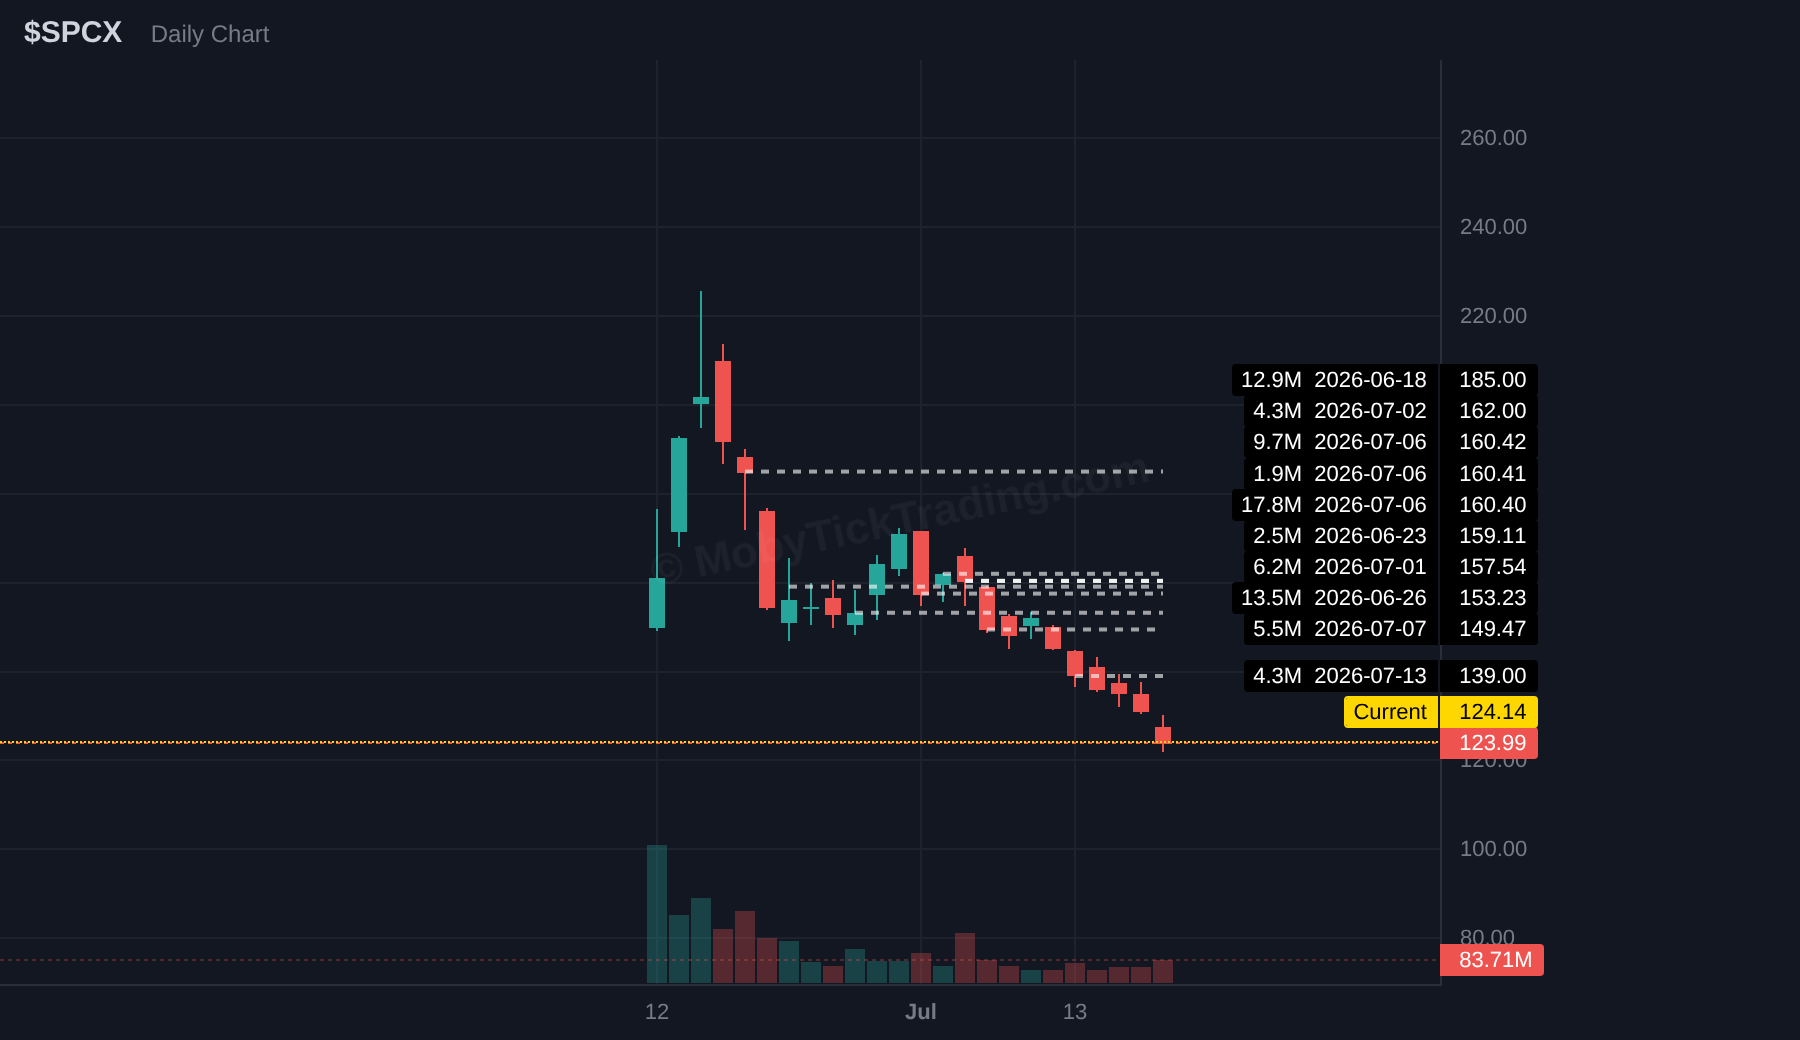
- (Close: $123.99, Week: -14.31%)
- – Steady decline from $144.70 Monday to $123.99 Friday. -14.3% weekly loss.
- – ETF product — high volatility, low liquidity. 4818x ADV anomaly noted in Phase 1b.
ACN Accenture plc
Earnings: Oct 1
| Direction | Trigger | Targets |
|---|---|---|
| ▲ Above | $147.5 | 150 → 155 → 160 → 162.50 → 170 |
| ▼ Below | $135 | 132.5 → 130 → 125 → 120 → 115… |
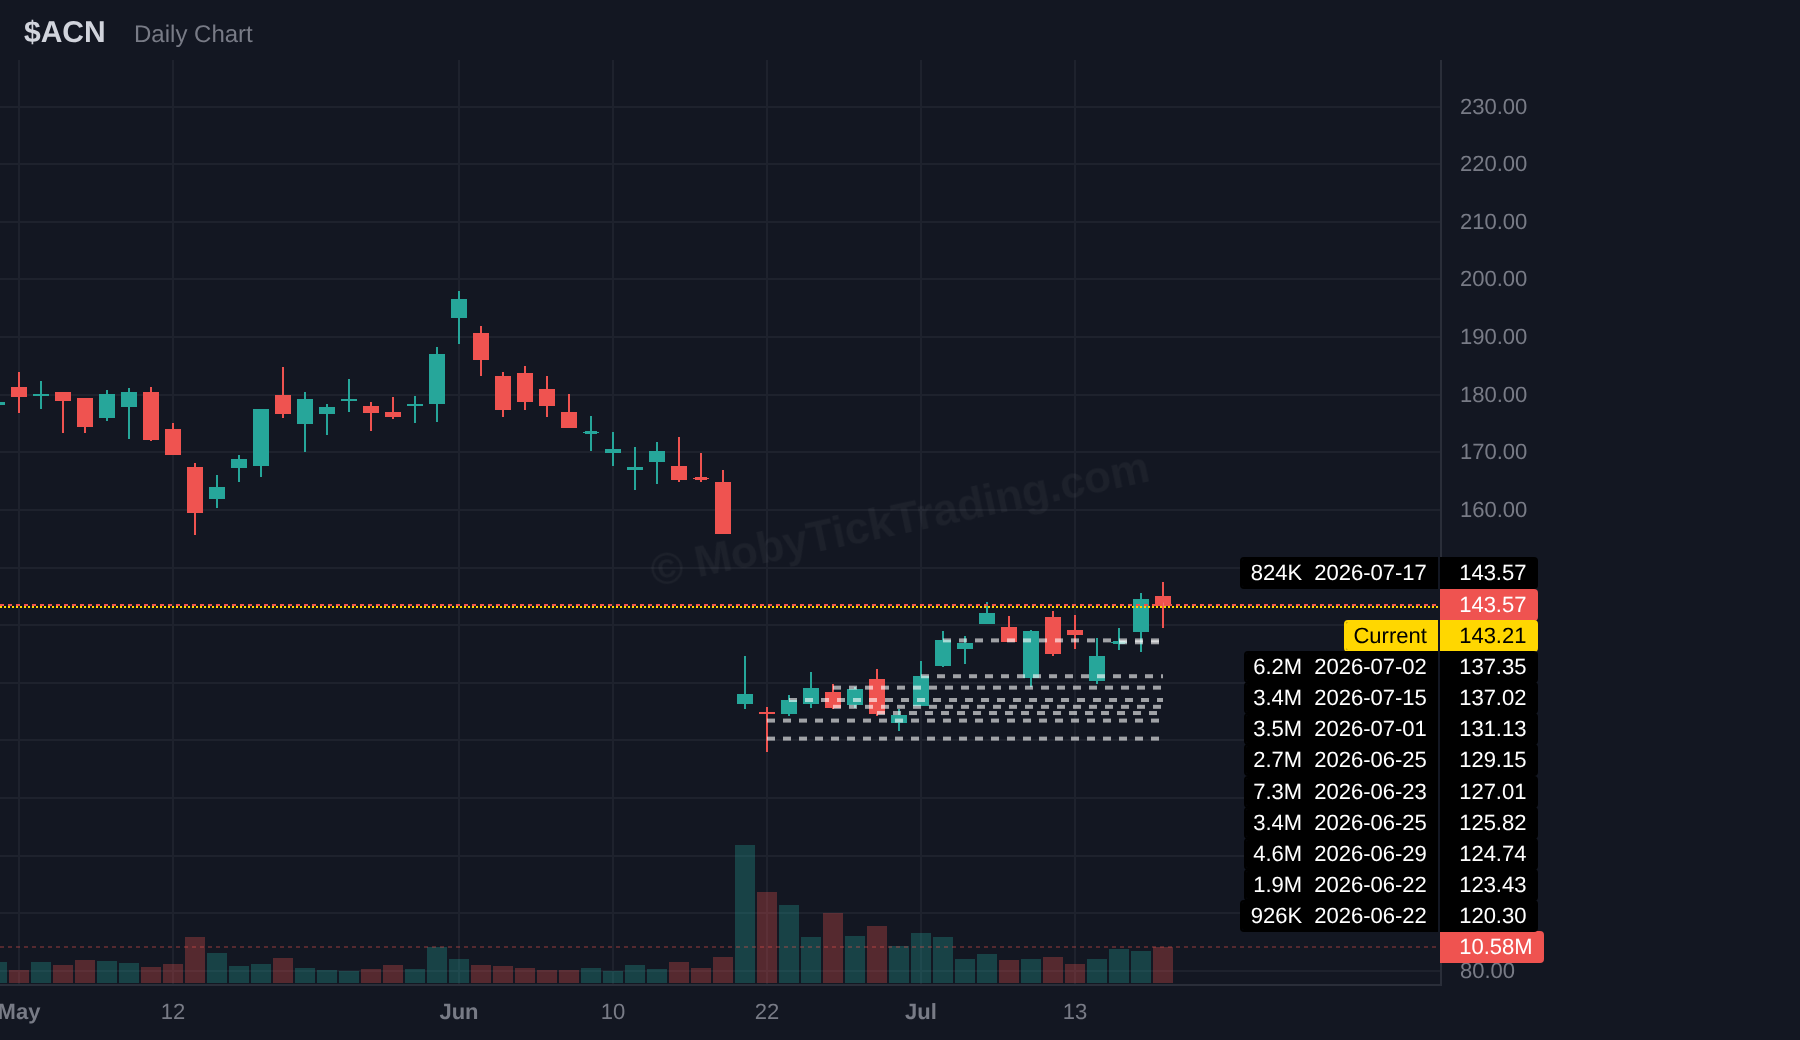
- (Close: $143.57, Week: +3.21%)
- – Strong recovery. Tuesday gap down to $129.96 then rallied to $147.42 Friday high.
- – IT services demand resilience narrative.
- – Earnings: Oct 1.
FCX Freeport-McMoRan Inc.
Earnings: Wed Jul 22 BMO
| Direction | Trigger | Targets |
|---|---|---|
| ▲ Above | $60 | 61.25 → 62.5 → 65 → 66 → 68… |
| ▼ Below | $56 | 55 → 52.5 → 50 → 48.75 → 45… |
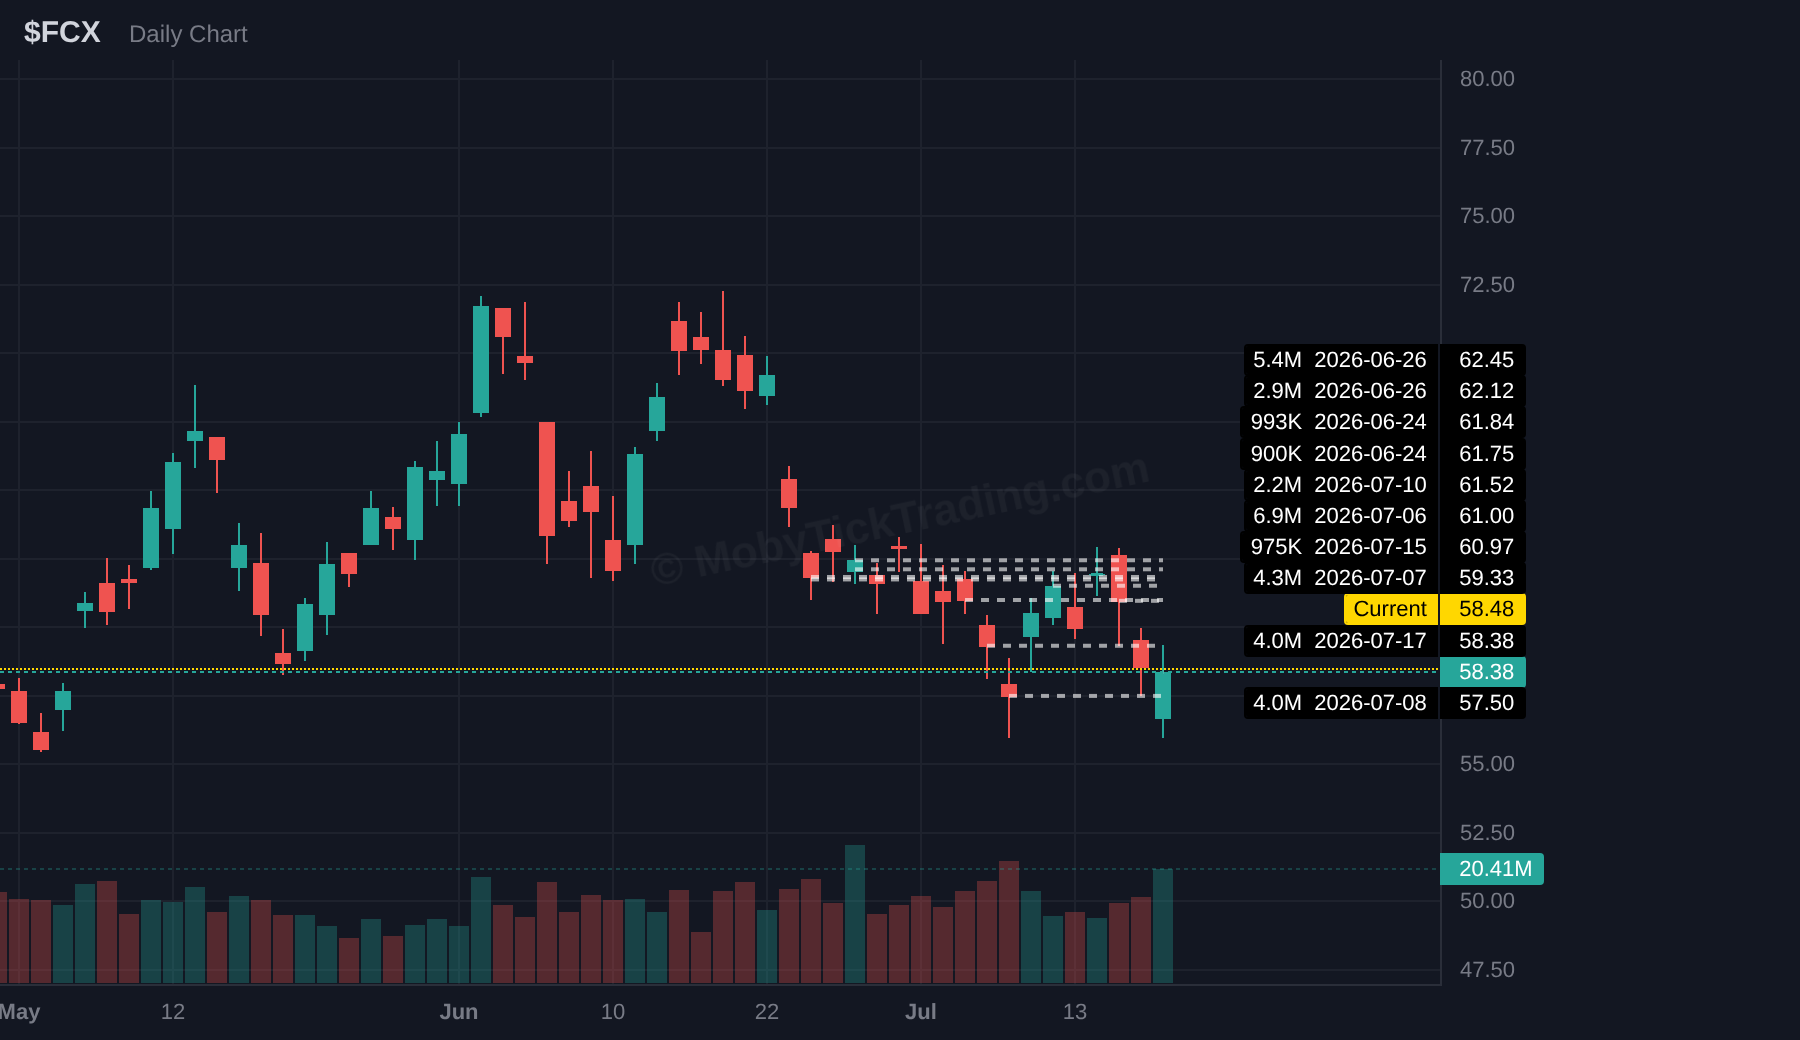
- (Close: $58.38, Week: -3.92%)
- – Declined with materials sector. Copper weakness. Opened $60.76 → closed $58.38.
- – Hit $56.00 intraday low Friday. Pre-earnings positioning.
- – Earnings: Jul 22 BMO (next week!).
PFE Pfizer Inc.
Earnings: ~Jul 29-Aug 5
| Direction | Trigger | Targets |
|---|---|---|
| ▲ Above | $26.00 | 26.87 → 27.50 → 28.25 → 30.00 |
| ▼ Below | $24.00 | 23.00 → 22.00 → 21.00 → 20.00 |
- (Close: $25.05, Week: +3.17%)
- – Steady accumulation. Opened $24.28 → closed $25.05. Healthcare/pharma rotation.
- – Hit $25.65 Friday high before settling. Defensive rotation beneficiary.
- – Earnings: ~Jul 29-Aug 5 (estimated).
Trading Around Earnings
How to navigate the volatility — Educational deep dive
# Trading Around Earnings: How to Navigate the Volatility
Earnings season is one of the most volatile, challenging, and potentially rewarding times to be a trader. With dozens of companies reporting their quarterly results in a single week, the market is flooded with new information that can cause dramatic price swings in a matter of minutes.
This past week, the Q2 earnings season kicked into high gear, with 49 companies reporting. A staggering 90% of them beat analyst expectations. This week, the action continues as four of our newsletter picks are on deck: FCX, GOOGL, TSLA, and INTC.
But how do we, as retail traders, navigate this chaos? How can we use the MobyTick levels to our advantage when news can send a stock soaring or tumbling in the blink of an eye? This week, we’ll break down practical strategies for trading around earnings.
Why Earnings Create Volatility (and Opportunity)
Earnings reports are the market’s report card for a company. They provide a detailed look at a company’s financial health, including revenue, profit margins, and, most importantly, forward guidance.
This flood of new data forces a market-wide re-evaluation of a stock’s price. Institutional investors, who trade massive volumes, often need to adjust their positions based on this new information. Much of this repositioning happens in dark pools — private exchanges where large orders can be executed without immediately impacting the public market price.
When a positive or negative earnings surprise occurs, these large players move, and the “footprints” of their activity often align with key technical levels. For us, this volatility is not something to fear, but something to understand and prepare for. The predictable levels act as a map during an otherwise chaotic journey.
Using Dark Pool Levels During Earnings Week
During earnings week, our callout levels become more critical than ever. Think of them less as rigid “buy” or “sell” signals and more as magnets for price action.
When a stock is volatile, it will often surge toward these key levels of liquidity. They can act as strong points of support or resistance where the stock might pause, reverse, or accelerate.
* Before the Report: In the days leading up to an earnings release, you’ll often see a stock consolidate or drift toward one of our key levels. This is often the market pricing in expectations and big players setting their initial positions.
* After the Report: This is where the real action is. A stock might gap up or down right to a key level. A beat might send it screaming toward our “Above” trigger, while a miss could see it plummet toward the “Below” trigger. The subsequent battle at these levels can define the trend for days or even weeks to come.
Real-World Examples from This Week
Theory is great, but let’s look at how this played out with real data from the past week. Note: none of our 13 picks have reported yet — but that makes these examples even more relevant. They show how the market positions *ahead* of earnings and how unrelated catalysts can create the same kind of volatility.
* Pre-Earnings Positioning (AAPL): Apple doesn’t report until July 30, but it was the standout performer of the week regardless. Starting from a weekly open of $317.02, AAPL ground steadily higher every session and closed at $333.74 (+5.27%) — a new 52-week high. Past week callout levels from $317.50 up through $330 were cleared methodically. This is a textbook example of institutional accumulation ahead of an earnings event: dark pool flow in AAPL totaled $3.1 billion on the week, showing large players building positions before the July 30 report. The levels served as a roadmap for the rally.
* The AI Scare as an Earnings Proxy (GOOGL): Google doesn’t report its own earnings until this coming Wednesday — but the stock experienced earnings-level volatility anyway. On Wednesday, GOOGL spiked to $373.65 before the AI competition narrative (Chinese startup Moonshot’s Kimi K3) crushed the entire semi and AI complex. GOOGL reversed violently, collapsing more than 6% from its mid-week peak to finish at $346.77 (-2.64% on the week). This is a critical lesson: during earnings season, *any* sector-wide catalyst can produce the same whipsaw action as an earnings report. Our $360 Above trigger was never tested — the sell-off came from external forces.
* The Sector Drag (INTC): Intel reports Thursday July 23. But you wouldn’t know it from this week’s tape — the stock bled every single session, opening at $105.98 and closing at $95.04 (-10.33%). The driver wasn’t Intel-specific news; it was the broader semiconductor de-rating (SOX -9.97%) triggered by AI competition fears. INTC’s dark pool flow of $1.37 billion at an average print price of ~$98.54 — above Friday’s $95.04 close — suggests institutions were absorbing the selloff, not fleeing it. When a stock trades down *into* earnings on sector-wide pressure, the report itself can become a catalyst for mean reversion.
Risk Management is Paramount
Trading during earnings is not about gambling on the outcome of the report. It’s about trading the market’s *reaction* to it. Holding a position through an earnings announcement is a high-risk bet that can go spectacularly wrong.
Here are a few key risk management principles:
2. Avoid the Gamble: For most traders, the prudent strategy is to wait for the report to be released and for the dust to settle. Let the market show its hand. The most reliable moves often occur in the hours and days *following* the initial reaction.
3. Use Levels for Defined Risk: The MobyTick levels provide clear areas to define your risk. If you’re trading a post-earnings rally, you might use the initial trigger level as your stop-loss. If the stock breaks back below it, your thesis is invalidated, and you can exit with a manageable loss.
By combining an understanding of market structure with disciplined risk management, you can transform earnings season from a period of fear and uncertainty into one of clarity and opportunity.
Stop Guessing. Start Tracking.
See where the smart money is moving before it shows up in the price.
Stop Guessing. Track the Smart Money.
Get institutional dark pool intelligence delivered weekly. 13 trade setups every Sunday.
Start Your 7-Day Free Trial