Tools · Dash
Dashboard
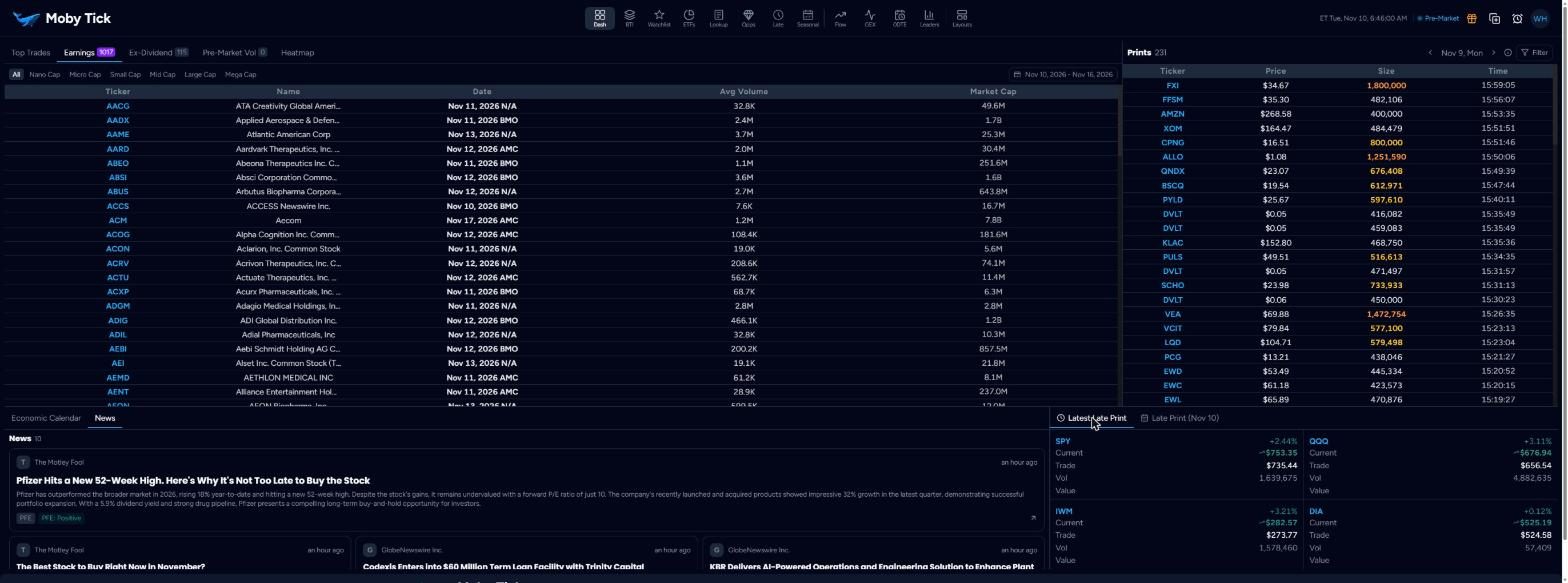
The Dashboard is the session overview. It brings the day's largest trades, live prints, earnings, ex-dividend dates, pre-market movers, a sector heatmap, the economic calendar, news and late prints onto one screen.
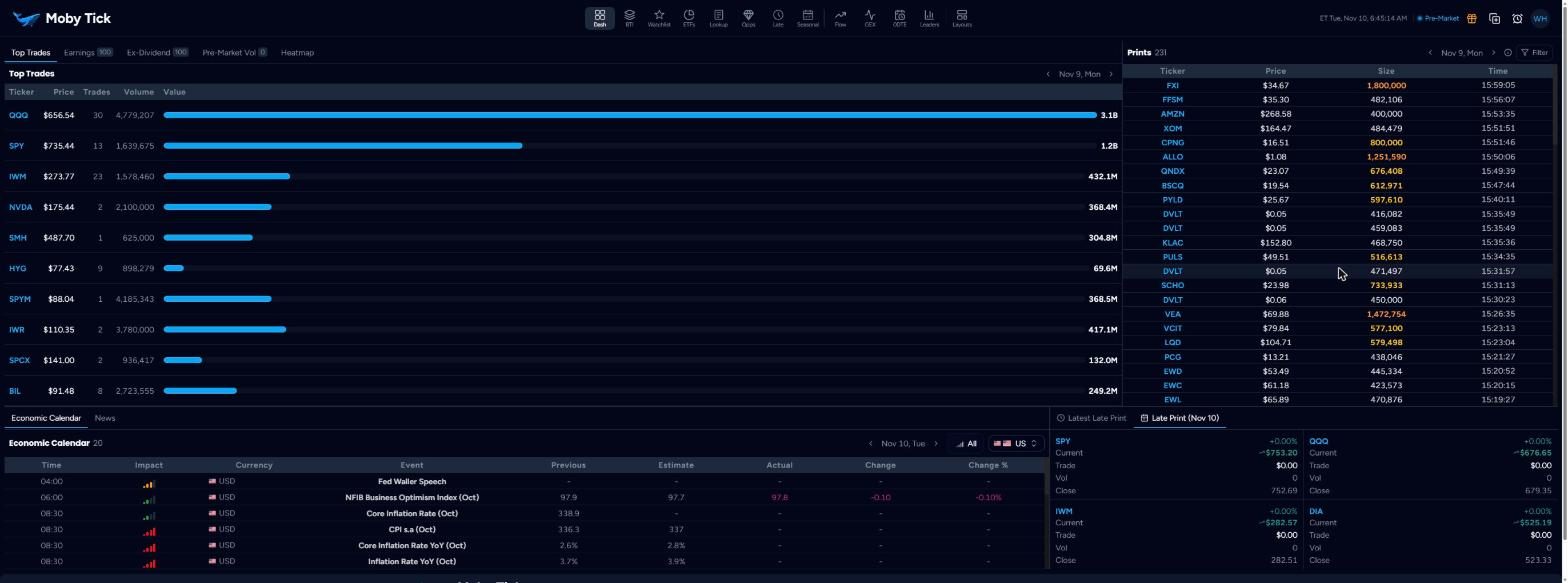
Top-left tabs
- Top Trades
- Tickers ranked by the total value of their block trades for the day, with price, number of trades, volume and a value bar. Use the date arrows to go back a day. Before 9:30 ET it shows Pre-market session in progress with a link to the previous day.
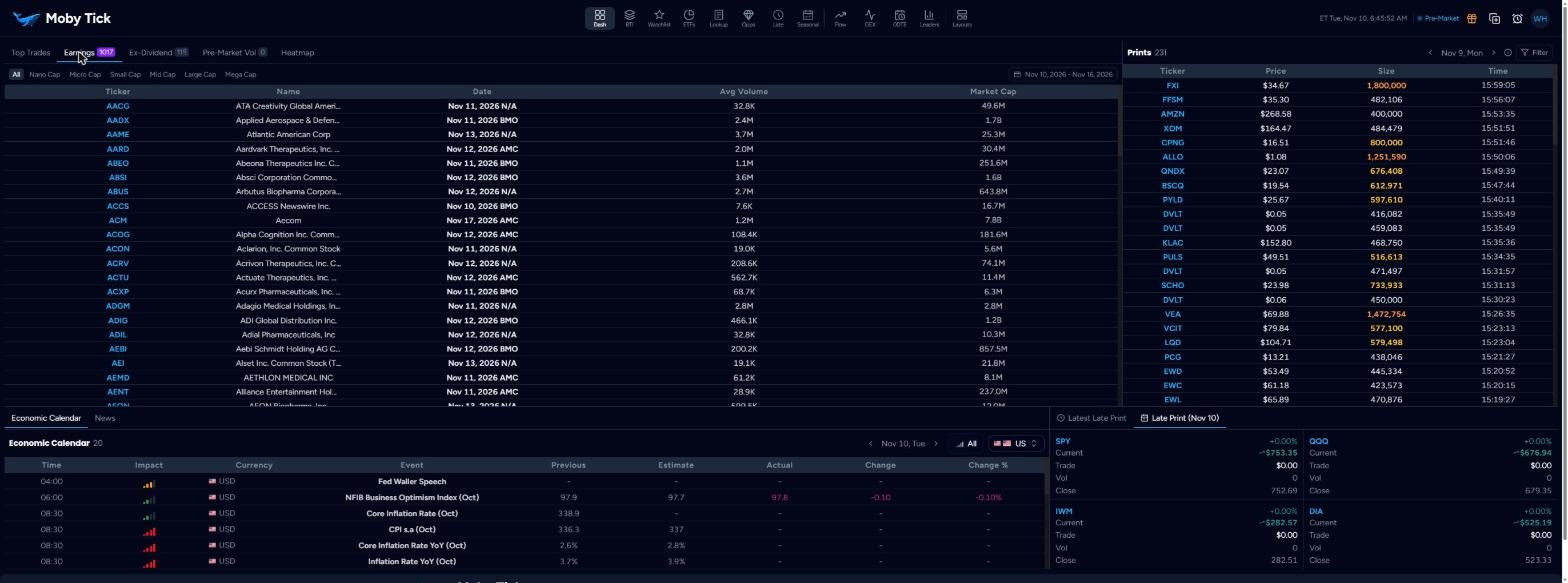
- Earnings
- Companies reporting this week with name, date and time (BMO before open, AMC after close), average volume and market cap. Filter by size: All, Nano, Micro, Small, Mid, Large, Mega cap. The count badge shows how many.
- Ex-Dividend
- The same layout for upcoming ex-dividend dates.
- Pre-Market Vol
- The heaviest pre-market volume. It fills as pre-market trading builds.
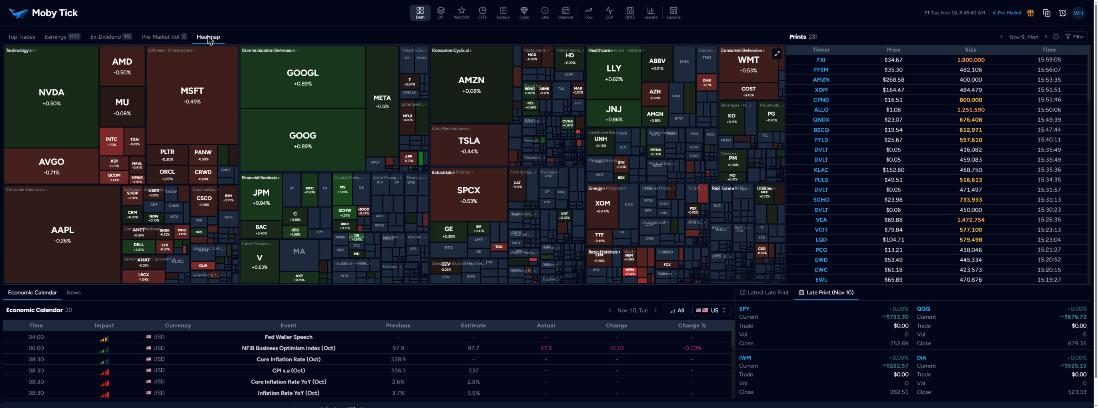
- Heatmap
- Stocks grouped by sector and industry, sized by market cap and coloured by daily change. The expand icon opens it full size.
Prints panel
Every block that meets the filter, newest first, with Ticker, Price, Size and Time. Size is colour coded:
Click Filter to set the minimum size (default 400K), limit to market hours, and exclude opening and closing trades. Click the ⓘ icon for the colour key.
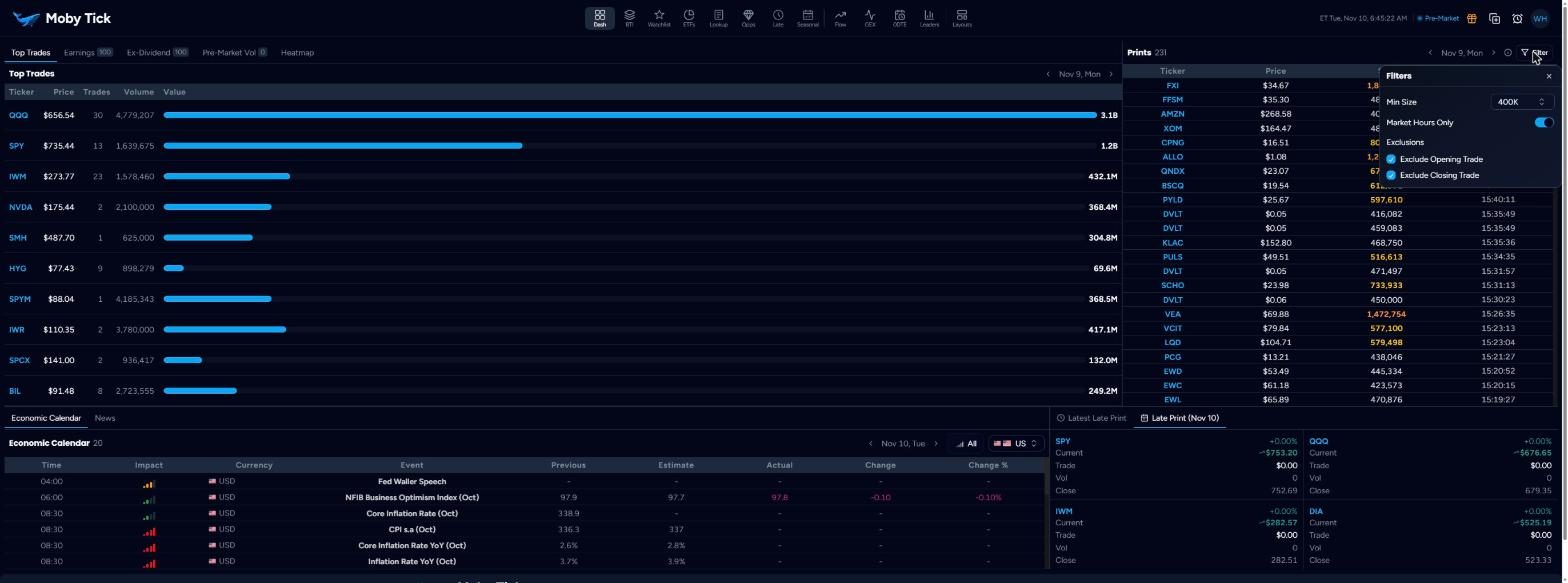
Economic Calendar and News
The calendar lists each event's time, impact (one to three bars), currency, previous, estimate, actual and change. Use the arrows to change day, the impact filter to show only high-impact events, and the country selector. The News tab shows headlines with summaries and ticker tags marked Positive, Negative or Neutral.
Late print cards
The bottom-right cards show SPY, QQQ, IWM and DIA. Latest Late Print shows the most recent late block's price, volume and value against the current price. Late Print (date) shows the selected day. For history, open Late Prints.