Tools · Seasonal
Seasonality
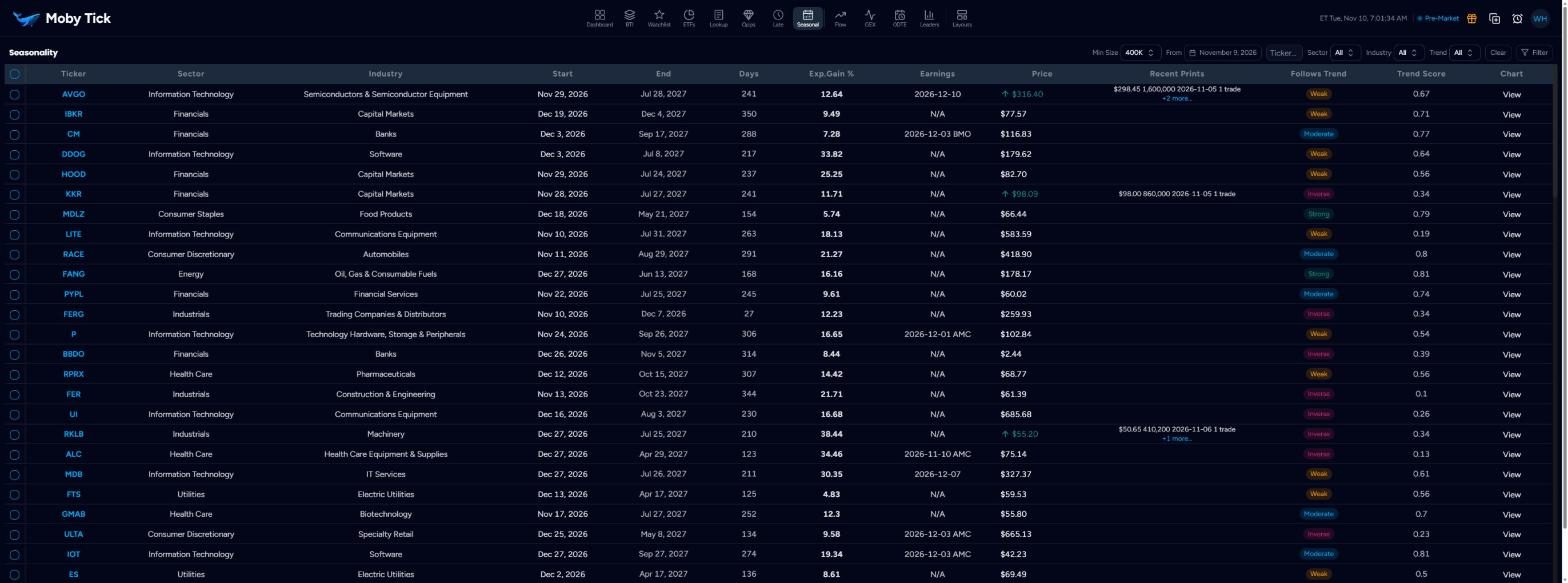
Seasonality lists tickers entering a historically strong window and tells you how closely this year is following that pattern.
Filters
Min Size (print size for the Recent Prints column, default 400K), From date, Ticker, Sector, Industry, Trend (Strong, Moderate, Weak, Inverse), Clear, and the Filter menu: Only Prints (only tickers with recent prints), Ignore N/A Trends, Stocks, Indices.
Columns
- Start / End / Days
- The estimated seasonal entry and exit dates and the length of the window.
- Exp.Gain %
- The average historical gain over that window.
- Earnings
- Next earnings date inside or near the window.
- Recent Prints
- Recent large prints over Min Size.
- Follows Trend
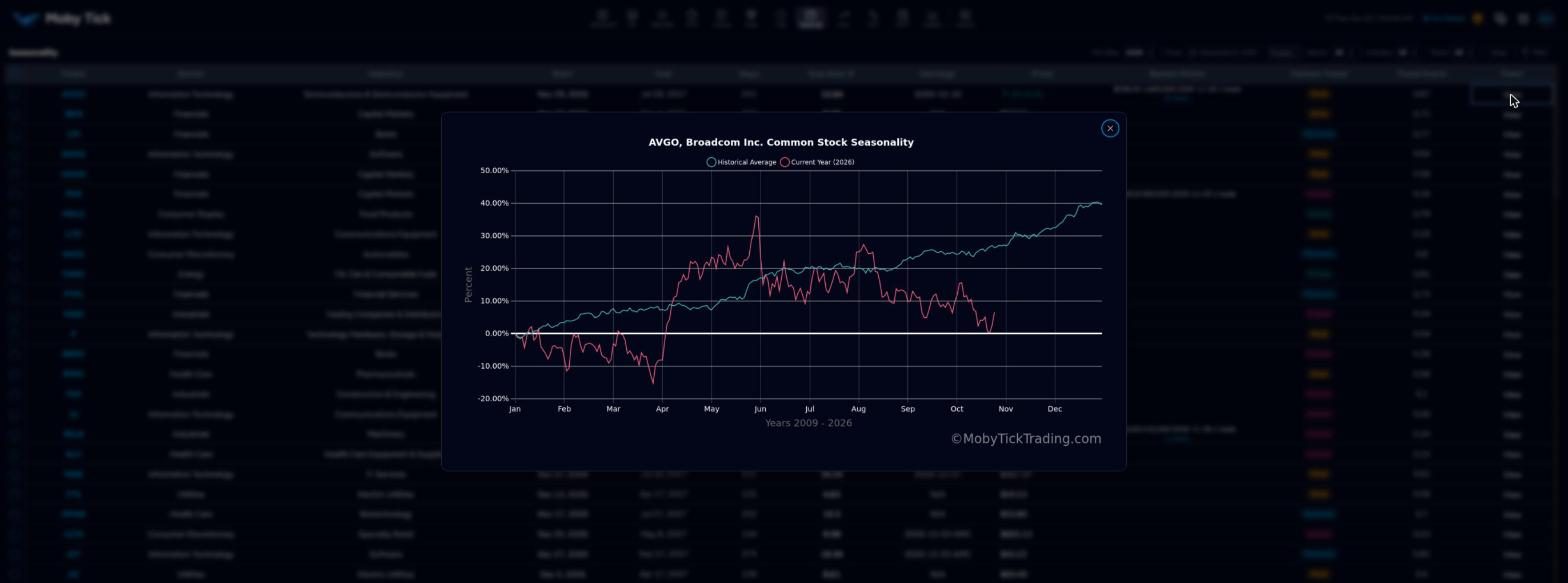
- Strong, Moderate, Weak or Inverse: how closely this year matches the seasonal path.
- Trend Score
- The same measure from 0 to 1.
- Chart
- View opens this year against the historical average.