Tools · Layouts
Custom Layouts
Build your own screen from Moby Tick components. Open Layouts in the menu to pick a saved layout or click Add New Layout.
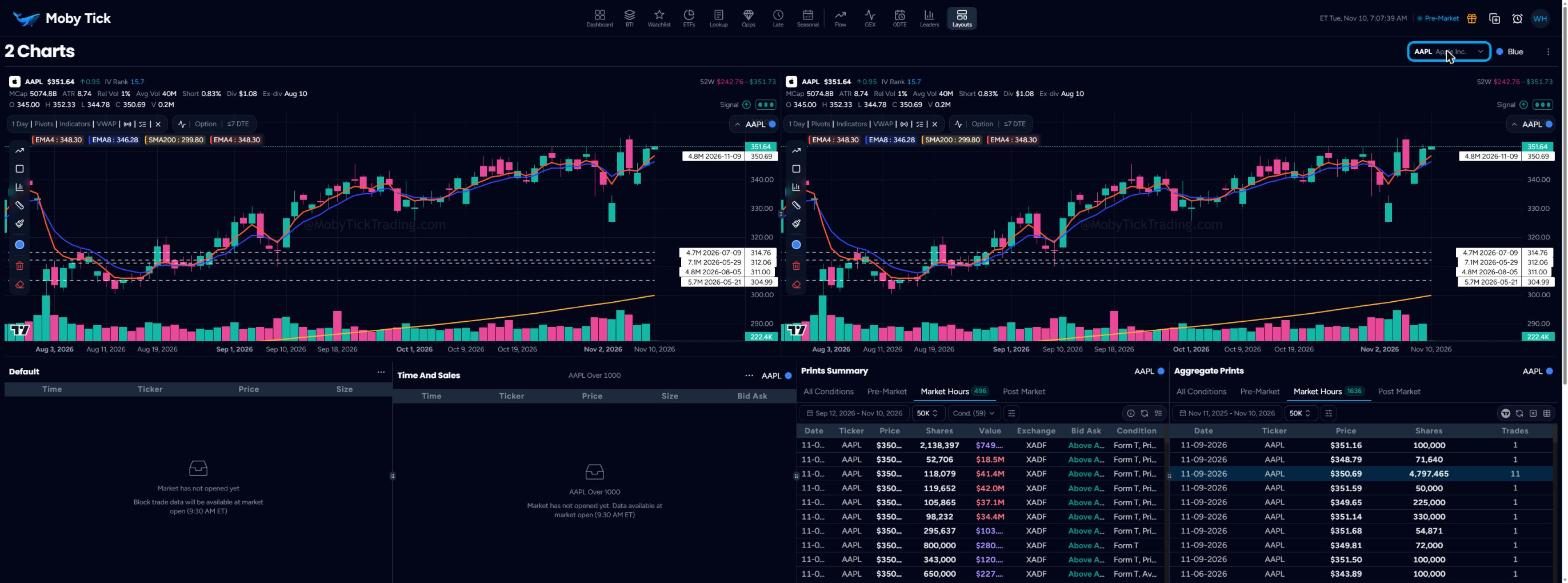
Linking panels to one ticker
Each panel has a colour dot. Panels on the same colour follow the same ticker. Type a ticker in the layout's search box and every Blue panel switches to it. Change a panel's colour (Blue, Orange, Red, Green, Purple, Indigo, Pink, Teal, Yellow or Cyan) to have it follow a different ticker.
Building or editing a layout
- Open the layout's ⋮ menu and choose Edit, or click Add New Layout.
- Start from a Template: Day Trader (chart and BTI with Time & Sales, Top Trades and Prints), Swing Trader (large chart with watchlist, news and calendar), Flow Watcher (BTI and Trade Map with aggregates and prints) or Market Scanner (pre-market and heatmap with watchlist and top trades).
- Or drag Components onto the canvas. Rows have a height you can change; click + Column to split a row (up to four columns) and Add Row for more.
- Use undo, redo and Preview to check it, then Save Layout.
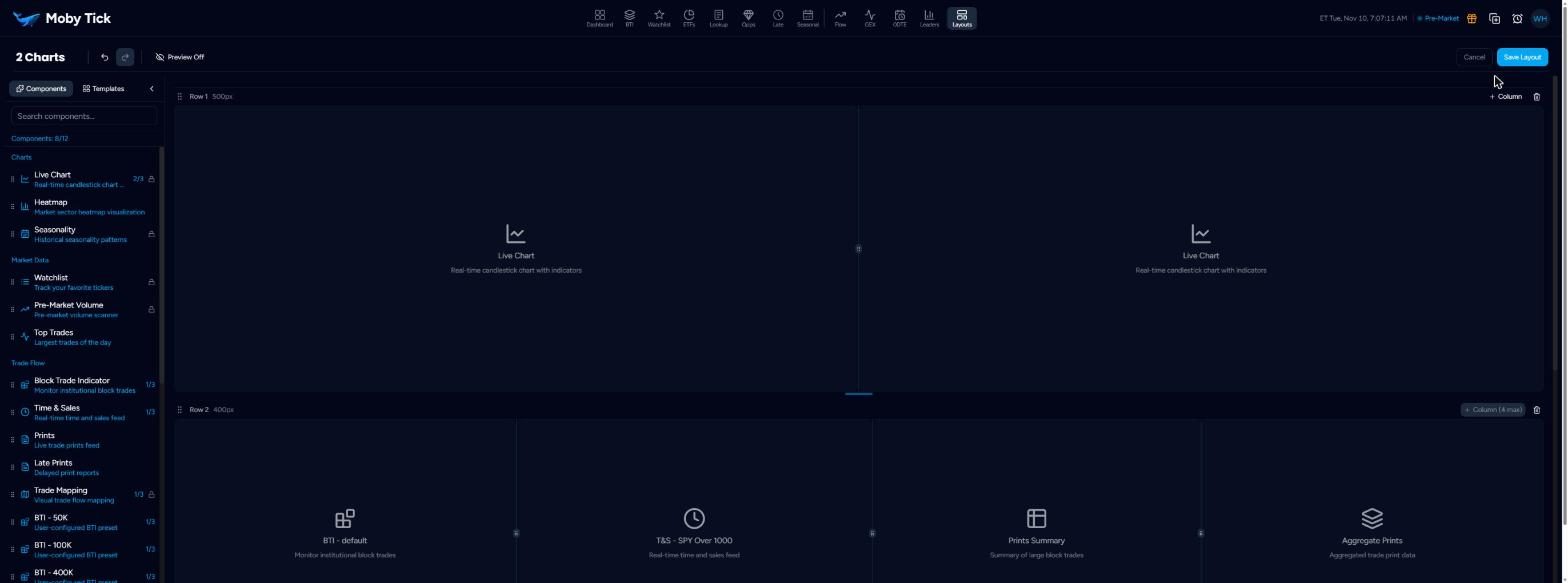
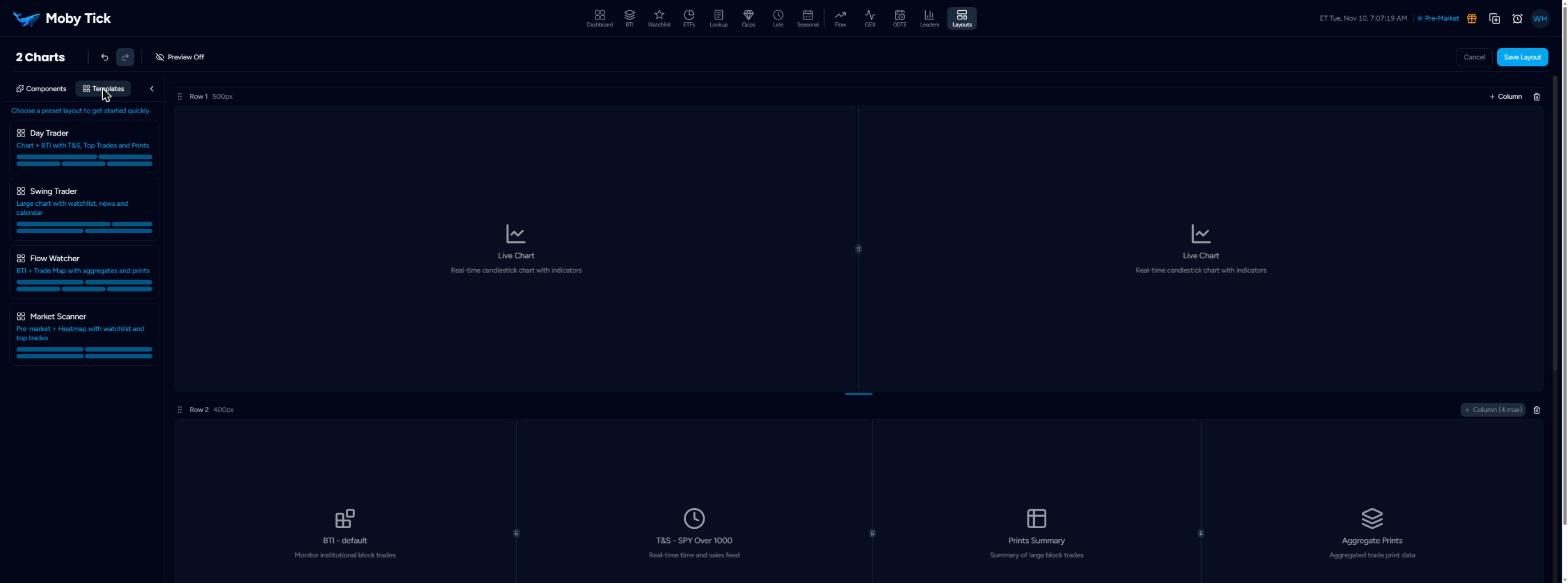
Components
| Group | Components |
|---|---|
| Charts | Live Chart (the Print Lookup chart), Heatmap, Seasonality |
| Market Data | Watchlist, Pre-Market Volume, Top Trades |
| Trade Flow | Block Trade Indicator, Time & Sales, Prints, Late Prints, Trade Mapping, and your saved BTI and Time & Sales presets |
| Analysis | Aggregate Prints, Prints Summary, Unhit SSP (levels within ±8 ATR that price has not returned to) |
| Information | News, Economic Calendar |
A count such as 2/3 beside a component shows how many are on the layout and the maximum allowed. A lock icon marks a component that cannot be added to this layout right now.