Tools · Lookup
Print Lookup
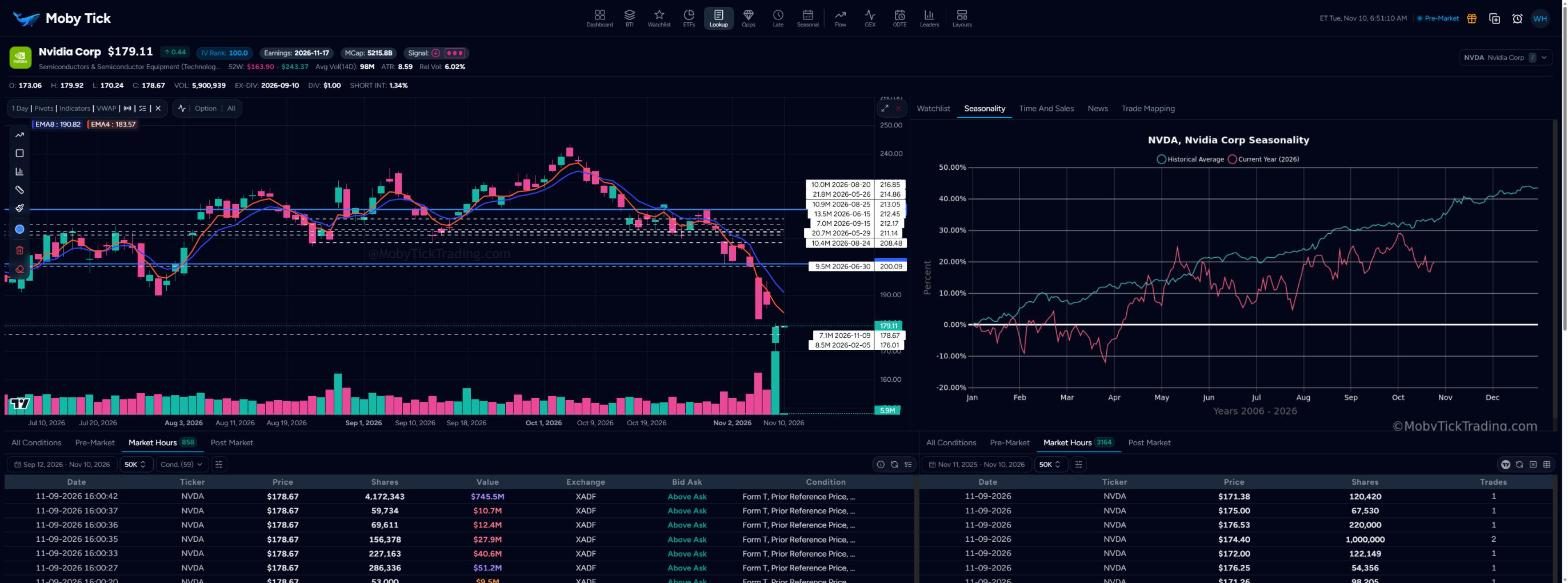
Print Lookup is where you study one ticker. The chart shows its ten largest dark pool prints as labelled levels. Below the chart are every qualifying print and the same prints grouped by price. On the right are your watchlist row, seasonality, time and sales, news and Trade Mapping.
The ticker header
The header gives the context you need before reading the chart.
| Field | Meaning |
|---|---|
| Price and change | Last price and change since the prior close. |
| IV Rank | Where implied volatility sits in its one-year range, 0 to 100. |
| Earnings | Next earnings date. |
| MCap | Market capitalisation. |
| Signal | The three-dot signal meter. See Signals. |
| 52W | 52-week low and high. |
| Avg Vol (14D) | Average daily volume over 14 days. |
| ATR | Average true range in dollars. |
| Rel Vol | Today's volume so far compared with normal. |
| O / H / L / C / VOL | Open, high, low, close and volume for the latest session. |
| EX-DIV / DIV | Last ex-dividend date and dividend amount. |
| SHORT INT | Short interest as a percentage of float. |
Reading the print levels
Each of the ten largest prints in the selected period is drawn as a dashed line with a label on the price axis.
What to look for:
- Clusters. Several labels close together form a zone. Zones are stronger than single prints.
- Which side price is on. Prints below price are potential support; prints above are potential resistance.
- Size relative to the stock. A 1M-share print matters more in a stock that trades 3M a day than in one that trades 100M.
- Reactions. Look back at what price did the last time it returned to the level.
To plot more prints, click rows in the aggregated prints table at the bottom right. Click Clear Selection to remove them.
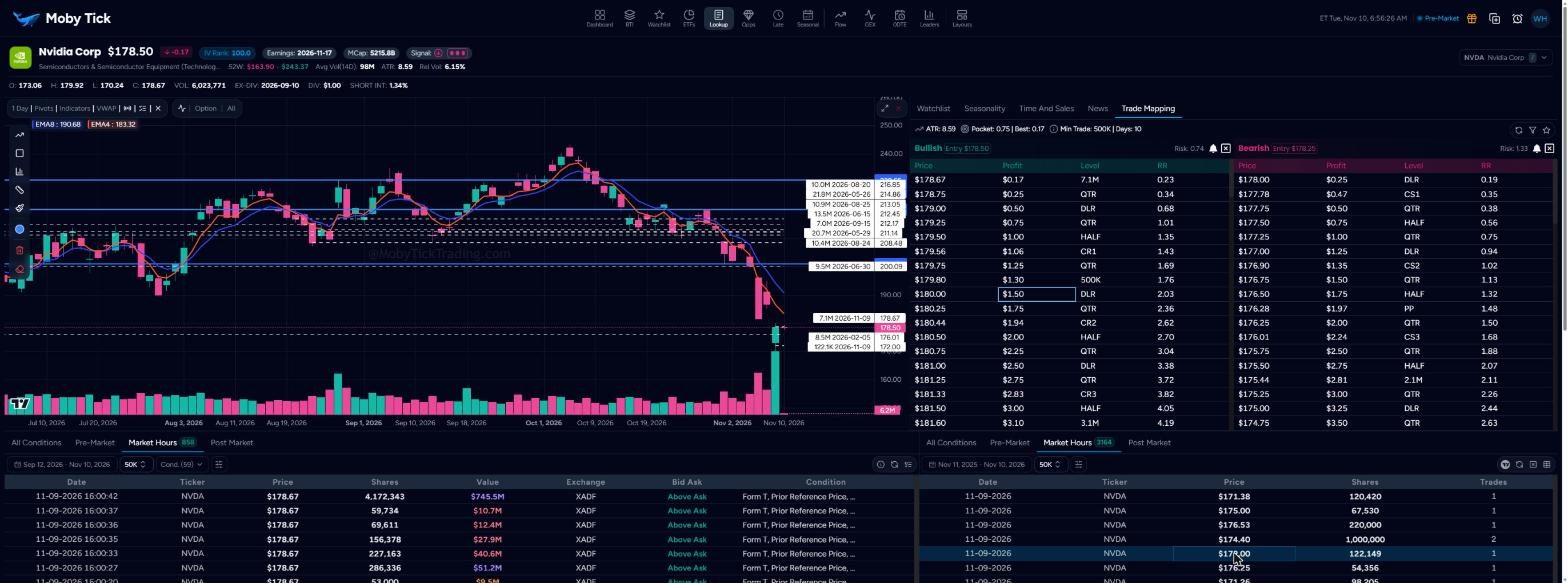
Chart toolbar
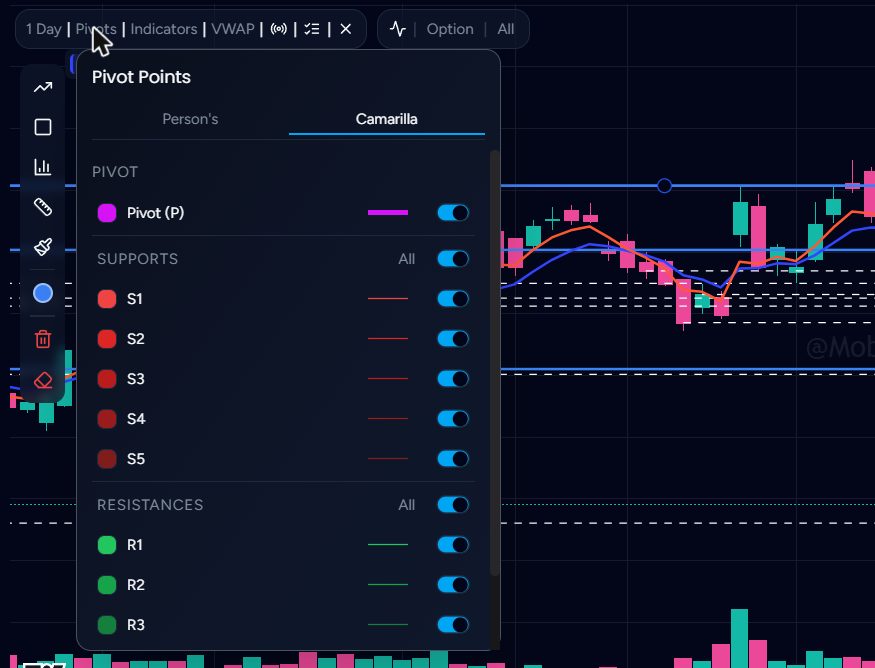
The toolbar above the chart reads, from left to right:
- Timeframe (1 Day)
- Minutes 1, 2, 3, 5, 15, 30; hours 1 or 4; daily 24 hour, 1 Day, 5 Day, 1 Week, 1 Month.
- Pivots
- Two pivot styles (tabs labelled Person's and Camarilla). Toggle the pivot P, supports S1–S5 and resistances R1–R5 individually or all at once, and set each colour.
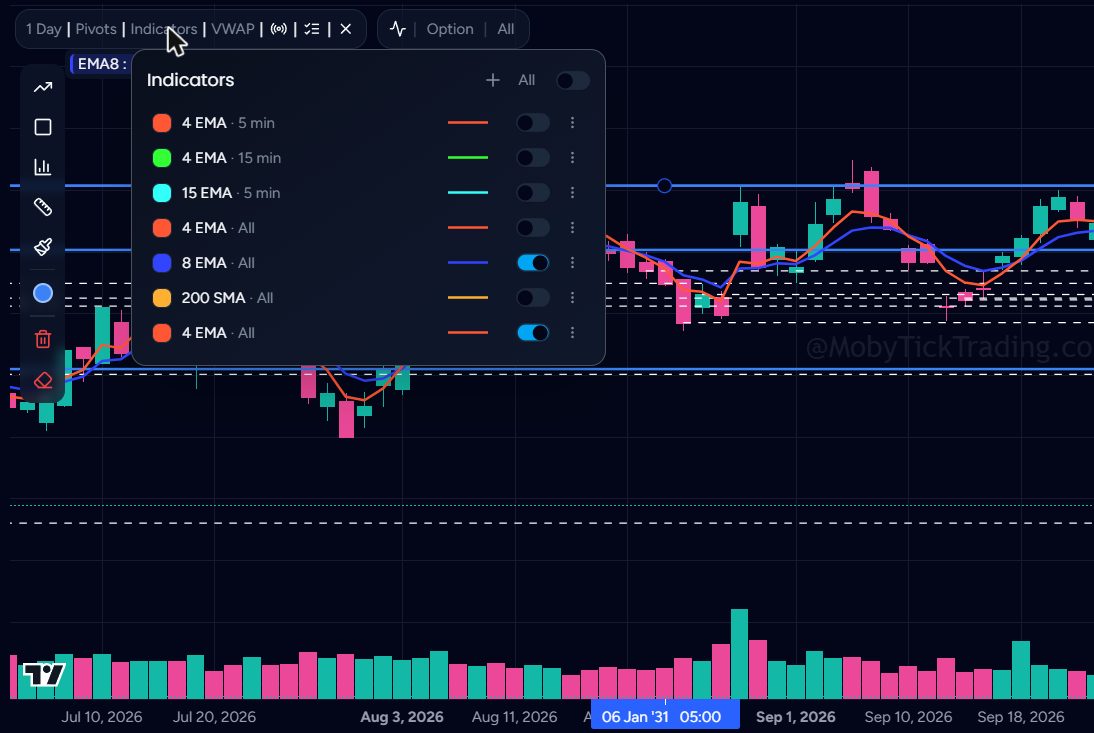
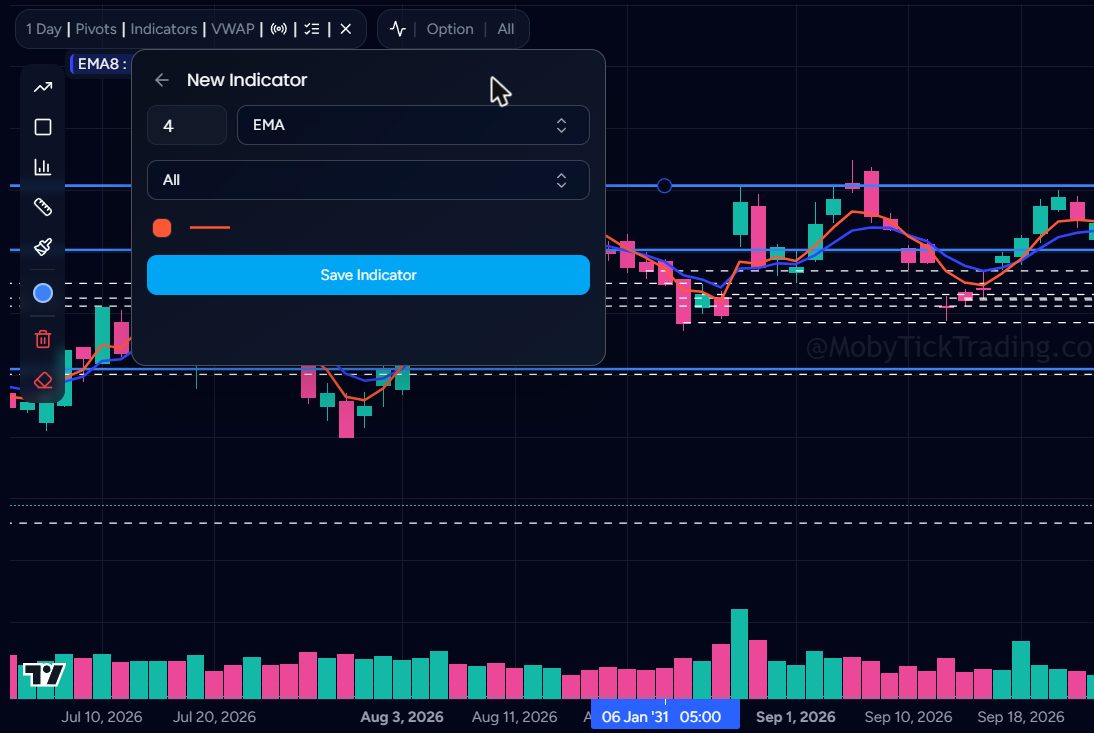
- Indicators
- Your moving averages. Each shows its colour, the timeframes it appears on, an on/off toggle and a ⋯ menu to edit or delete. Click + to add a new SMA or EMA, choose its length, the timeframes it appears on (All, Intraday, or one timeframe) and its colour.
- VWAP
- Session VWAP with interval chips (1 min to 4 hours, or All / None), an anchored VWAP from a date you choose, and a weekly VWAP.
- ((•)) Enable Live Trades
- Streams live trades onto the chart during the session.
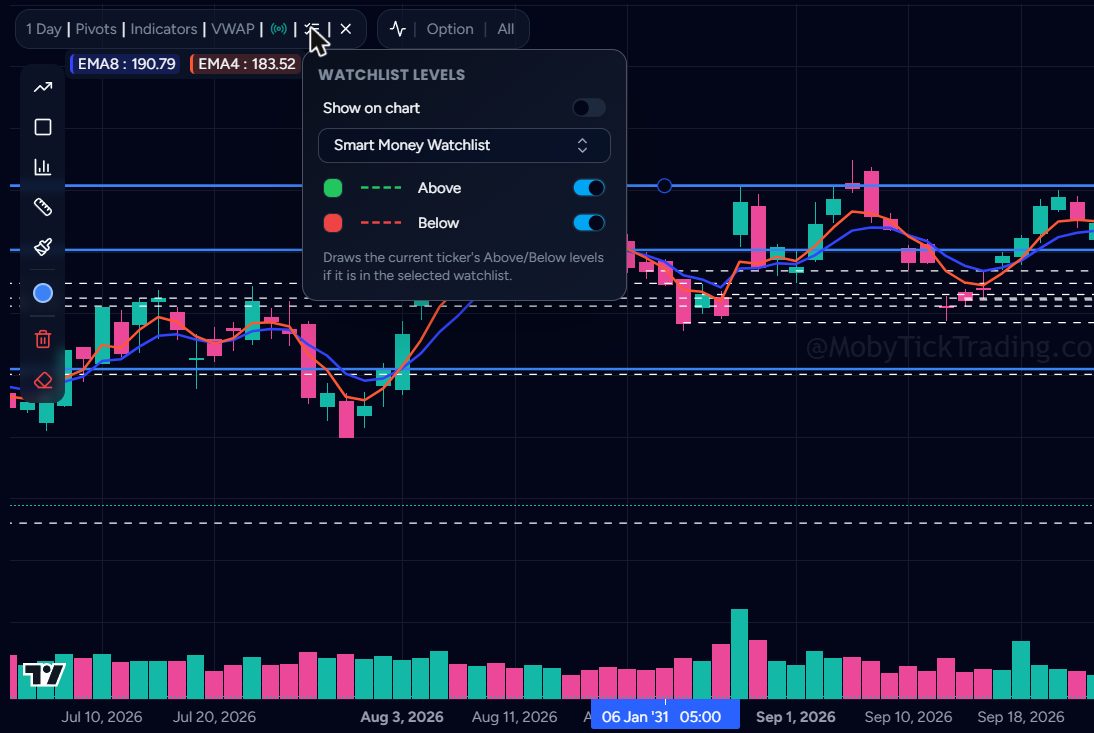
- ☰✓ Watchlist Levels
- Draws the ticker's Above (green) and Below (red) levels from a watchlist you choose. Turn on Show on chart and pick the list.
- × Hide EMA/SMA price
- Hides the moving-average value labels at the top left of the chart.
- ∿ Enable OI walls
- Turns on the options overlay described below.
- Option
- Options overlay settings.
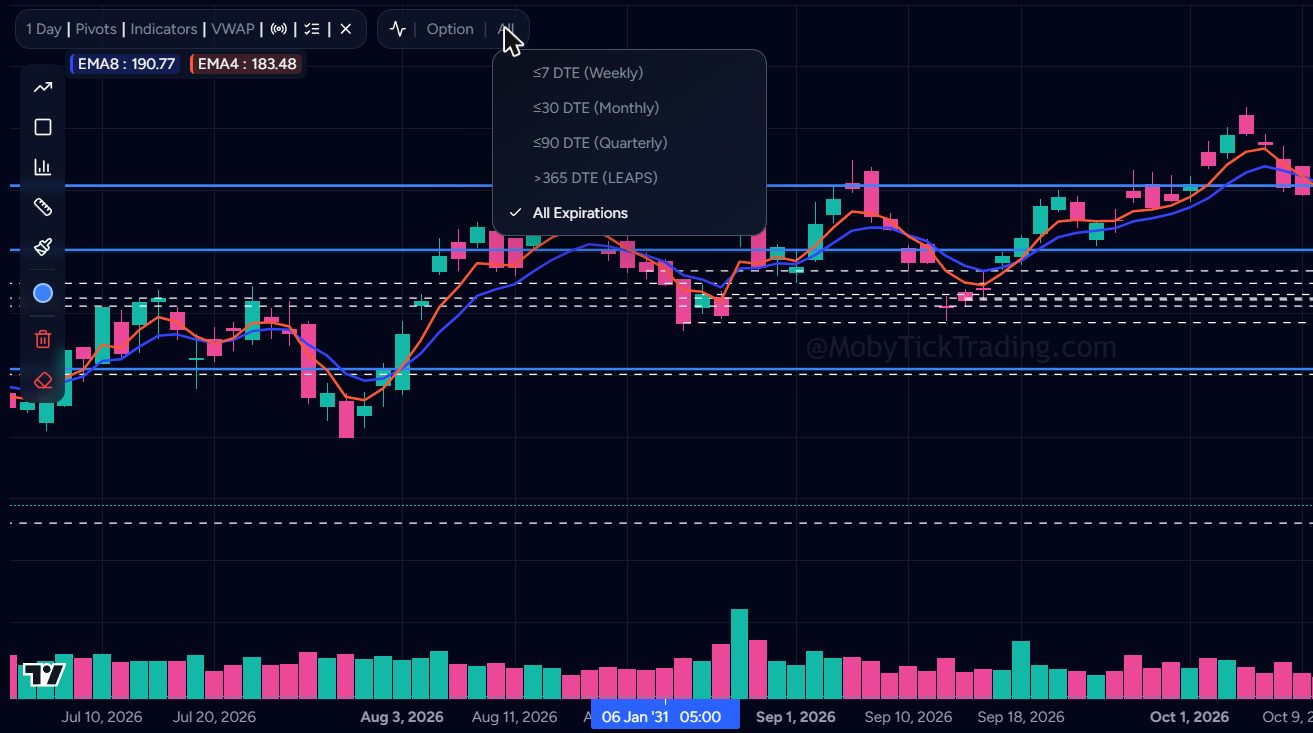
- All (expirations)
- Which expirations the options overlay uses.
Options overlay: walls, gamma flip and max pain
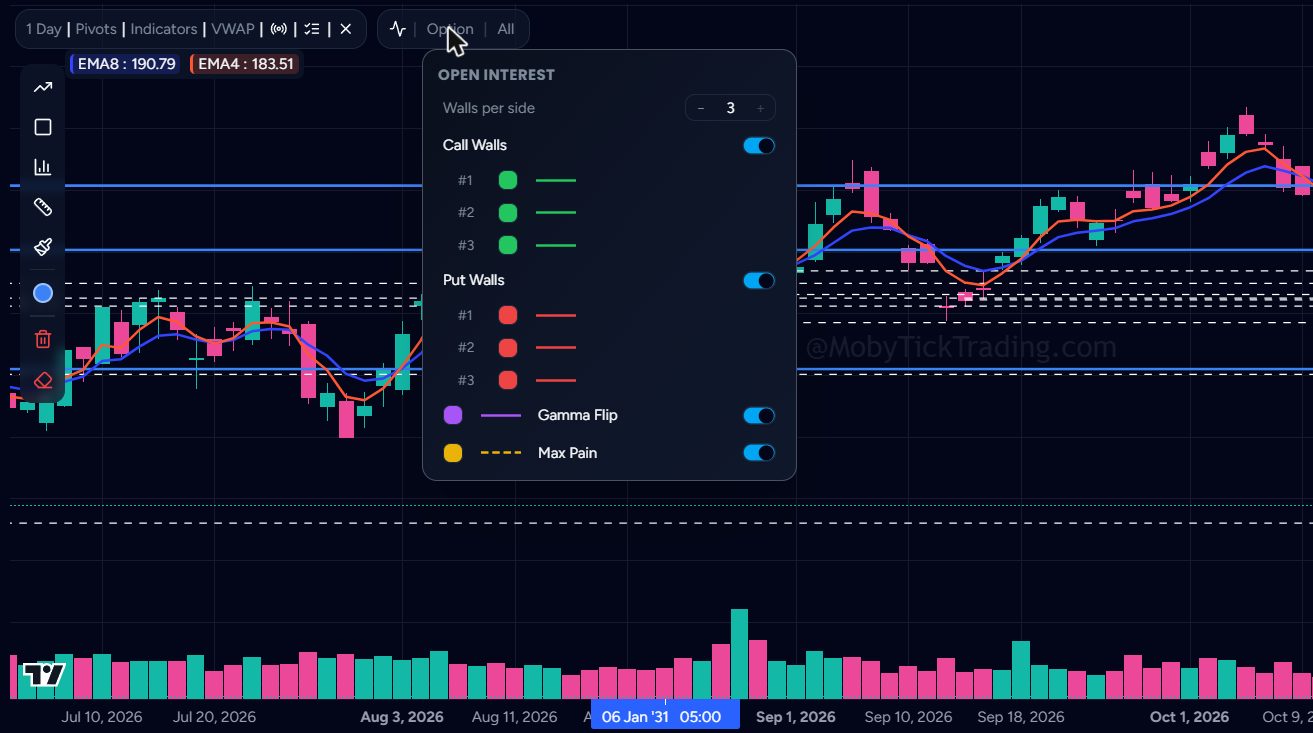
Turn on ∿ Enable OI walls to draw options positioning on the price chart, so you can see dark pool levels and options levels together.
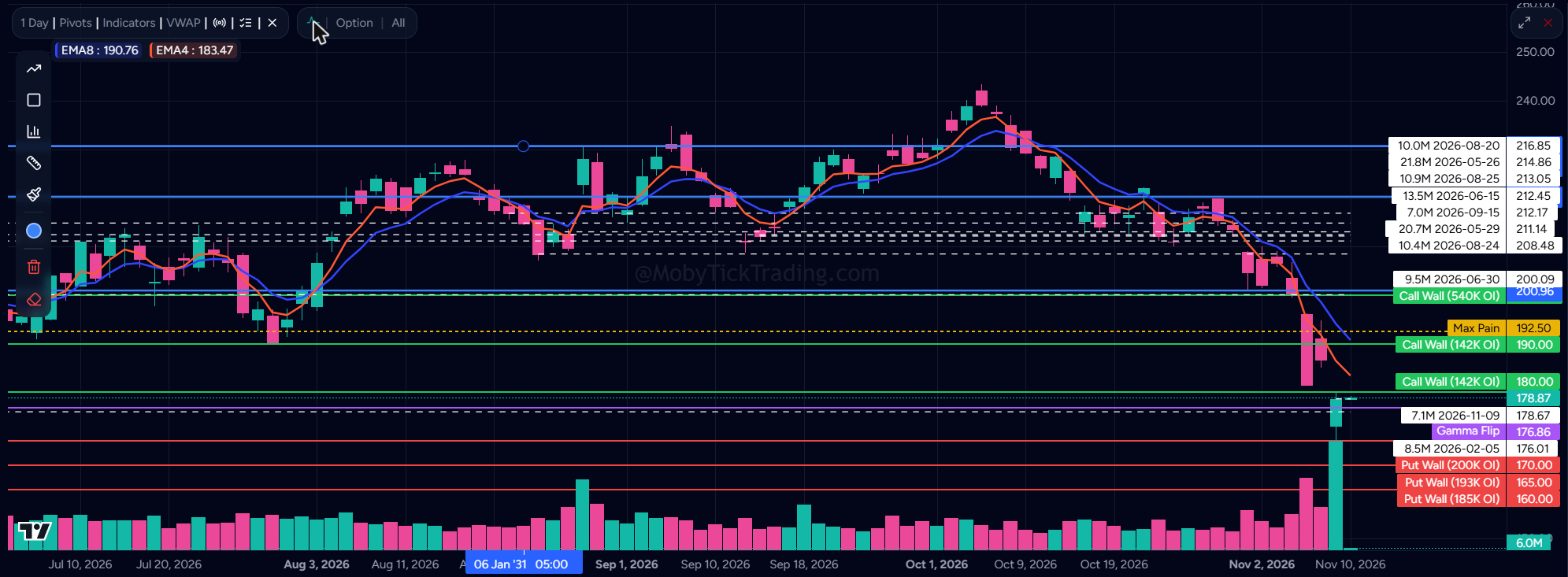
- Walls per side
- How many call walls and put walls to draw (default 3). Each wall label shows its open interest, for example Call Wall (540K OI).
- Call Walls #1–#3
- Strikes with the most call open interest. Often resistance.
- Put Walls #1–#3
- Strikes with the most put open interest. Often support.
- Gamma Flip
- The price where estimated dealer gamma changes sign.
- Max Pain
- The strike where the most option value expires worthless.
- Expirations
- ≤7 DTE (weekly), ≤30 DTE (monthly), ≤90 DTE (quarterly), >365 DTE (LEAPS) or All Expirations.
Drawing tools
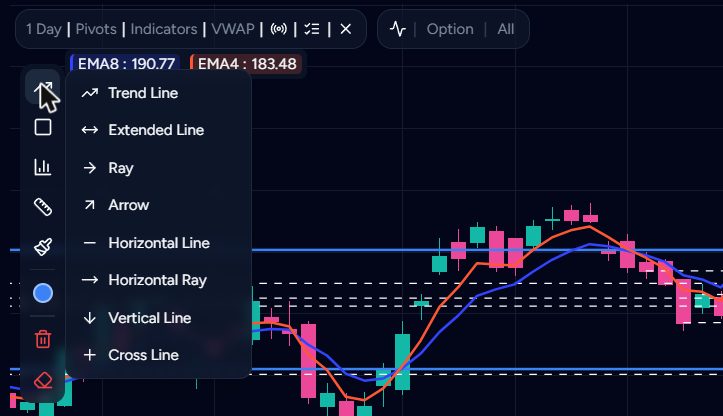
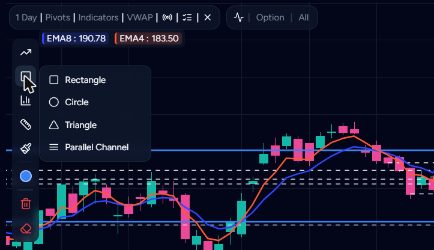
The vertical toolbar on the left edge of the chart holds the drawing tools. Click a tool group to open its menu.
| Group | Tools | Typical use |
|---|---|---|
| Lines | Trend Line, Extended Line, Ray, Arrow, Horizontal Line, Horizontal Ray, Vertical Line, Cross Line | Trend lines (wick to wick or body to body), key levels, event dates. |
| Shapes | Rectangle, Circle, Triangle, Parallel Channel | Mark a zone of prints or a consolidation; draw a channel. |
| Fibonacci | Fib Retracement | Retracement levels between a swing high and low. |
| Measure | Price Range, Long/Short Position | Measure a move, or lay out entry, stop and target with risk/reward. |
| Brush | Brush, Highlighter, Path | Freehand notes and highlights. |
| Colour | 10 colours and 4 line thicknesses | Colours you pick are saved as presets. |
| Delete selected | Trash icon or the Delete key | Removes the drawing you clicked. |
| Clear all | Eraser icon | Removes every drawing on this chart after you confirm. Cannot be undone. |
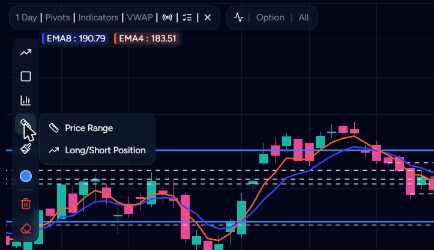
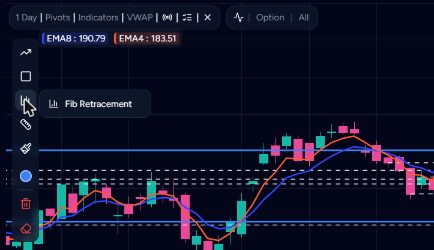
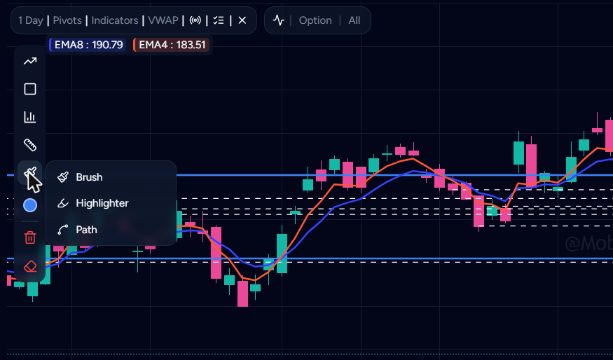
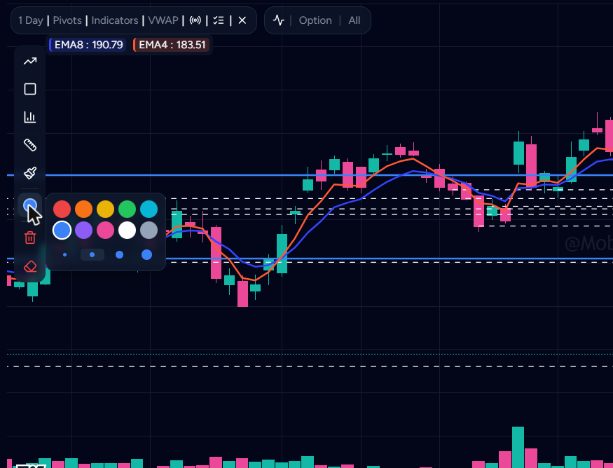
Drawings are saved with the ticker's chart. To edit a drawing, click it to select it and drag its handles. Other chart controls: scroll to zoom time, drag to pan, drag the price axis to stretch it, and click the expand icon (top right) for a larger chart. Ctrl + mouse wheel zooms the whole page and Ctrl+0 resets it.
Right-hand panel tabs
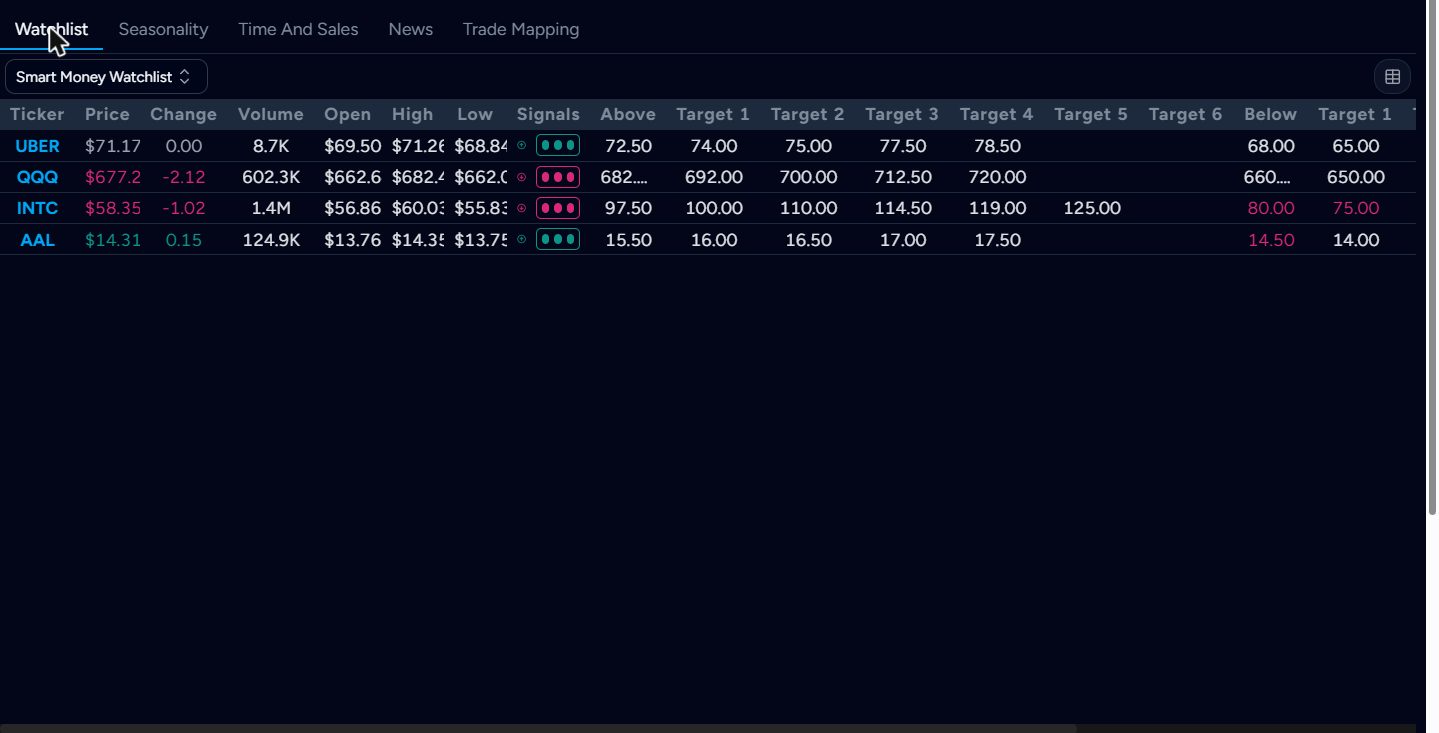
- Watchlist
- Your chosen watchlist with prices, signals, Above/Below levels and targets. Click a ticker to load it.
- Seasonality
- This year's path against the historical average for the same calendar dates.
- Time And Sales
- Individual trades for this ticker over a minimum size (for example “NVDA Over 1000”), with Time, Ticker, Price, Size, Exchange and Bid Ask. Use ⋯ to change the minimum size, colours and columns.
- News
- Recent headlines for the ticker.
- Trade Mapping
- Targets, profit and risk/reward. See Trade Mapping.
The print tables
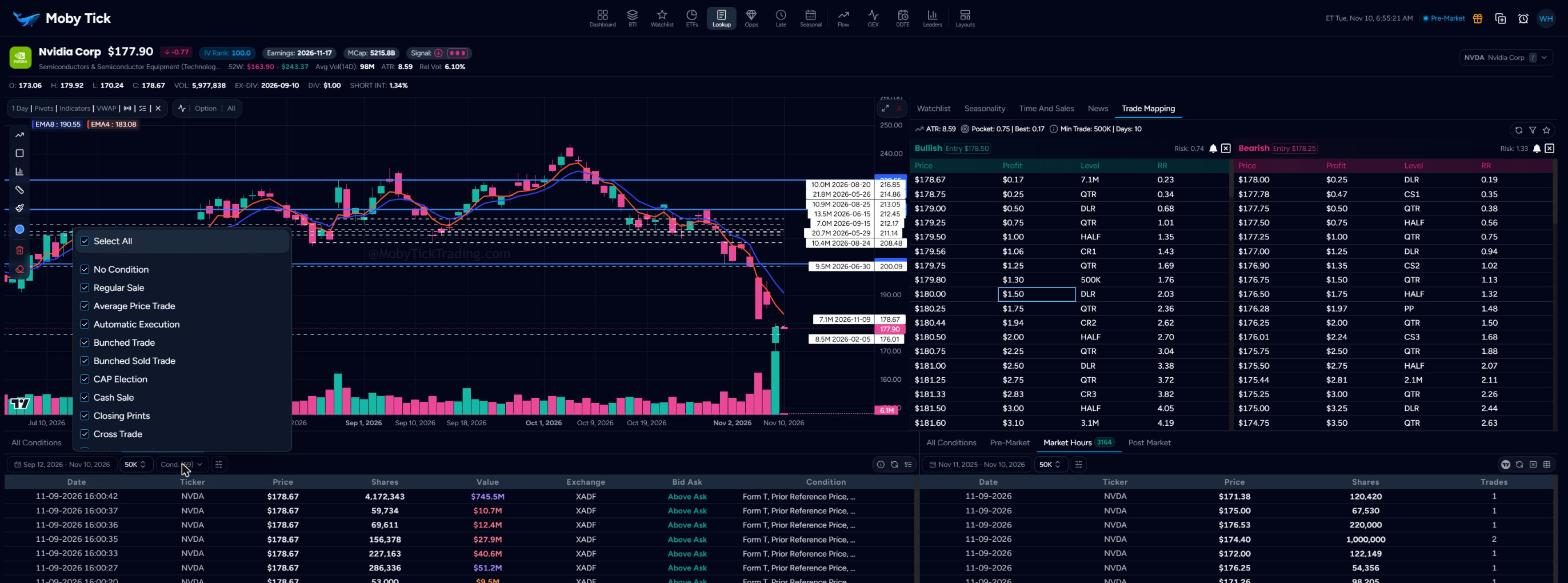
Below the chart are two tables. Both have session tabs: All Conditions, Pre-Market, Market Hours (with a count) and Post Market.
Individual prints (left)
Every print over your minimum size in the date range, with Date and time, Ticker, Price, Shares, Value, Exchange, Bid Ask and Condition.
- Date range: Today, Previous Day, Week, Month, 60 Days (default), 90 Days, 6 Month, Year, All, or Custom with a calendar.
- Size: minimum shares from 50K to 10M.
- Cond. tick or untick any of the 59 condition codes. See Trade condition codes.
- Sliders icon: Exclude Opening Trade and Exclude Closing Trade.
- ⓘ value key: Large $1M–$5M, Very large $5M–$10M, Huge $10M–$50M, Massive $50M+.
- Refresh and Select columns.
Aggregated prints (right)
The same data grouped by day and price, with total Shares and number of Trades. The default range is one year. Click rows to plot them on the chart, use Clear Selection to remove them, and use the TradingView icon to open the Pine Script generator.
Sending prints to TradingView
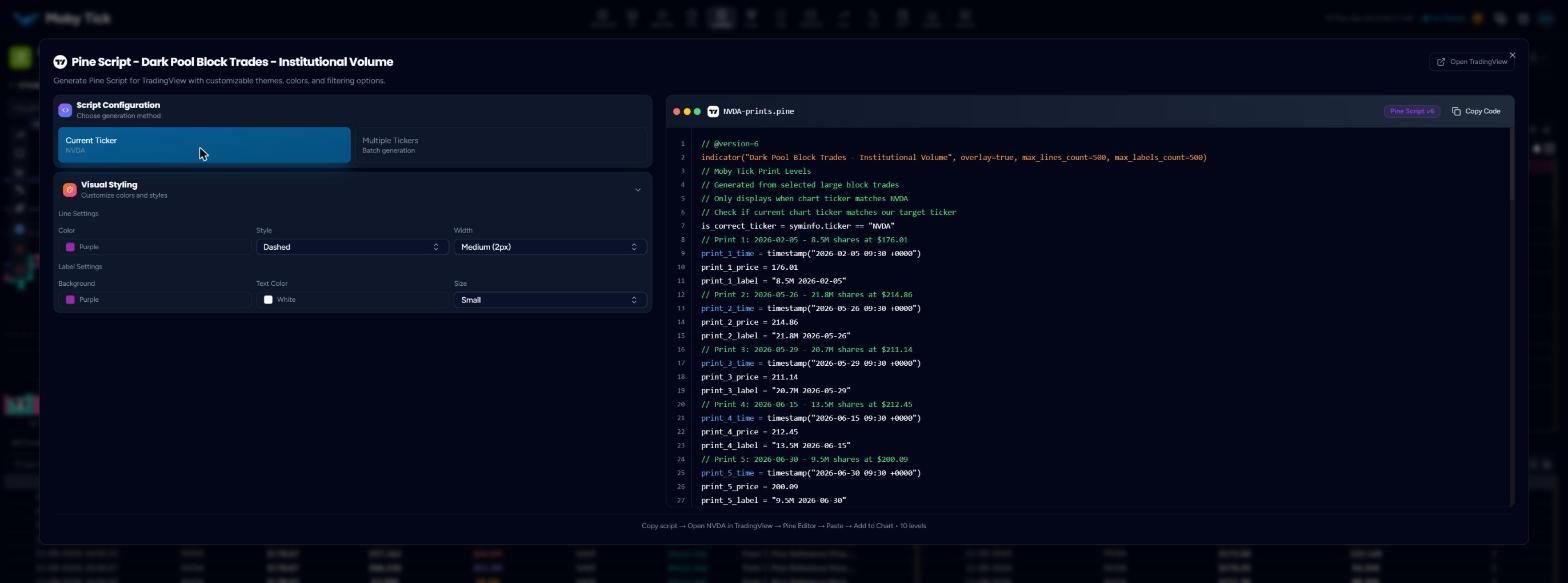
Click View prints on TradingView above the aggregated table. The generator writes a Pine Script v6 indicator that draws the dark pool levels on your TradingView chart.
- Choose Current Ticker or Multiple Tickers (up to 50, typed, imported from a watchlist or from a saved list).
- Open Visual Styling to set line colour, style and width, and label background, text colour and size.
- Open Data Filters to set the session, minimum size and excluded conditions.
- For multiple tickers, click Generate. The script appears on the right.
- Click Copy Code, then Open TradingView.
- In TradingView, open the ticker, open the Pine Editor, paste, and click Add to Chart.