Options · GEX
GEX Dashboard
Choose a ticker to see its gamma exposure profile. Filter by expiration with ALL EXPIRIES, 0DTE, WEEKLY, MONTHLY or QUARTERLY, and tick Show empty strikes to include strikes with no positioning. Before the open, the page shows the last session.
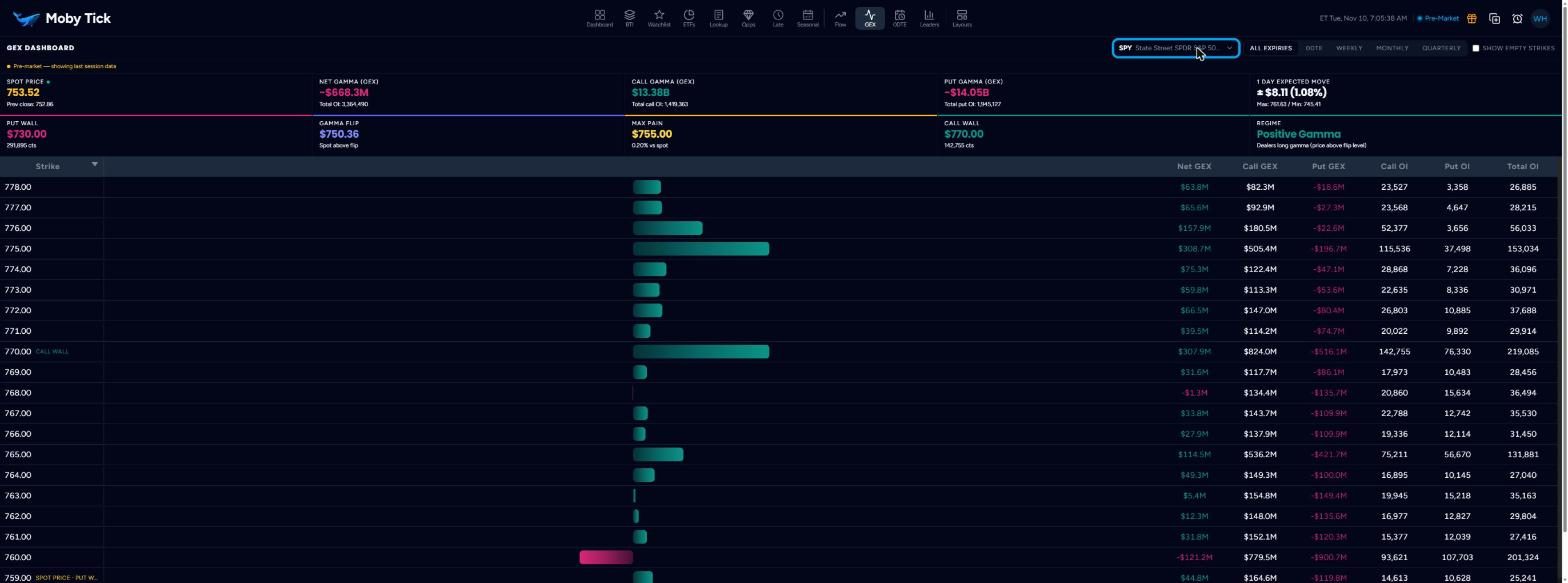
| Card | Meaning |
|---|---|
| Spot Price | Current price and previous close. |
| Net Gamma (GEX) | Call gamma plus put gamma in dollars, with total open interest. |
| Call / Put Gamma | Gamma exposure from calls and from puts, with open interest. |
| 1 Day Expected Move | The ± range implied by options for one day, with the max and min price. |
| Put Wall / Call Wall | The strikes with the most put or call positioning, with contracts. |
| Gamma Flip | Where net gamma changes sign, and whether spot is above or below it. |
| Max Pain | The strike where the most option value expires worthless, and its distance from spot. |
| Regime | Positive Gamma (dealers long gamma, price above flip) or Negative Gamma. |
The strike ladder shows a Net GEX bar for each strike (green positive, magenta negative) with Net, Call and Put GEX and Call, Put and Total OI. Tags mark the call wall, put wall and spot.