Tools · Opps
Opportunities
Opportunities scans the market for tickers with recent large prints and shows each one's context in one row, so you can shortlist setups without opening every chart.
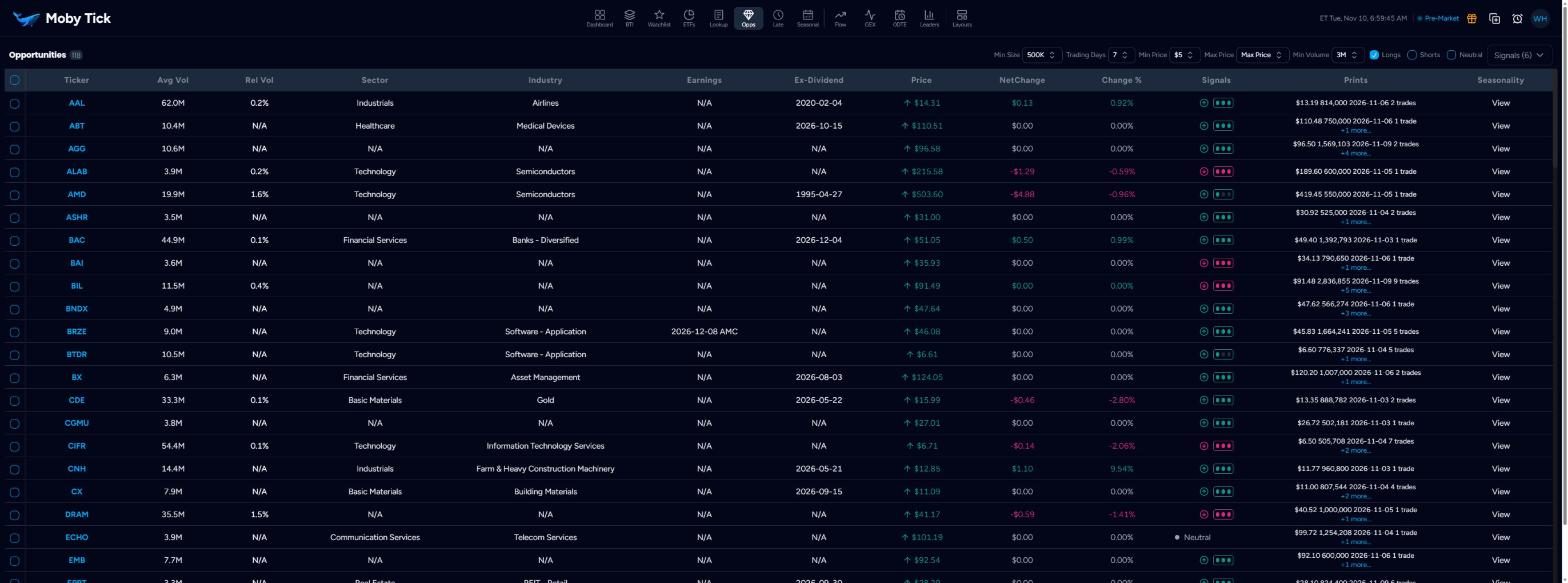
Filters
| Filter | Options | Default |
|---|---|---|
| Min Size | Minimum print size | 500K |
| Trading Days | 1–30 | 7 |
| Min Price | $1–$100, $200, $300 | $5 |
| Max Price | Any | Max Price (no limit) |
| Min Volume | Average volume 500K, 1M–10M | 3M |
| Longs / Shorts / Neutral | Which setups to show | Longs |
| Signals | Bullish, Bullish Volume, Bullish Confirmed and the three bearish signals | All six |
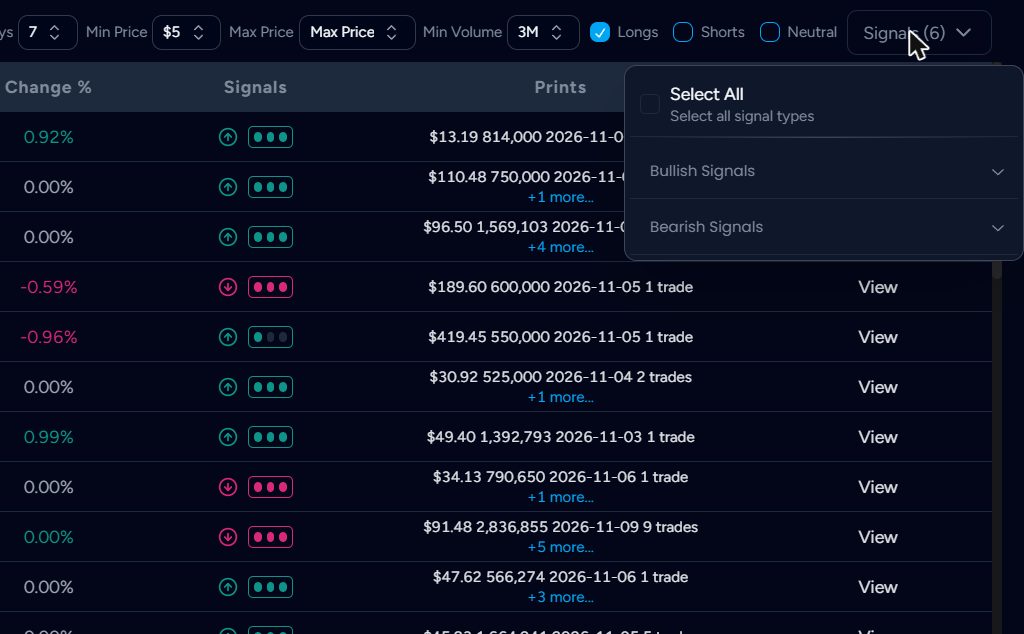
Columns
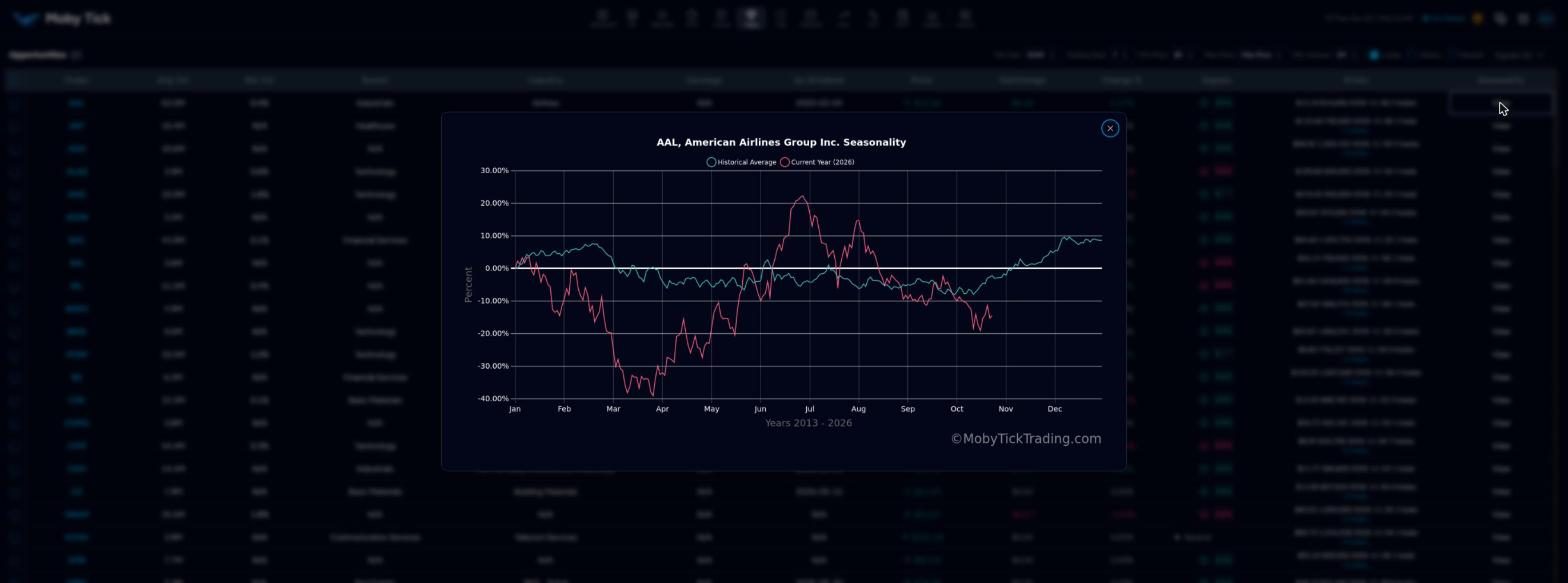
Ticker, Avg Vol, Rel Vol, Sector, Industry, Earnings, Ex-Dividend, Price, NetChange, Change %, Signals, Prints (largest qualifying print with price, size, date and number of trades; click +n more for others) and Seasonality (View opens the seasonal chart).
Tick rows and click + Add to watchlist to move your shortlist into a watchlist.