Tools · Lookup › Trade Mapping
Trade Mapping
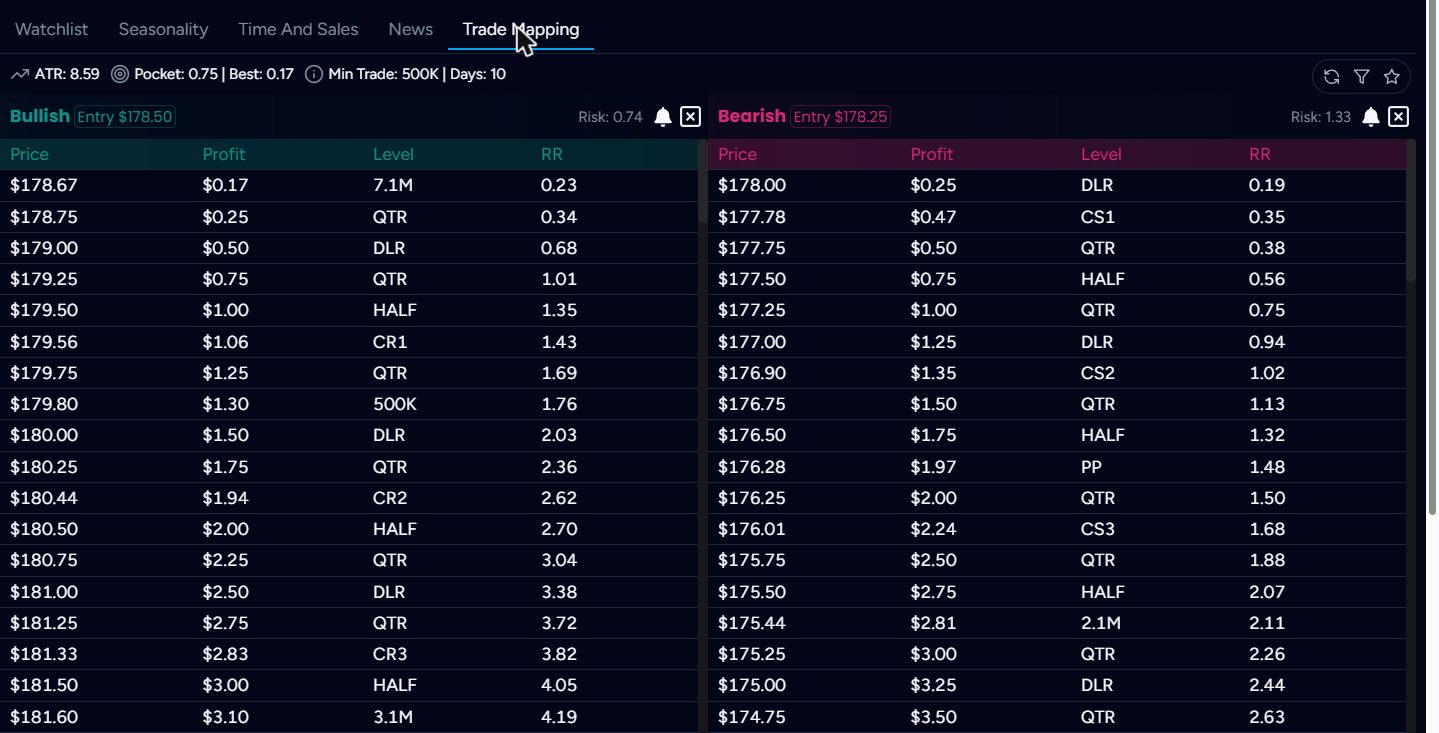
Trade Mapping lists the price levels above and below the current price, with the profit to each and its risk/reward. It answers two questions before you enter: where are the next targets, and is the trade worth the risk?
Columns
- Entry
- The entry price used for each side, shown next to Bullish and Bearish.
- Risk
- The distance to the stop, based on the Pocket setting.
- Price
- The target level.
- Profit
- Distance from entry to that level. Click the cell to edit it.
- Level
- Why the level is there (see below).
- RR
- Profit divided by risk.
Level codes
| Code | Meaning |
|---|---|
| 7.1M, 500K, 3.1M … | A dark pool print of that size. |
| DLR | Whole dollar. |
| HALF | Half dollar. |
| QTR | Quarter dollar. |
| CR1–CR3 | Camarilla resistance. |
| CS1–CS3 | Camarilla support. |
| PP | Pivot point. |
| R1 / S1 | Pivot resistance / support. |
Using it
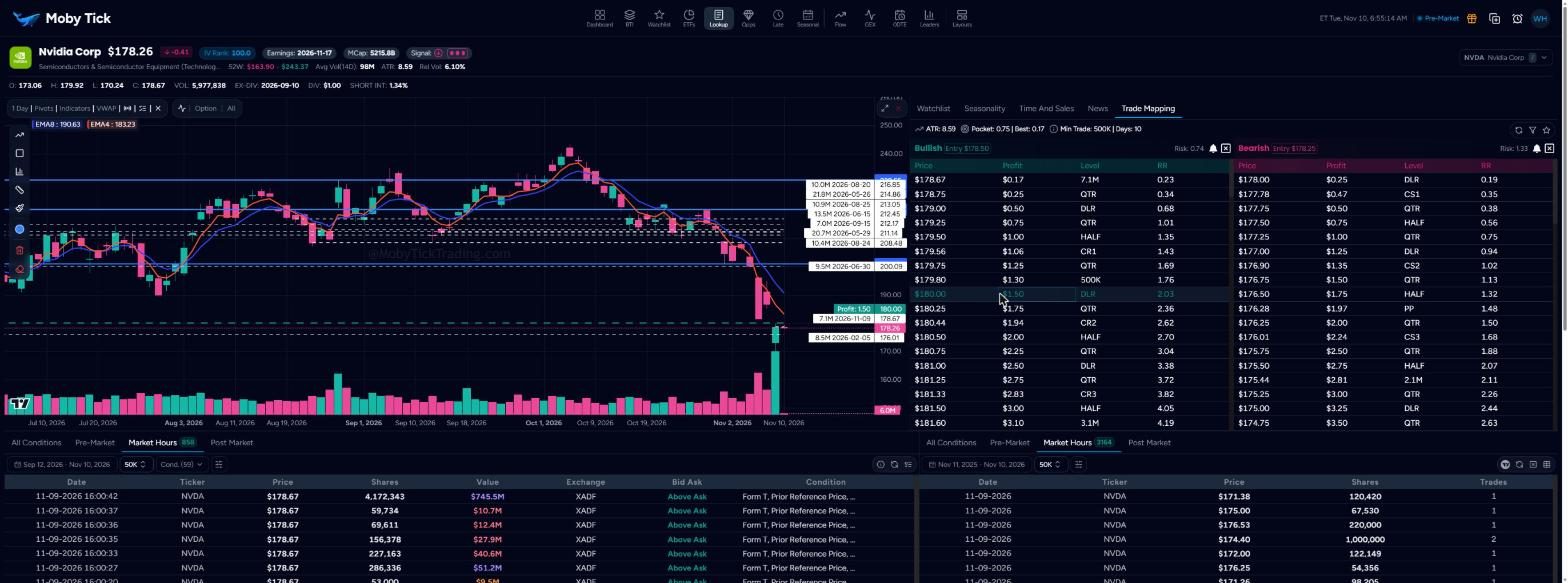
- Click a row to select it as your target. It is drawn on the chart with its profit.
- Click the bell on that side to create an alert at the level.
- Click × to clear the selection.
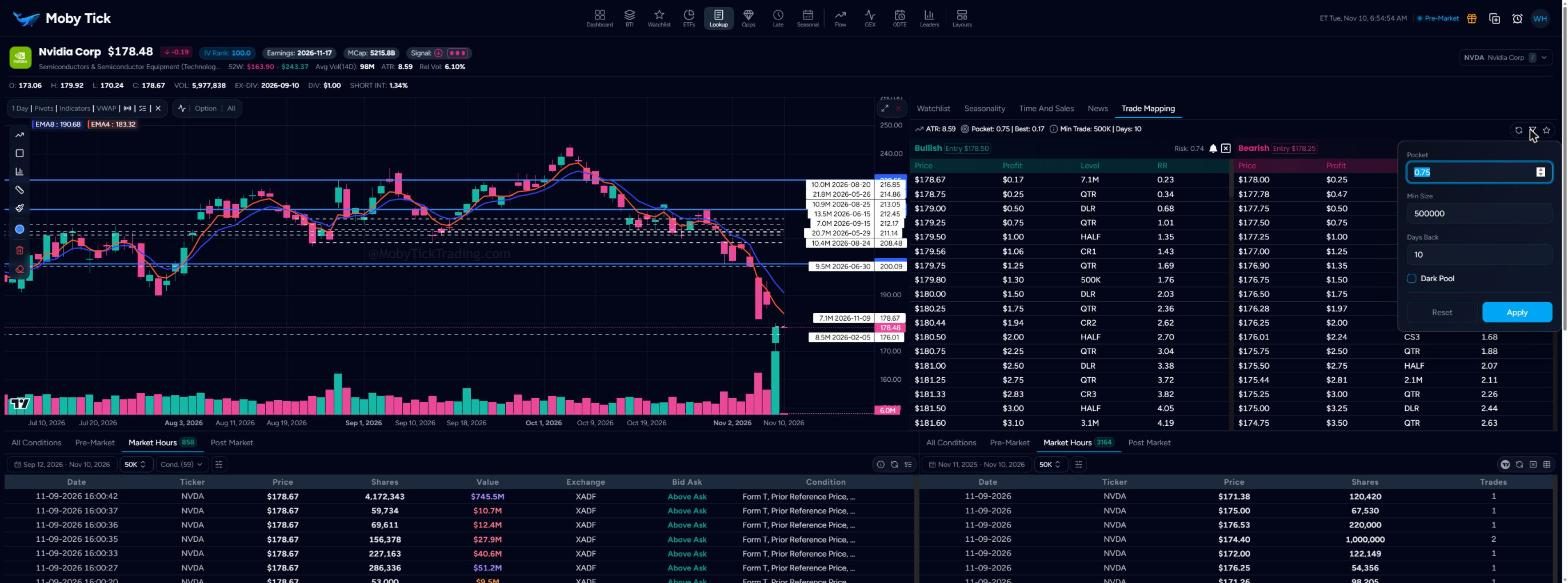
- Click the filter icon to change Pocket (default 0.75), Min Size of prints used (default 500K), Days Back (default 10) and whether to include dark pool levels, then click Apply. Reset restores the defaults.
- The star adds the ticker to a watchlist; the refresh icon recalculates.